
rjurney/Agile_Data_Code_2
rjurney/Agile_Data_Code_2 has 460 GitHub stars and 300 forks. Star changes are not measured yet. Last checked 2026-11-09 08:38 UTC. Last push 2026-02-11.
Code for Agile Data Science 2.0, O'Reilly 2017, Second Edition
측정된 스타 증가
- in 24h
- 업데이트 지연
- in 7 days
- 업데이트 지연
- in 15 days
- 업데이트 지연
- in 1 month
- 업데이트 지연
서로 겹치는 기간의 순증가량이며 일별 합계가 아닙니다. 측정값이 없으면 비워 둡니다. 스타는 관심도를 나타내며 품질을 보장하지 않습니다.
README.md
OriginalAgile Data Science 2.0 (O'Reilly, 2017)
This repository contains the updated sourcec code for Agile Data Science 2.0, O'Reilly 2017. Now available at the O'Reilly Store, on Amazon (in Paperback and Kindle) and on O'Reilly Safari. Also available anywhere technical books are sold!
NOTE: THE BOOK'S CODE IS OLD, BUT THE CODE IS MAINTAINED. USE DOCKER COMPOSE AND THE NOTEBOOKS IM THIS REPOSITORY.
You should refer to the Jupyter Notebooks in this repository rather than the book's source code, which is badly outdated and will no longer work for you.
Have problems? Please file an issue!
Deep Discovery
Like my work? Connect with me on LinkedIn!
Installation and Execution
There is now only ONE version of the install: Docker via the docker-compose.yml. It is MUCH EASIER than the old methods.
To build the agile Docker image, run this:
docker-compose build agile
To run the agile Docker image, defined by the docker-compose.yml and Dockerfile, run:
docker-compose up -d
Now visit: http://localhost:8888
Other Images
To manage the mongo image with Mongo Express, visit: http://localhost:8081
Downloading Data
Once the server comes up, download the data and you are ready to go. First open a shell in Jupyter Lab. The working directory corresponds to this folder.
Now download the data:
./download.sh
Running Examples
All scripts run from the base directory, except the web app which runs in ex. ch08/web/. Open Welcome.ipynb and get started.
Jupyter Notebooks
All notebooks assume you have run the jupyter notebook command from the project root directory Agile_Data_Code_2. If you are using a virtual machine image (Vagrant/Virtualbox or EC2), jupyter notebook is already running. See directions on port mapping to proceed.
The Data Value Pyramid
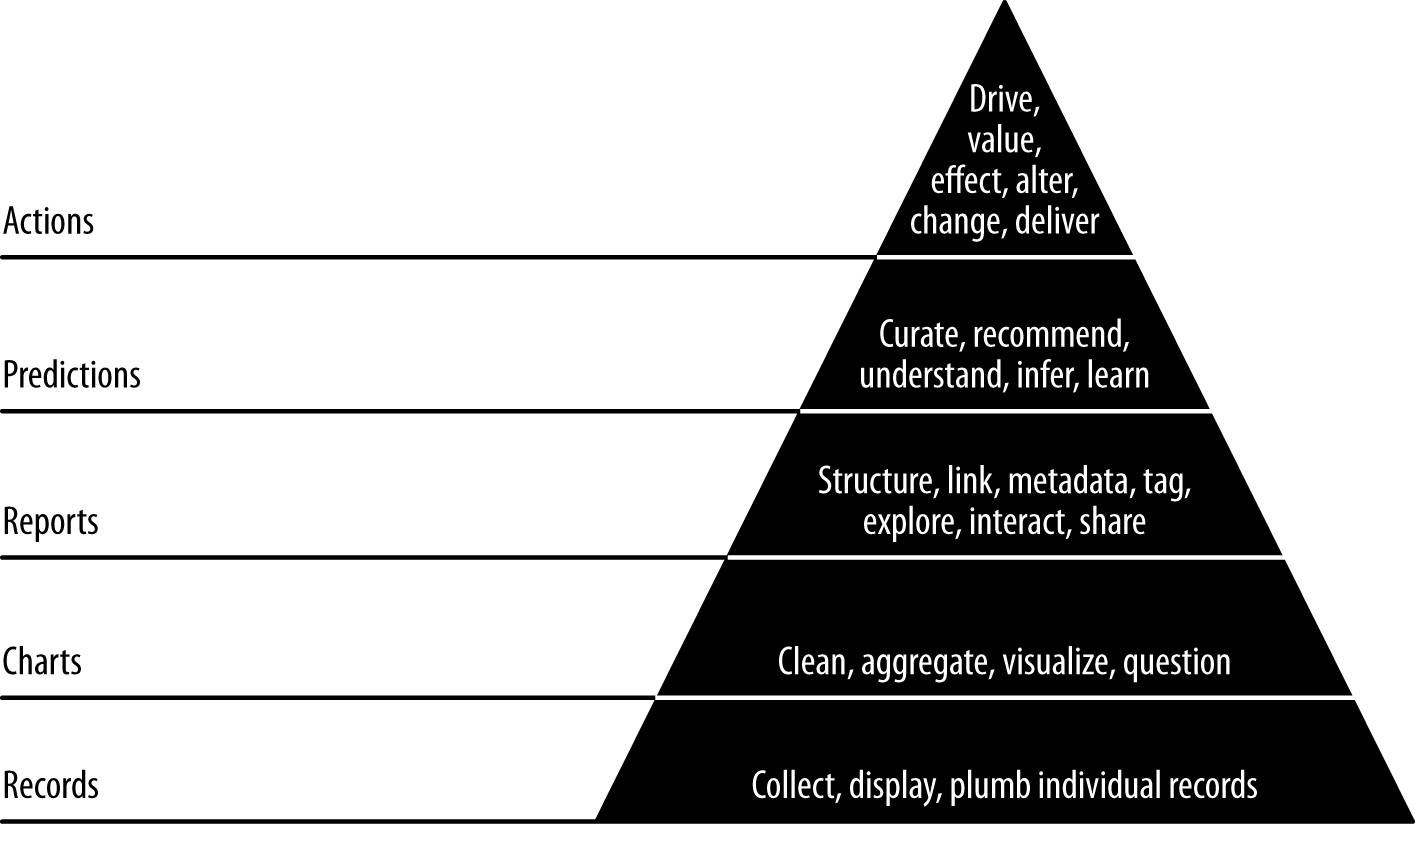
Originally by Pete Warden, the data value pyramid is how the book is organized and structured. We climb it as we go forward each chapter.
System Architecture
The following diagrams are pulled from the book, and express the basic concepts in the system architecture. The front and back end architectures work together to make a complete predictive system.
Front End Architecture
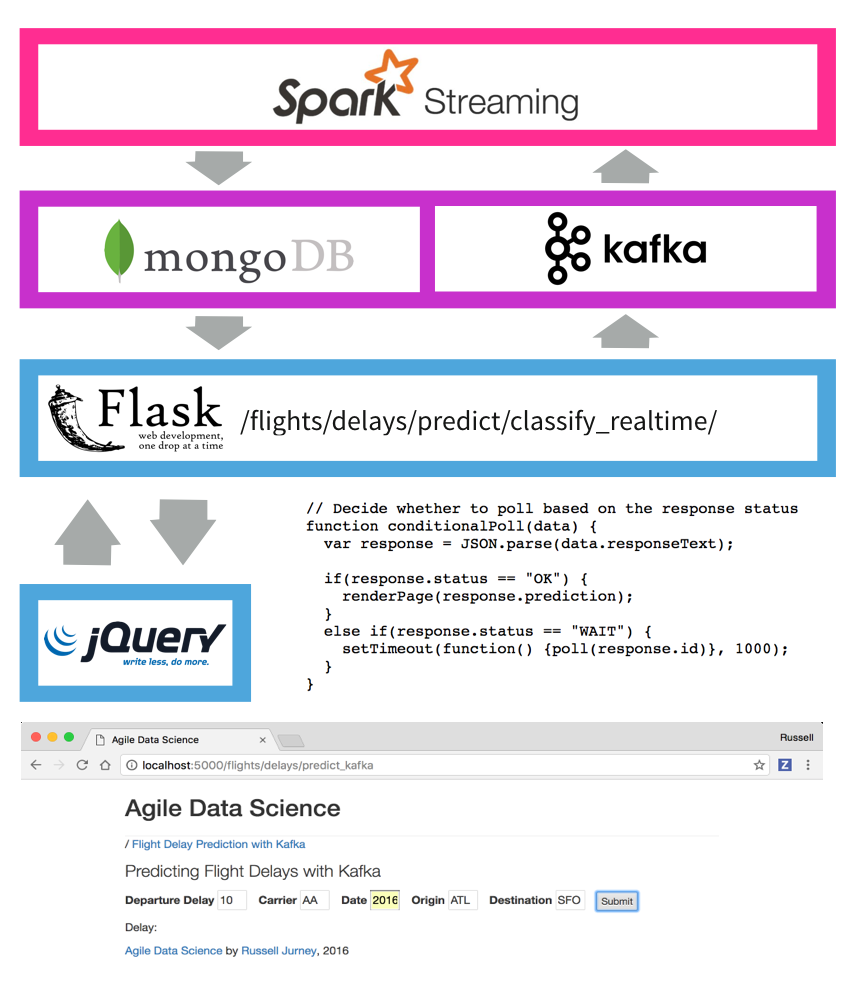
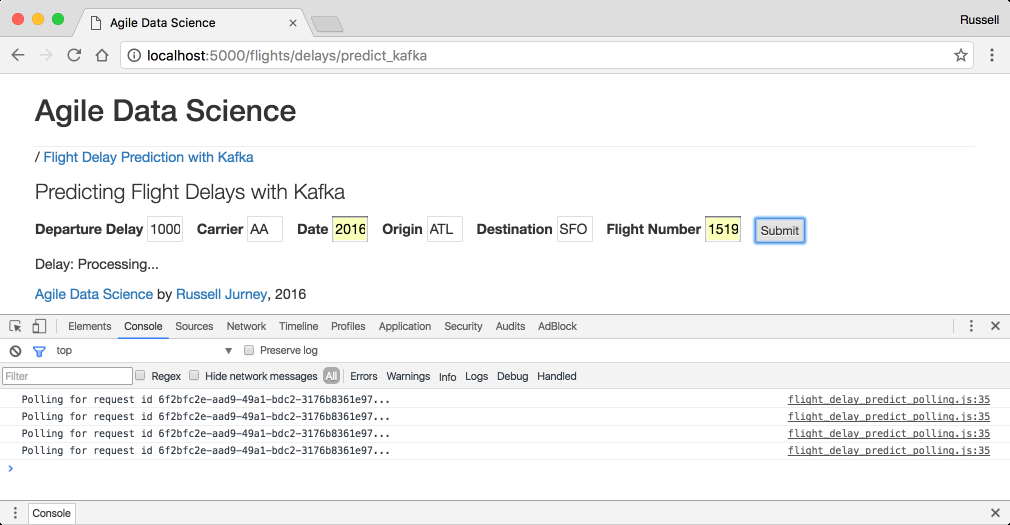
This diagram shows how the front end architecture works in our flight delay prediction application. The user fills out a form with some basic information in a form on a web page, which is submitted to the server. The server fills out some neccesary fields derived from those in the form like "day of year" and emits a Kafka message containing a prediction request. Spark Streaming is listening on a Kafka queue for these requests, and makes the prediction, storing the result in MongoDB. Meanwhile, the client has received a UUID in the form's response, and has been polling another endpoint every second. Once the data is available in Mongo, the client's next request picks it up. Finally, the client displays the result of the prediction to the user!
This setup is extremely fun to setup, operate and watch. Check out chapters 7 and 8 for more information!
Back End Architecture
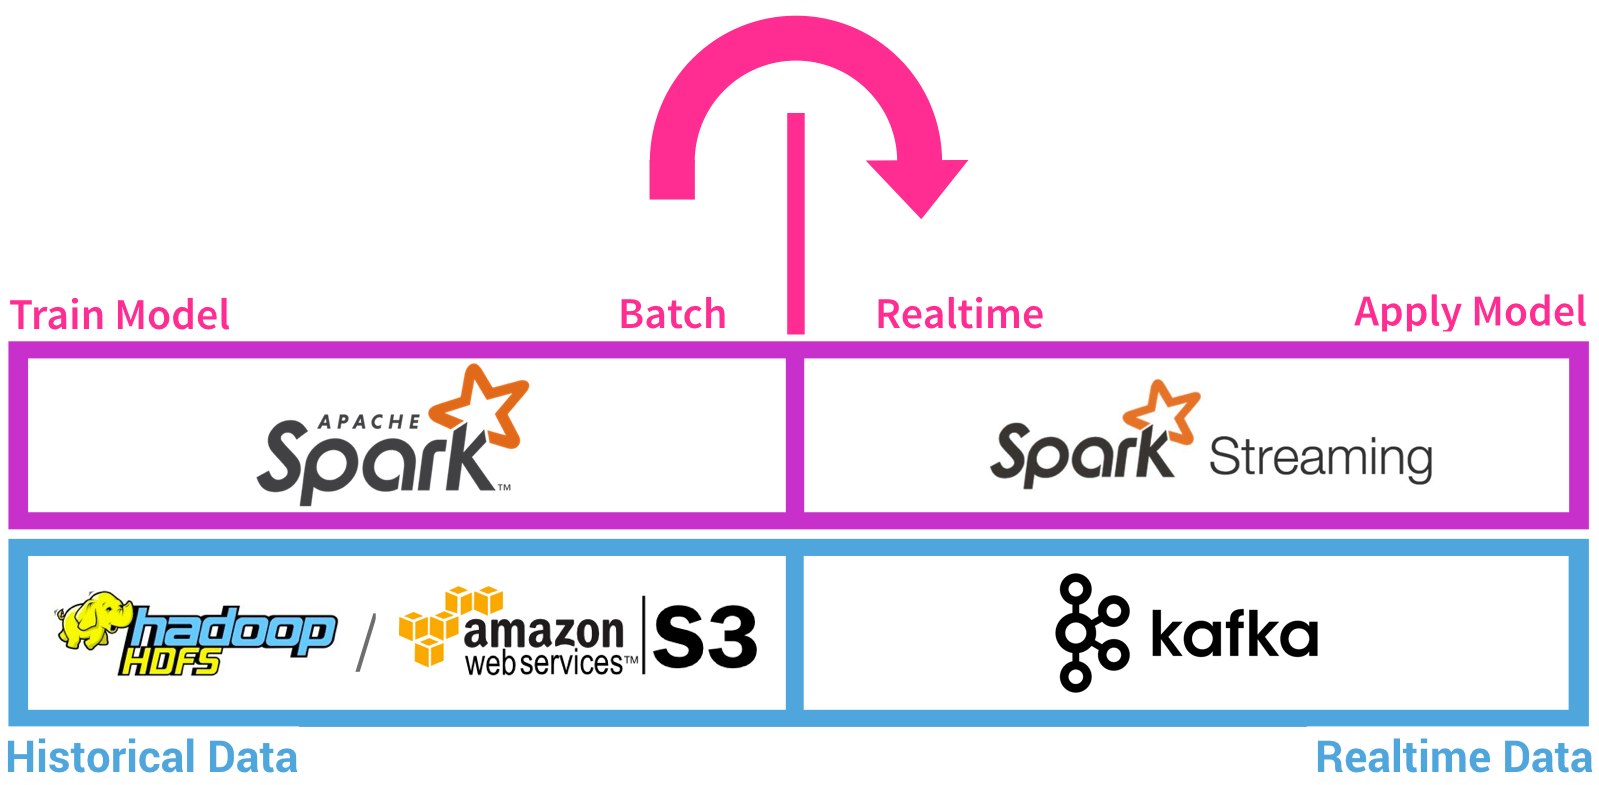
The back end architecture diagram shows how we train a classifier model using historical data (all flights from 2015) on disk (HDFS or Amazon S3, etc.) to predict flight delays in batch in Spark. We save the model to disk when it is ready. Next, we launch Zookeeper and a Kafka queue. We use Spark Streaming to load the classifier model, and then listen for prediction requests in a Kafka queue. When a prediction request arrives, Spark Streaming makes the prediction, storing the result in MongoDB where the web application can pick it up.
This architecture is extremely powerful, and it is a huge benefit that we get to use the same code in batch and in realtime with PySpark Streaming.
Screenshots
Below are some examples of parts of the application we build in this book and in this repo. Check out the book for more!
Airline Entity Page
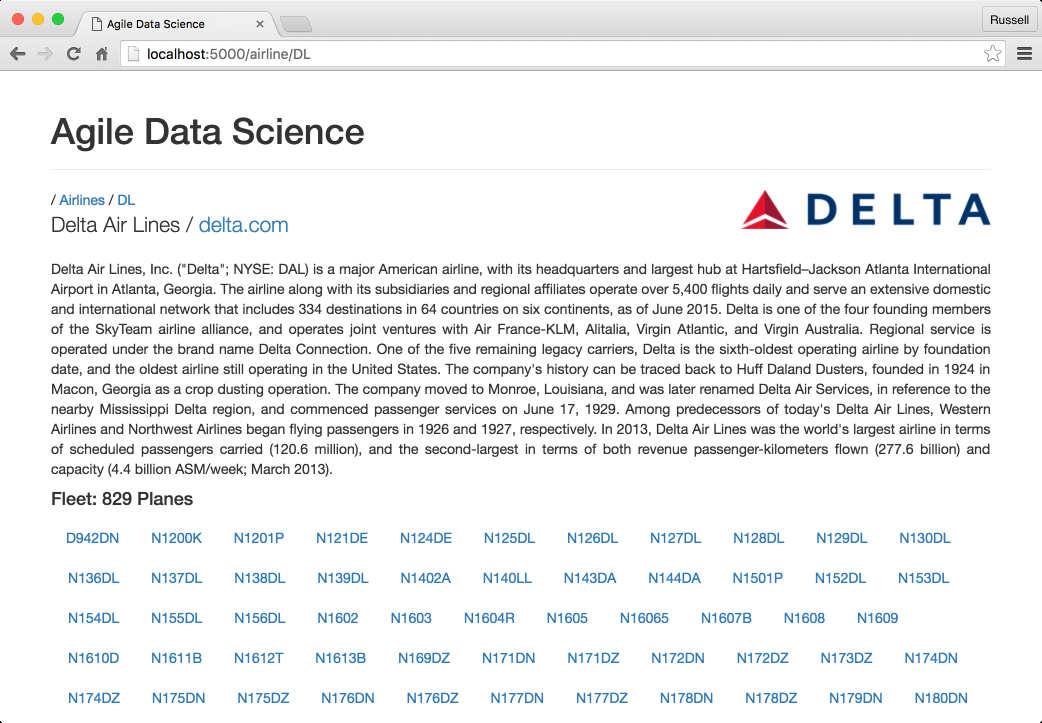
Each airline gets its own entity page, complete with a summary of its fleet and a description pulled from Wikipedia.
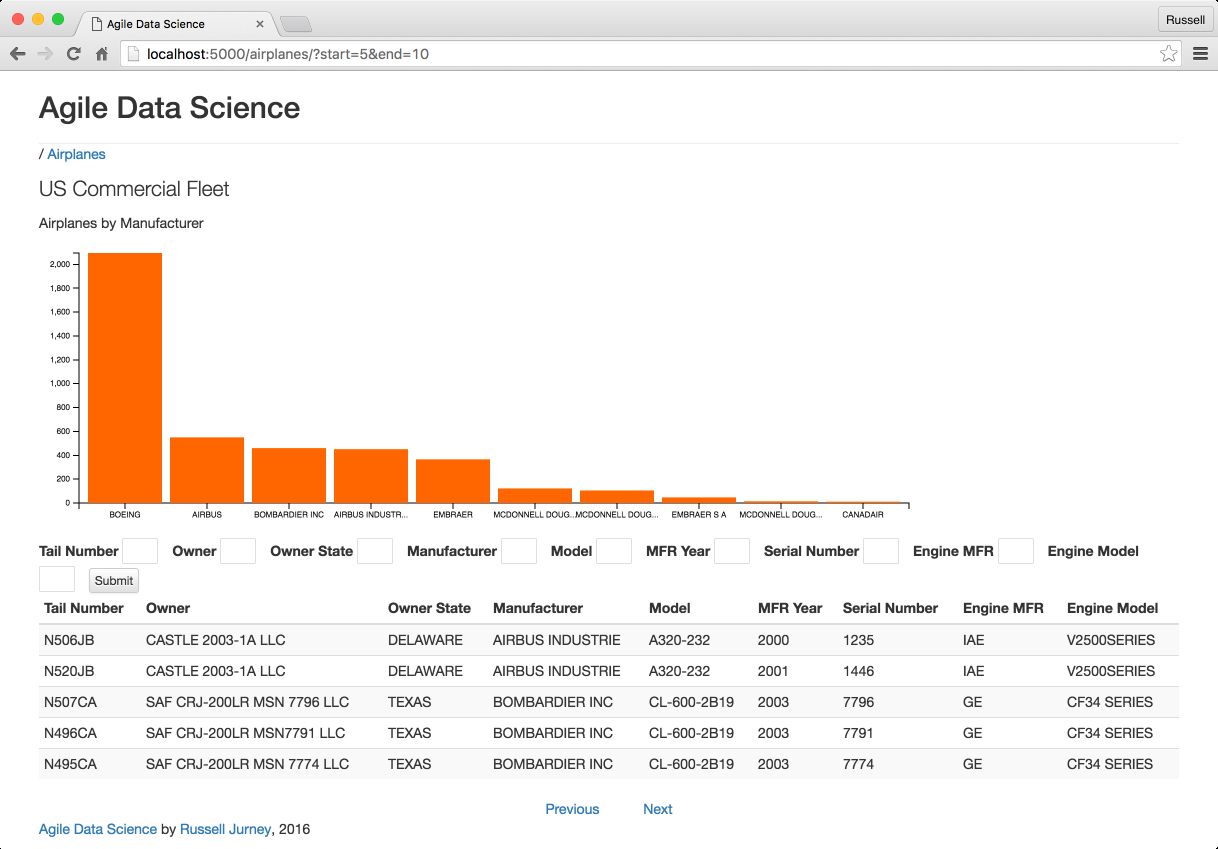
Airplane Fleet Page
We demonstrate summarizing an entity with an airplane fleet page which describes the entire fleet.
Flight Delay Prediction UI
We create an entire realtime predictive system with a web front-end to submit prediction requests.
관련 프로젝트 살펴보기
Asabeneh/30-Days-Of-Python
30 Days of Python 프로그래밍 챌린지는 Python 프로그래밍 언어를 30일 동안 배우기 위한 단계별 가이드입니다. 이 챌린지는 100일 이상 걸릴 수 있습니다. 자신의 속도에 맞춰 진행하세요. 다음 동영상도 도움이 될 수 있습니다: https://www.youtube.com/channel/UC7PNRuno1rzYPb1xLa4yktw
78,486 스타grafana/grafana
개방적이고 조합 가능한 옵저버빌리티 및 데이터 시각화 플랫폼입니다. Prometheus, Loki, Elasticsearch, InfluxDB, Postgres 등 여러 소스의 메트릭, 로그, 트레이스를 시각화합니다.
77,790 스타redis/redis
실시간 데이터 기반 애플리케이션을 구축하는 개발자에게 Redis는 가장 선호되고, 가장 빠르며, 기능이 가장 풍부한 캐시, 데이터 구조 서버이자 문서 및 벡터 쿼리 엔진입니다.
77,332 스타apache/superset
Apache Superset는 데이터 시각화 및 데이터 탐색 플랫폼입니다.
75,455 스타