프로젝트 GitHub에서 보기
bourdakos1/CapsNet-Visualization
bourdakos1/CapsNet-Visualization has 395 GitHub stars and 90 forks. GitHot measured 0 stars in 24 hours. Last checked 2026-11-19 14:26 UTC. Last push 2021-10-05.
측정된 스타 증가
- in 24h
- 0
- in 7 days
- 기록 수집 중
- in 15 days
- 기록 수집 중
- in 1 month
- 기록 수집 중
서로 겹치는 기간의 순증가량이며 일별 합계가 아닙니다. 측정값이 없으면 비워 둡니다. 스타는 관심도를 나타내며 품질을 보장하지 않습니다.
소개
🎆 A visualization of the CapsNet layers to better understand how it works
머신러닝README.md
OriginalCapsNet-Visualization
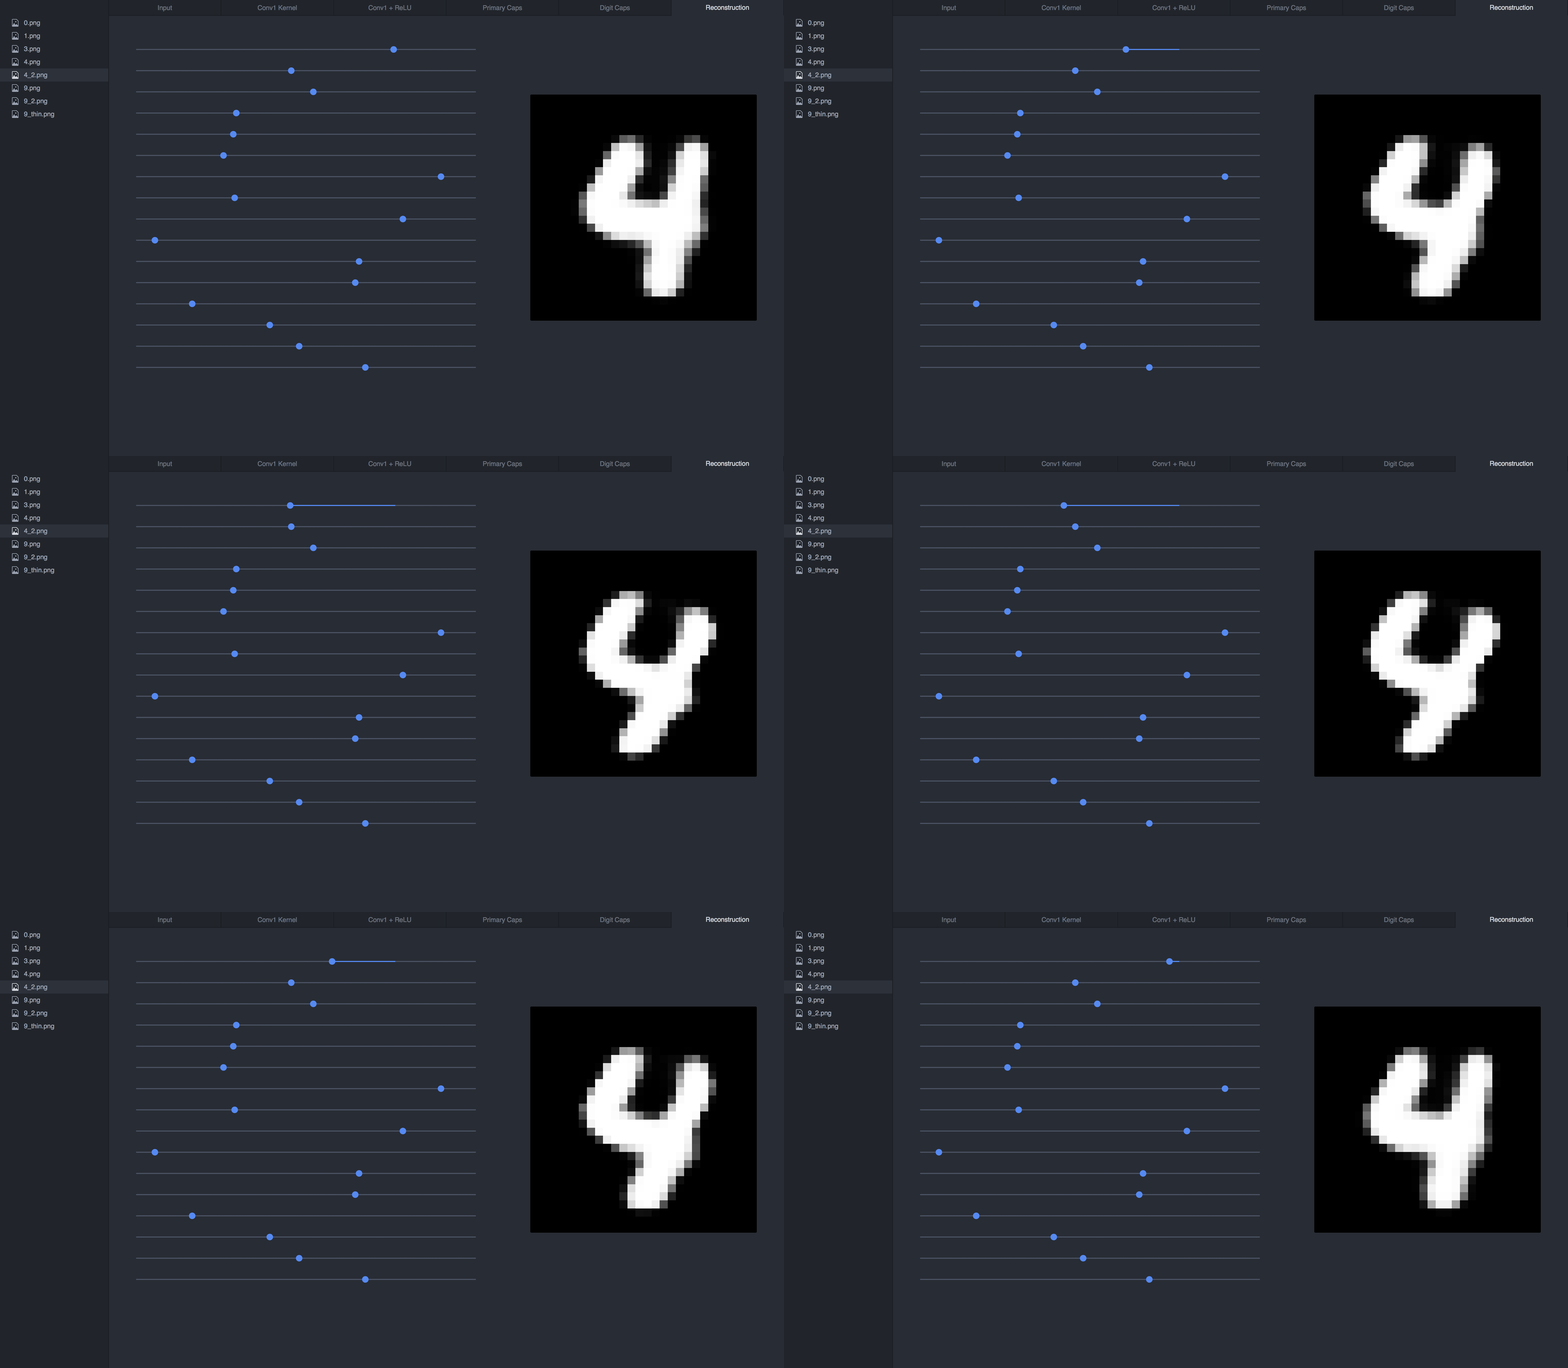
For more information on capsule networks check out my Medium articles here and here.
Setup
Use pip to install the required python packages:
pip install -r requirements.txt
Running the Tool
Start the Flask application by running:
python run_visualization.py
Point your browser to: http://localhost:5000
Testing your own Images
Add your images to the test_images directory.
Run:
python render.py [filename]