
spsanderson/healthyR
spsanderson/healthyR has 33 GitHub stars and 3 forks. GitHot measured 0 stars in 24 hours. Last checked 2026-11-13 03:38 UTC. Last push 2025-12-31.
Hospital Data Analysis Workflow Tools
可以做什么
- 📊 Time Series Analysis: Advanced tools for analyzing hospital census, length of stay (LOS), readmission rates, and other temporal metrics
- 📈 Visualization: Ready-to-use plotting functions for common healthcare analytics use cases
- 🏥 Service Line Grouping: Automated patient classification into service lines based on ICD-10 codes and DRG
- 📉 Performance Metrics: Calculate and visualize key hospital performance indicators including ALOS (Average Length of Stay), readmission rates, and LOS/Readmit indices
实测星标增长
- 24小时
- 0
- 7天
- 正在收集历史
- 15天
- 正在收集历史
- 1个月
- 正在收集历史
各周期内的星标净变化,周期相互重叠,并非每日新增。缺失的测量保持空白。星标代表关注度,不代表软件质量。
README.md
原文healthyR 


Overview
To view the full wiki, click here: Full healthyR Wiki
healthyR is a comprehensive R package designed to streamline hospital data analysis workflows. It provides a consistent, intuitive framework for analyzing common administrative and clinical data problems, helping healthcare analysts and data scientists quickly generate insights from hospital data.
Key Features
- 📊 Time Series Analysis: Advanced tools for analyzing hospital census, length of stay (LOS), readmission rates, and other temporal metrics
- 📈 Visualization: Ready-to-use plotting functions for common healthcare analytics use cases
- 🏥 Service Line Grouping: Automated patient classification into service lines based on ICD-10 codes and DRG
- 📉 Performance Metrics: Calculate and visualize key hospital performance indicators including ALOS (Average Length of Stay), readmission rates, and LOS/Readmit indices
- 🎨 Accessible Design: Color-blind friendly palettes and themes for inclusive data visualization
- 🔧 Utility Functions: Helper functions for data manipulation, Excel export, and SQL-style string operations
What Problems Does healthyR Solve?
healthyR takes the guesswork out of common hospital data analysis tasks:
- Calculate average length of stay across different time periods and patient populations
- Analyze readmission rates and identify trends
- Create service line classifications from diagnosis and procedure codes
- Generate publication-ready visualizations of hospital metrics
- Perform census and capacity planning analyses
- Identify outliers and excess utilization patterns
Installation
You can install the released version of healthyR from CRAN with:
install.packages("healthyR")
And the development version from GitHub with:
# install.packages("devtools")
devtools::install_github("spsanderson/healthyR")
Quick Start
library(healthyR)
library(dplyr)
library(timetk)

# Load your hospital data
# Analyze time series patterns with time signatures
data_with_time_features <- ts_signature_tbl(
  .data = your_data,
  .date_col = admission_date
)

# Visualize average length of stay trends
ts_alos_plt(
  .data = your_data,
  .date_col = discharge_date,
  .value_col = length_of_stay,
  .by_grouping = "month"
)

# Create service line classifications
data_with_service_line <- your_data %>%
  mutate(
    service_line = service_line_vec(
      .data = .,
      .dx_col = principal_dx,
      .px_col = principal_px,
      .drg_col = drg_number
    )
  )
Core Functionality
Time Series Analysis
healthyR provides powerful tools for temporal analysis of hospital data.
Time Signature Features
Add time-based features to your data for advanced analysis:
library(healthyR)
library(timetk)

ts_signature_tbl(.data = m4_daily, .date_col = date)
#> # A tibble: 17,578 × 31
#>    id    date       value index.num  diff  year year.iso  half quarter month
#>    <fct> <date>     <dbl>     <dbl> <dbl> <int>    <int> <int>   <int> <int>
#>  1 D410  1978-06-23 9109. 267408000    NA  1978     1978     1       2     6
#>  2 D410  1978-06-24 9103. 267494400 86400  1978     1978     1       2     6
#>  3 D410  1978-06-25 9116. 267580800 86400  1978     1978     1       2     6
#>  4 D410  1978-06-26 9116. 267667200 86400  1978     1978     1       2     6
#>  5 D410  1978-06-27 9106. 267753600 86400  1978     1978     1       2     6
#>  6 D410  1978-06-28 9094. 267840000 86400  1978     1978     1       2     6
#>  7 D410  1978-06-29 9094. 267926400 86400  1978     1978     1       2     6
#>  8 D410  1978-06-30 9084. 268012800 86400  1978     1978     1       2     6
#>  9 D410  1978-07-01 9081. 268099200 86400  1978     1978     2       3     7
#> 10 D410  1978-07-02 9047. 268185600 86400  1978     1978     2       3     7
#> # ℹ 17,568 more rows
#> # ℹ 21 more variables: month.xts <int>, month.lbl <ord>, day <int>, hour <int>,
#> #   minute <int>, second <int>, hour12 <int>, am.pm <int>, wday <int>,
#> #   wday.xts <int>, wday.lbl <ord>, mday <int>, qday <int>, yday <int>,
#> #   mweek <int>, week <int>, week.iso <int>, week2 <int>, week3 <int>,
#> #   week4 <int>, mday7 <int>
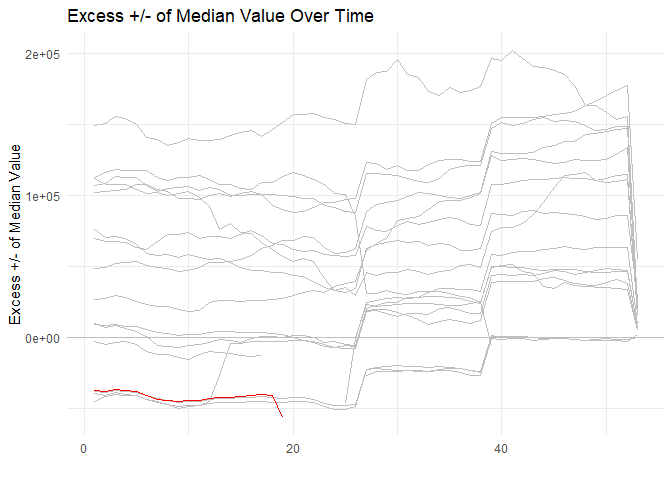
Median Excess Visualization
Identify patterns and outliers in time series data:
library(healthyR)
library(timetk)
library(dplyr)

ts_signature_tbl(.data = m4_daily, .date_col = date, .pad_time = TRUE, id) %>%
    ts_median_excess_plt(
        .date_col           = date
        , .value_col        = value
        , .x_axis           = week
        , .ggplot_group_var = year
        , .years_back       = 5
    )
Visualization Tools
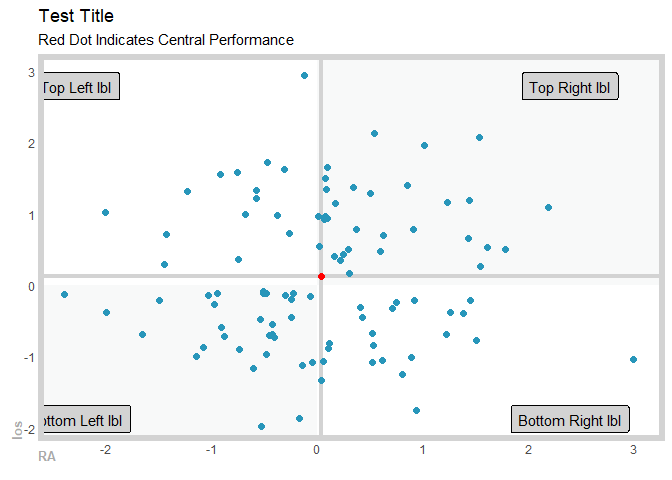
Gartner Magic Chart
Create quadrant charts for performance analysis (e.g., comparing length of stay vs readmission risk):
suppressPackageStartupMessages(library(healthyR))
suppressPackageStartupMessages(library(tibble))
suppressPackageStartupMessages(library(dplyr))

gartner_magic_chart_plt(
  .data = tibble(x = rnorm(100, 0, 1), y = rnorm(100, 0, 1))
  , .x_col = x
  , .y_col = y
  , .y_lab = "los"
  , .x_lab = "RA"
  , .plot_title = "Test Title"
  , .top_left_label = "Top Left lbl"
  , .top_right_label = "Top Right lbl"
  , .bottom_left_label = "Bottom Left lbl"
  , .bottom_right_label = "Bottom Right lbl"
)
Service Line Analysis
Automatically classify patients into service lines based on clinical codes:
# Example: Classify patients by service line
df <- data.frame(
  dx_col = "F10.10",  # ICD-10 diagnosis code
  px_col = NA,         # Procedure code (if applicable)
  drg_col = "896"      # DRG number
)

service_line_vec(
  .data = df,
  .dx_col = dx_col,
  .px_col = px_col,
  .drg_col = drg_col
)
Function Categories
📊 Time Series & Plotting Functions
ts_signature_tbl()- Add time-based features to your datats_alos_plt()- Plot average length of stay over timets_readmit_rate_plt()- Visualize readmission ratests_median_excess_plt()- Identify excess utilization patternsts_census_los_daily_tbl()- Calculate daily census and LOS metricsts_plt()- General time series plotting
📈 Performance Metrics
los_ra_index_summary_tbl()- Calculate LOS and readmission indiceslos_ra_index_plt()- Visualize performance indicesgartner_magic_chart_plt()- Create quadrant performance chartsdiverging_bar_plt()- Show positive/negative deviationsdiverging_lollipop_plt()- Lollipop charts for variance analysis
🏥 Data Transformation Functions
service_line_vec()- Classify patients into service linesservice_line_augment()- Add service line column to your datacategory_counts_tbl()- Get frequency counts by categorytop_n_tbl()- Extract top N records by criterianamed_item_list()- Create named lists for Excel export
🎨 Accessibility Features
color_blind()- Color-blind friendly palettehr_scale_fill_colorblind()- ggplot2 fill scale for accessibilityhr_scale_color_colorblind()- ggplot2 color scale for accessibility
🔧 Utility Functions
save_to_excel()- Export data to Excel with timestampopt_bin()- Calculate optimal bin size for histogramssql_left(),sql_right(),sql_mid()- SQL-style string operations
Documentation
- 📚 Function Reference - Complete documentation of all functions
- 🚀 Getting Started Vignette - Detailed introduction and tutorials
- 📰 News & Changelog - Latest updates and changes
Data Included
healthyR includes reference datasets for service line classification:
dx_cc_mapping- ICD-10 diagnosis code mappings for condition categoriespx_cc_mapping- ICD-10 procedure code mappings for procedure categories
Contributing
We welcome contributions! Please see our Contributing Guidelines for details on:
- Reporting bugs
- Suggesting new features
- Submitting pull requests
- Code of conduct
Getting Help
If you encounter issues or have questions:
- Check the function documentation
- Review the Getting Started vignette
- Search existing issues
- Open a new issue with a reproducible example
Citation
If you use healthyR in your research or publications, please cite it:
citation("healthyR")
License
MIT © Steven P. Sanderson II, MPH
Author
Steven P. Sanderson II, MPH - Website: https://www.spsanderson.com - GitHub: @spsanderson - ORCID: 0009-0006-7661-8247
探索相关项目
Asabeneh/30-Days-Of-Python
30 Days of Python 编程挑战是一份循序渐进的指南,用于在 30 天内学习 Python 编程语言。这项挑战可能需要超过 100 天。请按自己的节奏进行。这些视频或许也有帮助:https://www.youtube.com/channel/UC7PNRuno1rzYPb1xLa4yktw
78,618 星标grafana/grafana
开放且可组合的可观测性与数据可视化平台。可对来自 Prometheus、Loki、Elasticsearch、InfluxDB、Postgres 等众多数据源的指标、日志和追踪进行可视化。
77,859 星标redis/redis
对于正在构建实时数据驱动应用的开发者而言,Redis 是首选、速度最快且功能最丰富的缓存、数据结构服务器和文档与向量查询引擎。
77,472 星标apache/superset
Apache Superset 是一个数据可视化与数据探索平台
75,495 星标