
spotify/chartify
spotify/chartify has 3,655 GitHub stars and 336 forks. GitHot measured 0 stars in 24 hours and -3 in 7 days. Last checked 2026-11-12 11:28 UTC. Last push 2024-10-16.
Python library that makes it easy for data scientists to create charts.
可以做什么
- Consistent input data format: Spend less time transforming data to get your charts to work. All plotting functions use a consistent tidy input data format.
- Smart default styles: Create pretty charts with very little customization required.
- Simple API: We've attempted to make the API as intuitive and easy to learn as possible.
- Flexibility: Chartify is built on top of Bokeh, so if you do need more control you can always fall back on Bokeh's API.
实测星标增长
- 24小时
- 0
- 7天
- -3
- 15天
- 正在收集历史
- 1个月
- 正在收集历史
各周期内的星标净变化,周期相互重叠,并非每日新增。缺失的测量保持空白。星标代表关注度,不代表软件质量。
README.md
原文Chartify


Chartify is a Python library that makes it easy for data scientists to create charts.
Why use Chartify?
- Consistent input data format: Spend less time transforming data to get your charts to work. All plotting functions use a consistent tidy input data format.
- Smart default styles: Create pretty charts with very little customization required.
- Simple API: We've attempted to make the API as intuitive and easy to learn as possible.
- Flexibility: Chartify is built on top of Bokeh, so if you do need more control you can always fall back on Bokeh's API.
Examples
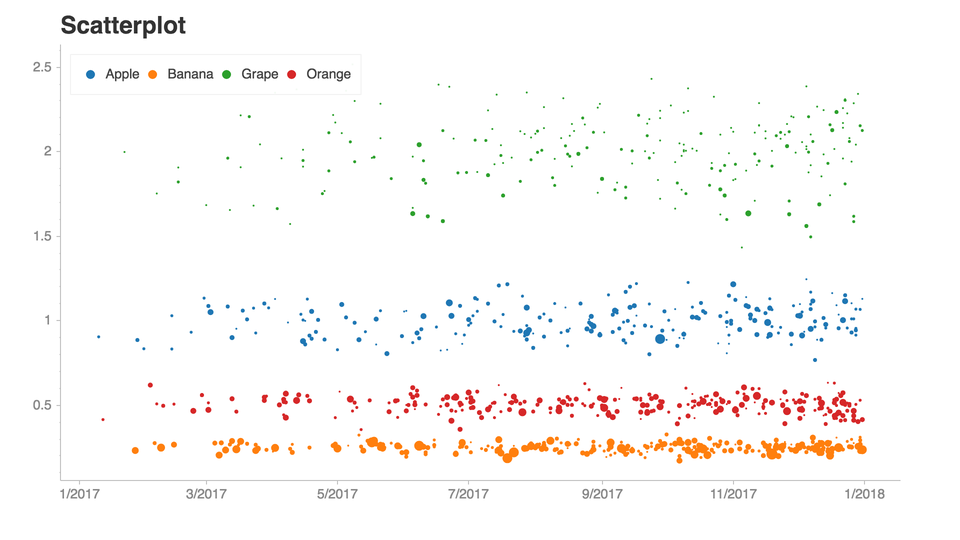
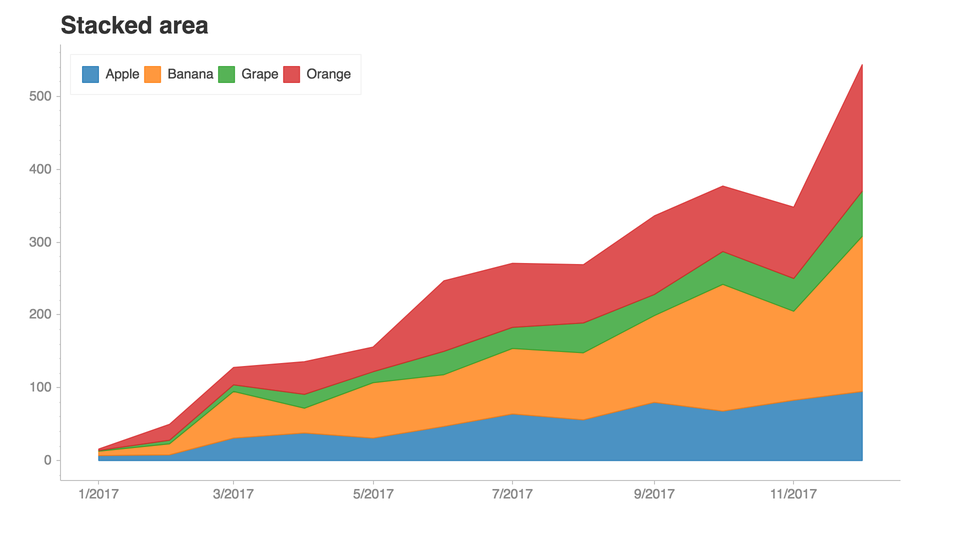
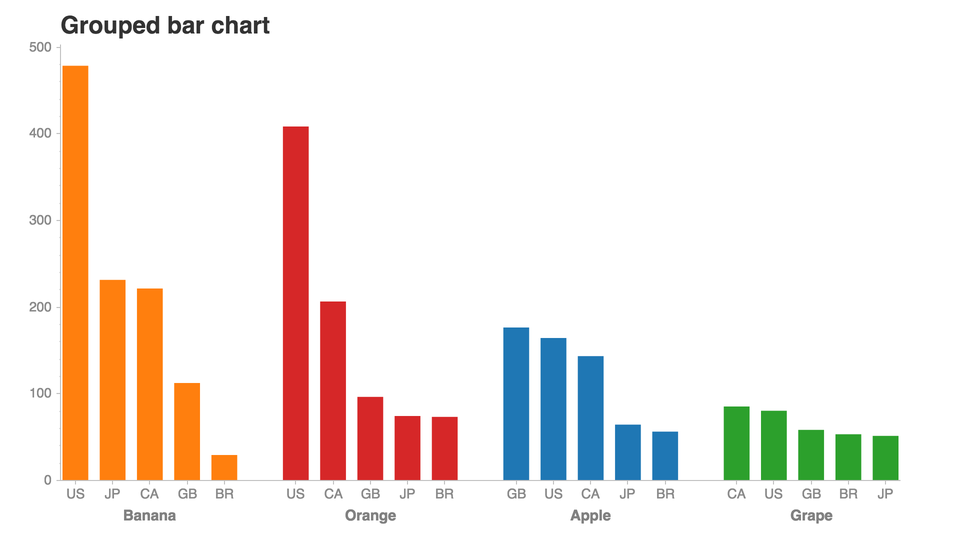
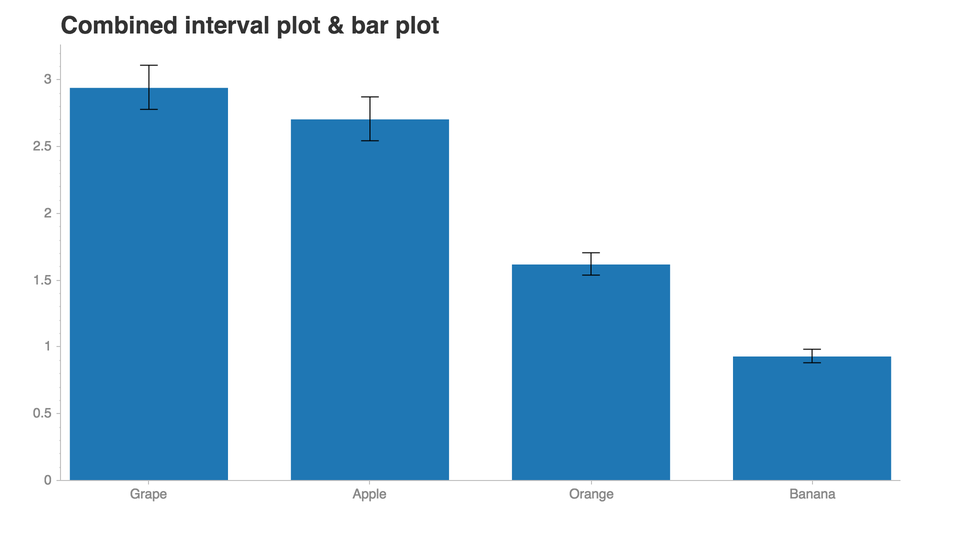
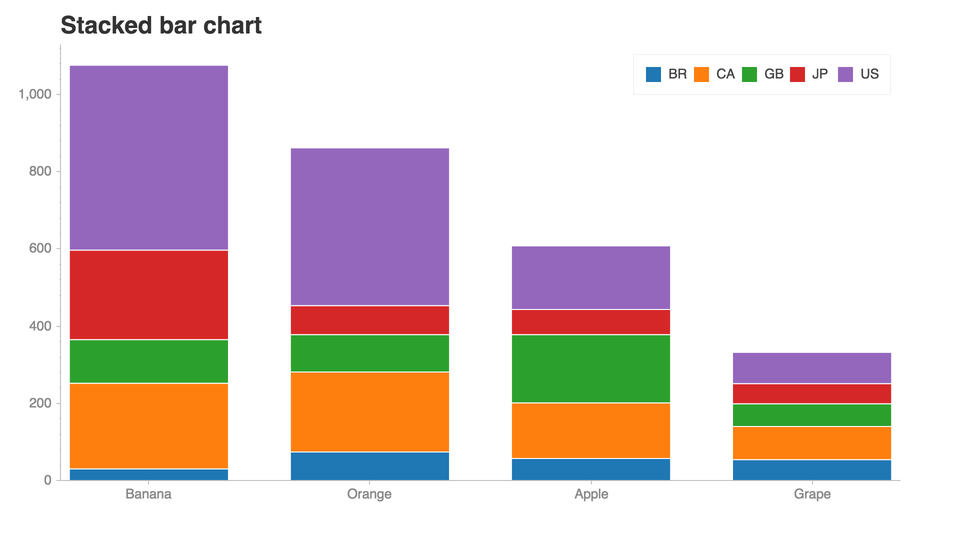
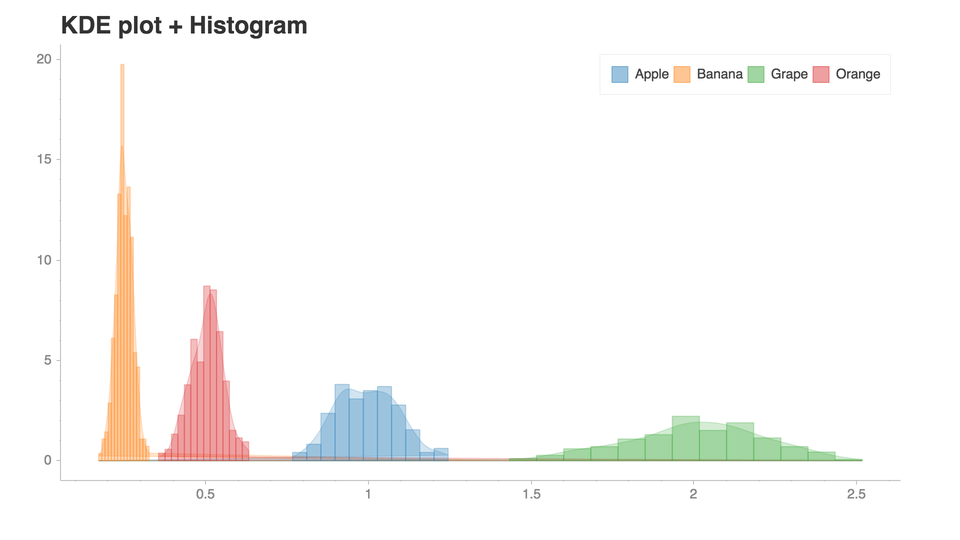
See this notebook for more examples!.
Installation
- Chartify can be installed via pip:
pip3 install chartify
- Install chromedriver requirement (Optional. Needed for PNG output):
- Install google chrome.
- Download the appropriate version of chromedriver for your OS here.
- Copy the executable file to a directory within your PATH.
- View directorys in your PATH variable:
echo $PATH - Copy chromedriver to the appropriate directory, e.g.:
cp chromedriver /usr/local/bin
Getting started
This tutorial notebook is the best place to get started with a guided tour of the core concepts of Chartify.
From there, check out the example notebook for a list of all the available plots.
Docs
Documentation available on chartify.readthedocs.io.
Getting support
Use the chartify tag on StackOverflow.
Code of Conduct
This project adheres to the Open Code of Conduct. By participating, you are expected to honor this code.
Contributing
探索相关项目
Asabeneh/30-Days-Of-Python
30 Days of Python 编程挑战是一份循序渐进的指南,用于在 30 天内学习 Python 编程语言。这项挑战可能需要超过 100 天。请按自己的节奏进行。这些视频或许也有帮助:https://www.youtube.com/channel/UC7PNRuno1rzYPb1xLa4yktw
78,618 星标grafana/grafana
开放且可组合的可观测性与数据可视化平台。可对来自 Prometheus、Loki、Elasticsearch、InfluxDB、Postgres 等众多数据源的指标、日志和追踪进行可视化。
77,859 星标redis/redis
对于正在构建实时数据驱动应用的开发者而言,Redis 是首选、速度最快且功能最丰富的缓存、数据结构服务器和文档与向量查询引擎。
77,472 星标apache/superset
Apache Superset 是一个数据可视化与数据探索平台
75,495 星标