
slanatech/dashblocks
slanatech/dashblocks has 100 GitHub stars and 21 forks. GitHot measured 0 stars in 24 hours. Last checked 2026-11-15 11:29 UTC. Last push 2023-06-01.
实测星标增长
- 24小时
- 0
- 7天
- 正在收集历史
- 15天
- 正在收集历史
- 1个月
- 正在收集历史
各周期内的星标净变化,周期相互重叠,并非每日新增。缺失的测量保持空白。星标代表关注度,不代表软件质量。
关于
Enable Analytics in your Apps
数据README.md
原文

dashblocks
https://dashblocks.io | GUIDE | DEMO
Enable Analytics in your Apps


Note: under active development
Declarative Interactive Dashboards
Dashblocks enables easily creating sophisticated interactive dashboards simply by declaring dashboard structure as json or javascript object.
Dashblocks uses popular charting libraries to render chars: d3, Chart.js, Dygraphs, Plotly.js
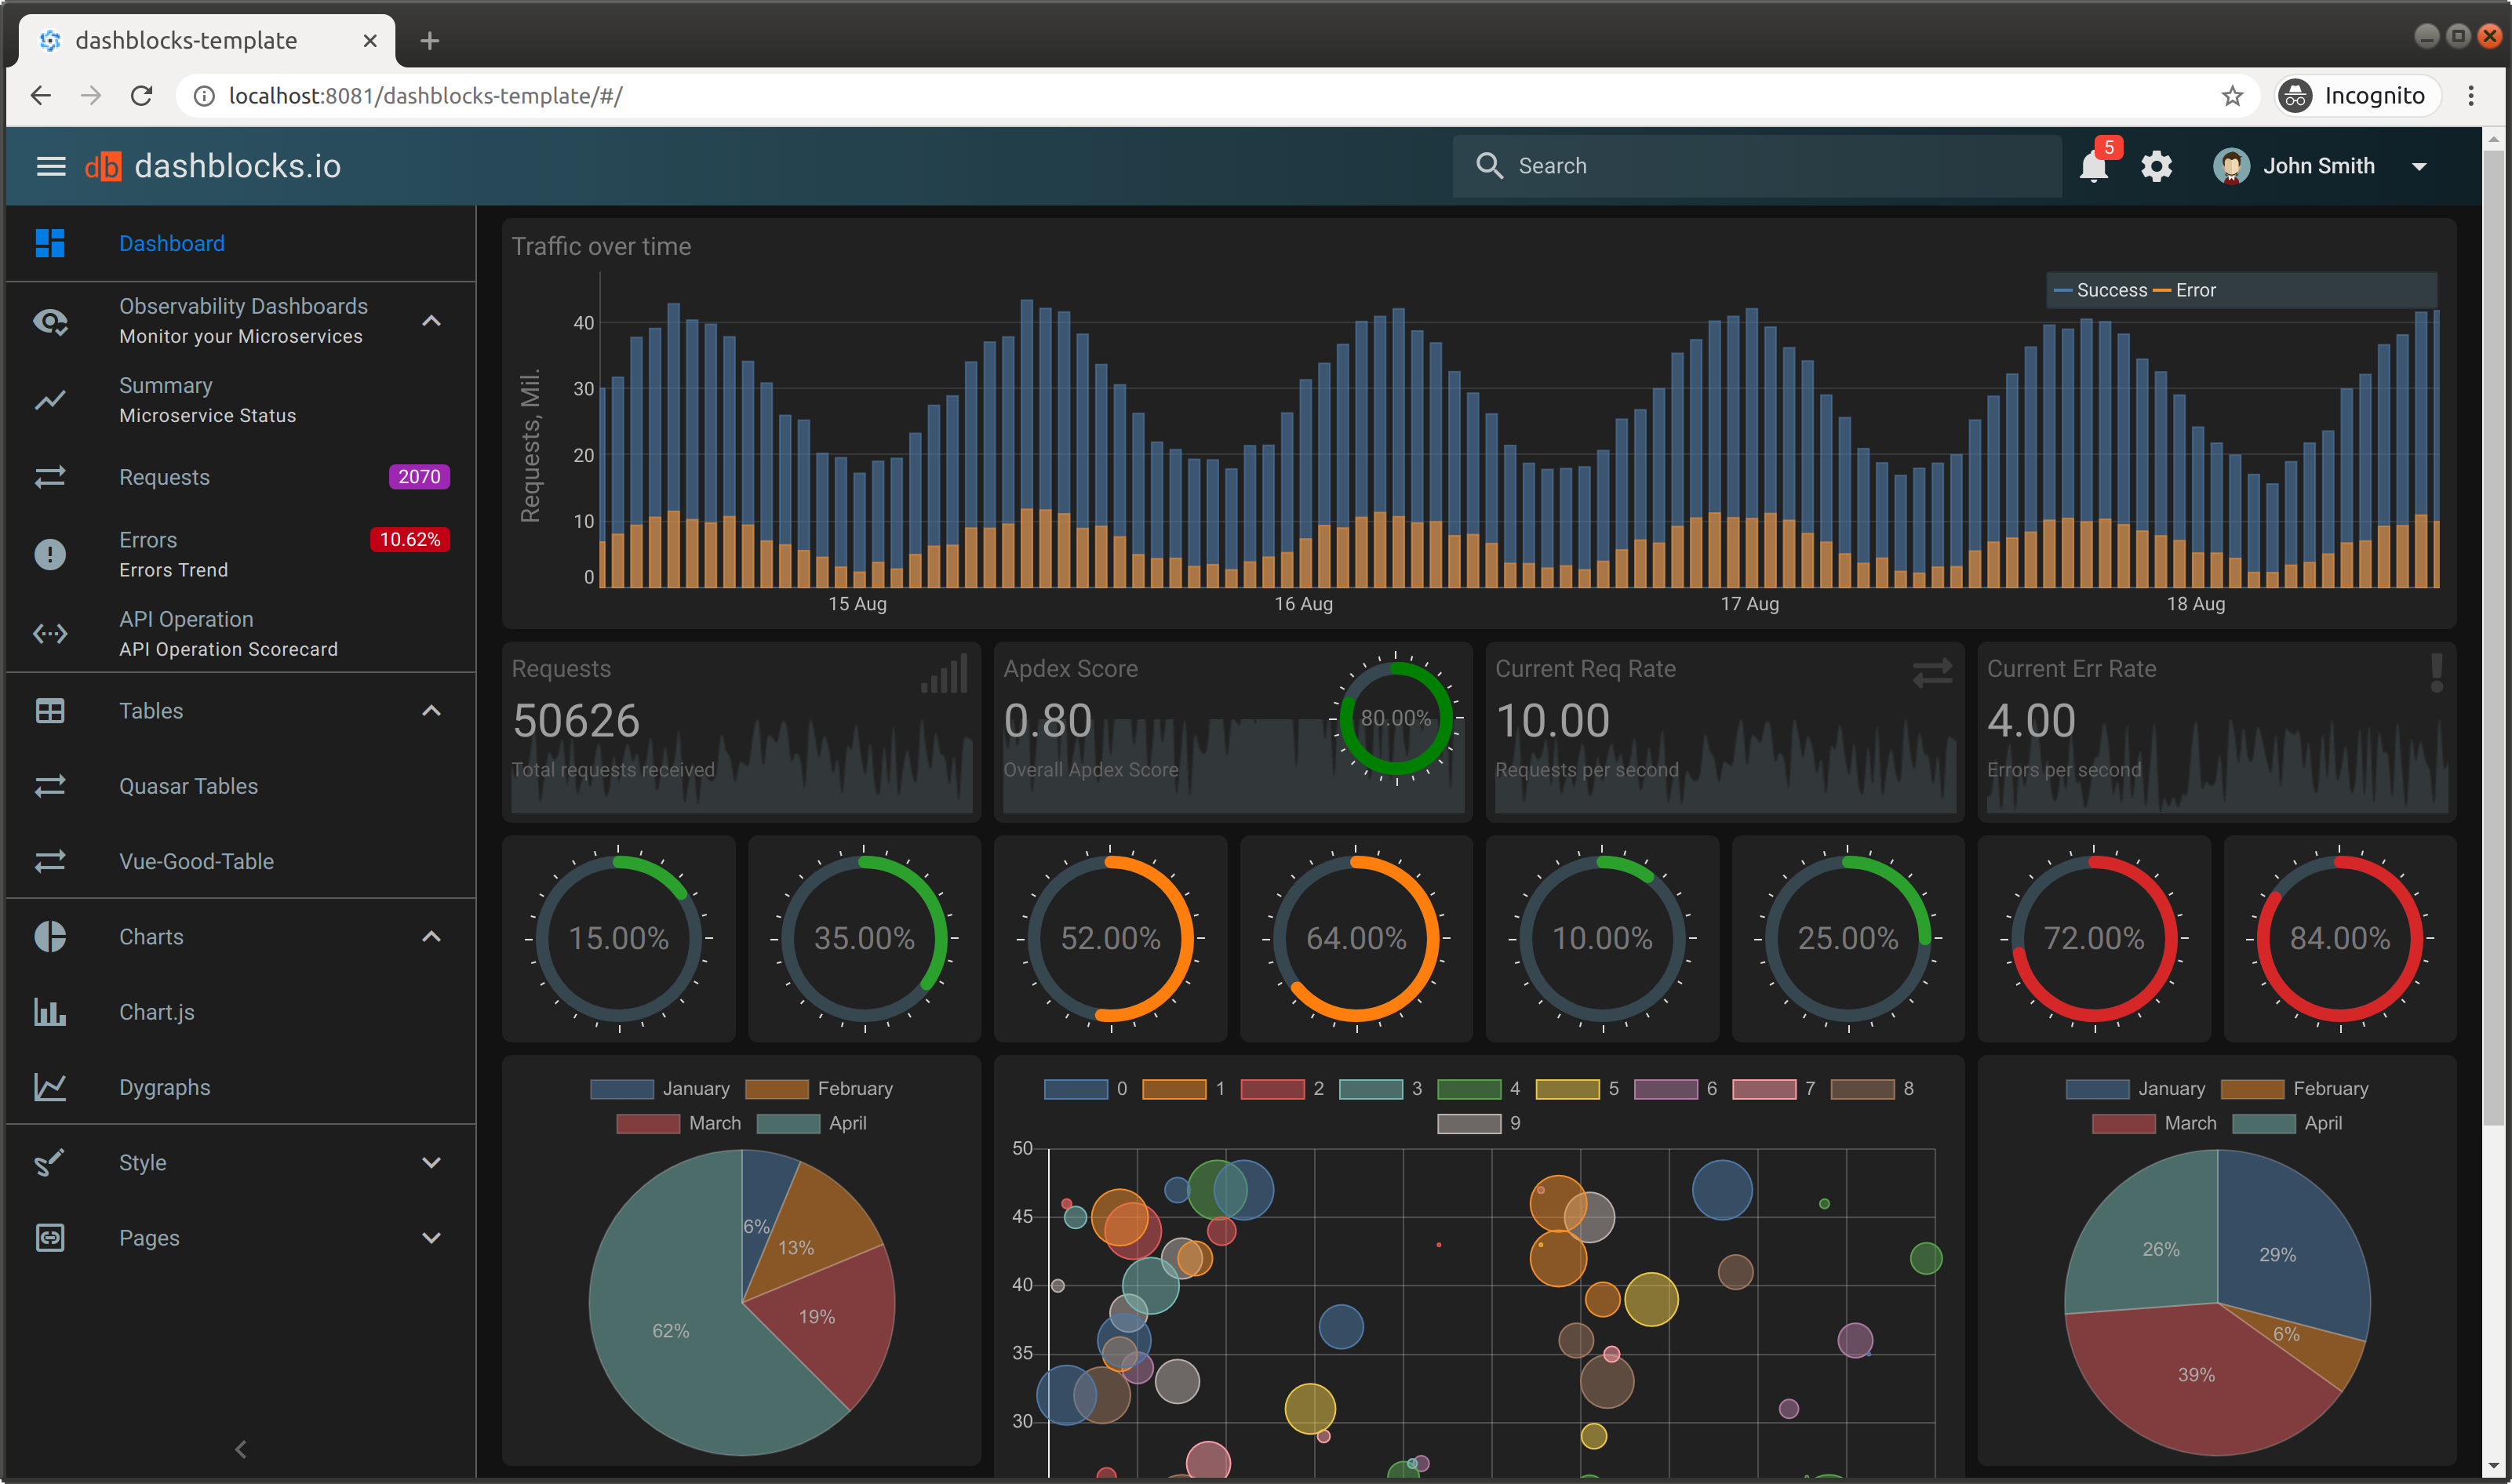
Dashblocks aims to simplify enabling robust In-App Analytics:
- Use declarative approach to define dashboard layout
- Provide reasonable out of the box defaults for all chart types, such as colors
- Support dark / light modes out of the box
- Enable interactivity by providing event handling on dashboard level
- Streamline dynamic updates of dashboard data, for example based on user interaction with dashboard
- Even dynamically generate Dashboard itself based on the data - thanks to declarative approach
Dashblocks Template
https://github.com/slanatech/dashblocks-template
Dashblocks Vue Material Admin Template is build based on Quasar Framework, Vuex, Vuejs and Dashblocks.
We focus on providing beautiful interactive Dashboards out of the box, and helping to enable In-App Analytics in your Apps.
Installation
npm install dashblocks --save
Usage
Create Dashboard in your Vue app as a Vue Component. In Dashboard component you define:
- Dashboard Layout - add widgets to your dashboard, specifying how many columns and rows each widget takes. Dashblocks provides 16-columns CSS Grid layout. Pass additional options to widgets to adjust appearance as needed.
- Set Data for each widget on a dashboard
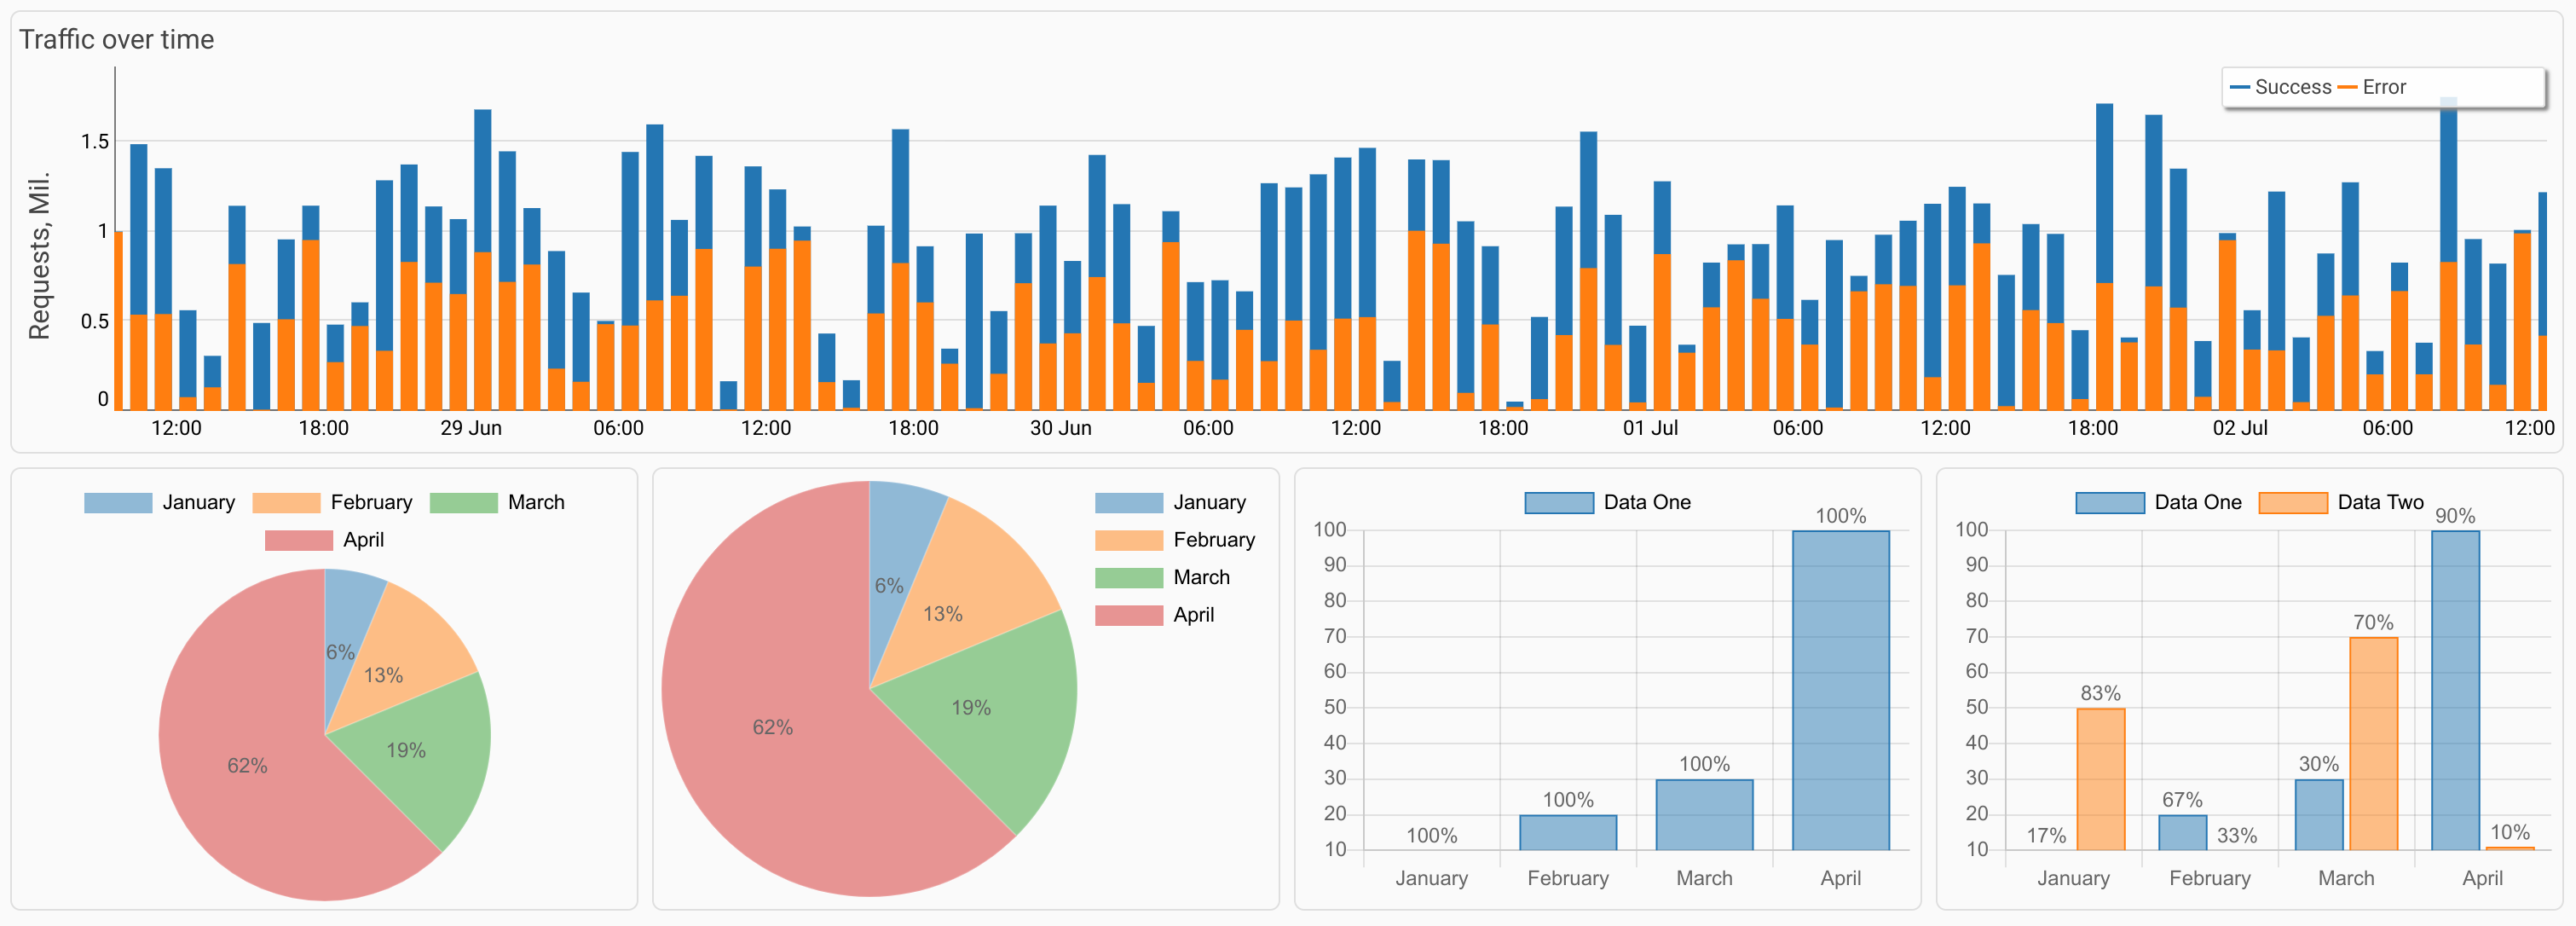
Here is an example dashboard:
<template>
  <db-dashboard v-if="ready" :dbspec="dbspec" :dbdata="dbdata" :dark="isDark"> </db-dashboard>
</template>

<script>
import { DbData, DbDashboard } from 'dashblocks';

export default {
  name: 'SampleDashboard',
  components: {
    DbDashboard
  },
  data() {
    return {
      isDark: false,
      dbdata: new DbData(),
      // Declare Dashboard Layout. Add widgets to your dashboard, specifying how many columns and rows
      // each widget takes. Dashblocks provides 16-columns CSS Grid layout.
      // Pass additional options to widgets to adjust appearance as needed.
      dbspec: {
        layout: {
          type: 'grid'
        },
        widgets: [
          {
            id: 'w1',
            type: 'DbDygraphsBar',
            cspan: 16,
            height: 250,
            properties: {
              options: {
                stackedGraph: true,
                title: 'Traffic over time',
                ylabel: 'Requests, Mil.',
                labels: ['Date', 'Success', 'Error'],
                legend: 'always'
              }
            }
          },
          {
            id: 'w2',
            type: 'DbChartjsPie',
            cspan: 4,
            height: 250
          },
          {
            id: 'w3',
            type: 'DbChartjsPie',
            cspan: 4,
            properties: {
              options: {
                legend: {
                  position: 'right'
                }
              }
            }
          },
          {
            id: 'w4',
            type: 'DbChartjsBar',
            cspan: 4
          },
          {
            id: 'w5',
            type: 'DbChartjsBar',
            cspan: 4
          }
        ]
      },
      ready: false
    };
  },
  mounted() {
    this.initialize();
    this.ready = true;
  },
  methods: {
    initialize: function() {
      // Initialize dashboard data - set data for each dashboard widget
      // This is obviously a sample that generates random data
      // In real dashboards you would get data from database, backend APIs, vuex, etc
      let dthData = [];
      let sTS = Date.now() - 100 * 3600 * 1000;
      for (let i = 0; i < 100; i++) {
        dthData.push([new Date(sTS + i * 3600 * 1000), Math.random(), Math.random()]);
      }

      this.dbdata.setWData('w1', {
        data: dthData
      });

      let dataOneSeries = {
        labels: ['January', 'February', 'March', 'April'],
        datasets: [
          {
            label: 'Data One',
            data: [10, 20, 30, 100]
          }
        ]
      };

      let dataTwoSeries = {
        labels: ['January', 'February', 'March', 'April'],
        datasets: [
          {
            label: 'Data One',
            data: [10, 20, 30, 100]
          },
          {
            label: 'Data Two',
            data: [50, 10, 70, 11]
          }
        ]
      };

      this.dbdata.setWData('w2', {
        data: JSON.parse(JSON.stringify(dataOneSeries))
      });

      this.dbdata.setWData('w3', {
        data: JSON.parse(JSON.stringify(dataOneSeries))
      });

      this.dbdata.setWData('w4', {
        data: JSON.parse(JSON.stringify(dataOneSeries))
      });
      this.dbdata.setWData('w5', {
        data: JSON.parse(JSON.stringify(dataTwoSeries))
      });
    }
  }
};
</script>
https://github.com/slanatech/dashblocks-template/blob/master/src/views/SampleDashboard.vue
And here is what you get:
More samples:
- dashblock-template - Dashblocks template app
- dashblocks demo app
Roadmap
Roadmap and plans are roughly defined in TODO