
nafey/minimalytics
nafey/minimalytics has 351 GitHub stars and 12 forks. GitHot measured +1 stars in 24 hours. Last checked 2026-11-10 22:18 UTC. Last push 2026-01-03.
Standalone analytics app in a CLI
可以做什么
- Track Events: Record and monitor analytics for various events.
- Web UI: Manage dashboards and visualize event data with interactive graphs.
- Scalable: Supports over a billion events per month with a minimal storage footprint (~20 MB).
- Lightweight: Built with efficiency in mind, ensuring low memory and storage usage.
实测星标增长
- 24小时
- +1
- 7天
- 更新延迟
- 15天
- 更新延迟
- 1个月
- 更新延迟
各周期内的星标净变化,周期相互重叠,并非每日新增。缺失的测量保持空白。星标代表关注度,不代表软件质量。
README.md
原文Minimalytics

Minimalytics is a standalone minimalist analytics tool built on SQLite. Designed for resource-constrained environments, it provides a lightweight solution for tracking and visualizing event data with a minimal footprint. Whether you're tracking internal services or need a simple analytics tool, Minimalytics delivers performance without the bloat.
Features
- Track Events: Record and monitor analytics for various events.
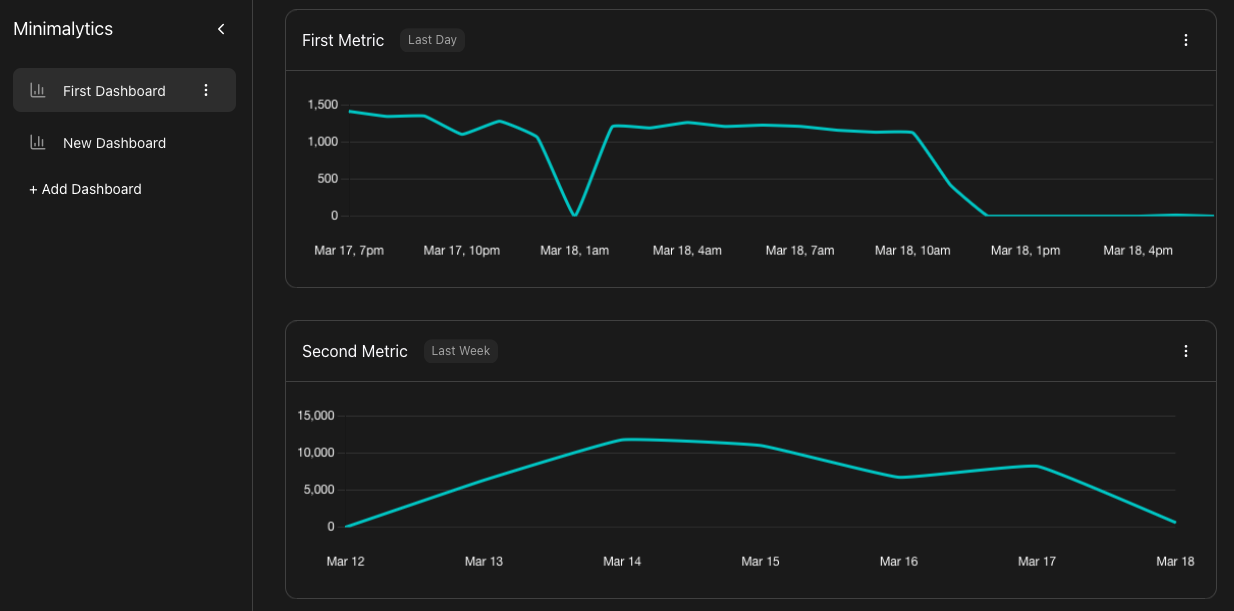
- Web UI: Manage dashboards and visualize event data with interactive graphs.
- Scalable: Supports over a billion events per month with a minimal storage footprint (~20 MB).
- Lightweight: Built with efficiency in mind, ensuring low memory and storage usage.
Installation
Linux and macOS
Clone the repository:
git clone https://github.com/nafey/minimalytics.git
cd minimalytics
Build the project:
go build -o build/minim .Install the binary system-wide:
sudo mv build/minim /usr/local/bin/
Docker
Build the image:
docker build -t minimalytics .Run the container:
docker run -p 3333:3333 -v minim-data:/root/.minim minimalyticsThe volume mount persists the SQLite database across container restarts.
Usage
Starting the Server
Check if the server is running:
minim statusStart the server:
minim server start
Recording Events
To record an event, send a POST request to the event API:
curl -X POST http://localhost:3333/api/event/ -H "Content-Type: application/json" -d '{"event": "<EVENT_NAME>"}'
Replace <EVENT_NAME> with the name of the event you want to track.
Accessing the Web Dashboard
Open your browser and navigate to:
http://localhost:3333/Go to "First Dashboard" and click "Add Graph".
Select the appropriate properties and click "Done".
Your dashboard is now ready to display event data.
Disabling Web Access
To disable access to the web dashboard, run:
minim web disable
Why Minimalytics?
This project was born out of the need for a lightweight analytics tool to track internal services on a resource-constrained VPS. Most SaaS analytics products either lack the scalability or exceed their free tier limits when tracking millions of events per month. Minimalytics addresses this gap by offering a minimalist, high-performance solution for resource-constrained environments.
How It Works
- Event Aggregation: Minimalytics saves space by aggregating events, storing only aggregate features (e.g., total invocations per day) instead of individual events.
- SQLite Storage: Event data is stored in an SQLite file, initialized during the first run of
minim. - Server Hosting: The
minimCLI starts a server that:- Hosts the API endpoint for event submission.
- Serves the web UI (built using minimui and placed in the
staticfolder).
- Web UI: Source for the Web UI is available at minimui.
Future Features
- Support for sum, avg, min, and max on event values.
- Improved UI/UX.
- Multiple metrics in the same graph.
- Additional visualizations: Bar Chart, Pie Chart, etc.
- User ID-based analytics: Funnels, cohorts, and more.
Unsupported Features
- Details on individual events.
- Hourly event resolution beyond 48 hours.
- Minute resolution beyond 60 minutes.
Contributing
Contributions are welcome! If you'd like to contribute, please:
- Fork the repository.
- Create a new branch for your feature or bugfix.
- Submit a pull request.
License
Minimalytics is licensed under the MIT License.
Enjoy using Minimalytics! For questions or feedback, feel free to open an issue on GitHub.
探索相关项目
Asabeneh/30-Days-Of-Python
30 Days of Python 编程挑战是一份循序渐进的指南,用于在 30 天内学习 Python 编程语言。这项挑战可能需要超过 100 天。请按自己的节奏进行。这些视频或许也有帮助:https://www.youtube.com/channel/UC7PNRuno1rzYPb1xLa4yktw
78,560 星标grafana/grafana
开放且可组合的可观测性与数据可视化平台。可对来自 Prometheus、Loki、Elasticsearch、InfluxDB、Postgres 等众多数据源的指标、日志和追踪进行可视化。
77,830 星标redis/redis
对于正在构建实时数据驱动应用的开发者而言,Redis 是首选、速度最快且功能最丰富的缓存、数据结构服务器和文档与向量查询引擎。
77,395 星标apache/superset
Apache Superset 是一个数据可视化与数据探索平台
75,473 星标