
lanpa/tensorboardX
lanpa/tensorboardX has 8,001 GitHub stars and 848 forks. GitHot measured 0 stars in 24 hours, 0 in 7 days, and 0 in 15 days. Last checked 2026-11-20 00:11 UTC. Last push 2026-07-14.
实测星标增长
- 24小时
- 0
- 7天
- 0
- 15天
- 0
- 1个月
- 正在收集历史
各周期内的星标净变化,周期相互重叠,并非每日新增。缺失的测量保持空白。星标代表关注度,不代表软件质量。
关于
tensorboard for pytorch (and chainer, mxnet, numpy, ...)
机器学习README.md
原文tensorboardX


Write TensorBoard events with simple function call.
The current release (v2.6.5) is tested with PyTorch 2.6 / torchvision 0.21.0 / tensorboard 2.19.0 on Python 3.10 to 3.13
Support
scalar,image,figure,histogram,audio,text,graph,onnx_graph,embedding,pr_curve,mesh,hyper-parametersandvideosummaries.
Install
pip install tensorboardX
or build from source:
pip install 'git+https://github.com/lanpa/tensorboardX'
You can optionally install crc32c to speed up.
pip install crc32c
Starting from tensorboardX 2.1, You need to install soundfile for the add_audio() function (200x speedup).
pip install soundfile
Example
- Clone the files in https://github.com/lanpa/tensorboardX/tree/master/examples
- Run the demo script: e.g.
python examples/demo.py - Start TensorBoard with
tensorboard --logdir runs
# demo.py

import torch
import torchvision.utils as vutils
import numpy as np
import torchvision.models as models
from torchvision import datasets
from tensorboardX import SummaryWriter

resnet18 = models.resnet18(False)
writer = SummaryWriter()
sample_rate = 44100
freqs = [262, 294, 330, 349, 392, 440, 440, 440, 440, 440, 440]

for n_iter in range(100):

    dummy_s1 = torch.rand(1)
    dummy_s2 = torch.rand(1)
    # data grouping by `slash`
    writer.add_scalar('data/scalar1', dummy_s1[0], n_iter)
    writer.add_scalar('data/scalar2', dummy_s2[0], n_iter)

    writer.add_scalars('data/scalar_group', {'xsinx': n_iter * np.sin(n_iter),
                                             'xcosx': n_iter * np.cos(n_iter),
                                             'arctanx': np.arctan(n_iter)}, n_iter)

    dummy_img = torch.rand(32, 3, 64, 64)  # output from network
    if n_iter % 10 == 0:
        x = vutils.make_grid(dummy_img, normalize=True, scale_each=True)
        writer.add_image('Image', x, n_iter)

        dummy_audio = torch.zeros(sample_rate * 2)
        for i in range(x.size(0)):
            # amplitude of sound should in [-1, 1]
            dummy_audio[i] = np.cos(freqs[n_iter // 10] * np.pi * float(i) / float(sample_rate))
        writer.add_audio('myAudio', dummy_audio, n_iter, sample_rate=sample_rate)

        writer.add_text('Text', 'text logged at step:' + str(n_iter), n_iter)

        for name, param in resnet18.named_parameters():
            writer.add_histogram(name, param.clone().cpu().data.numpy(), n_iter)

        # needs tensorboard 0.4RC or later
        writer.add_pr_curve('xoxo', np.random.randint(2, size=100), np.random.rand(100), n_iter)

dataset = datasets.MNIST('mnist', train=False, download=True)
images = dataset.test_data[:100].float()
label = dataset.test_labels[:100]

features = images.view(100, 784)
writer.add_embedding(features, metadata=label, label_img=images.unsqueeze(1))

# export scalar data to JSON for external processing
writer.export_scalars_to_json("./all_scalars.json")
writer.close()
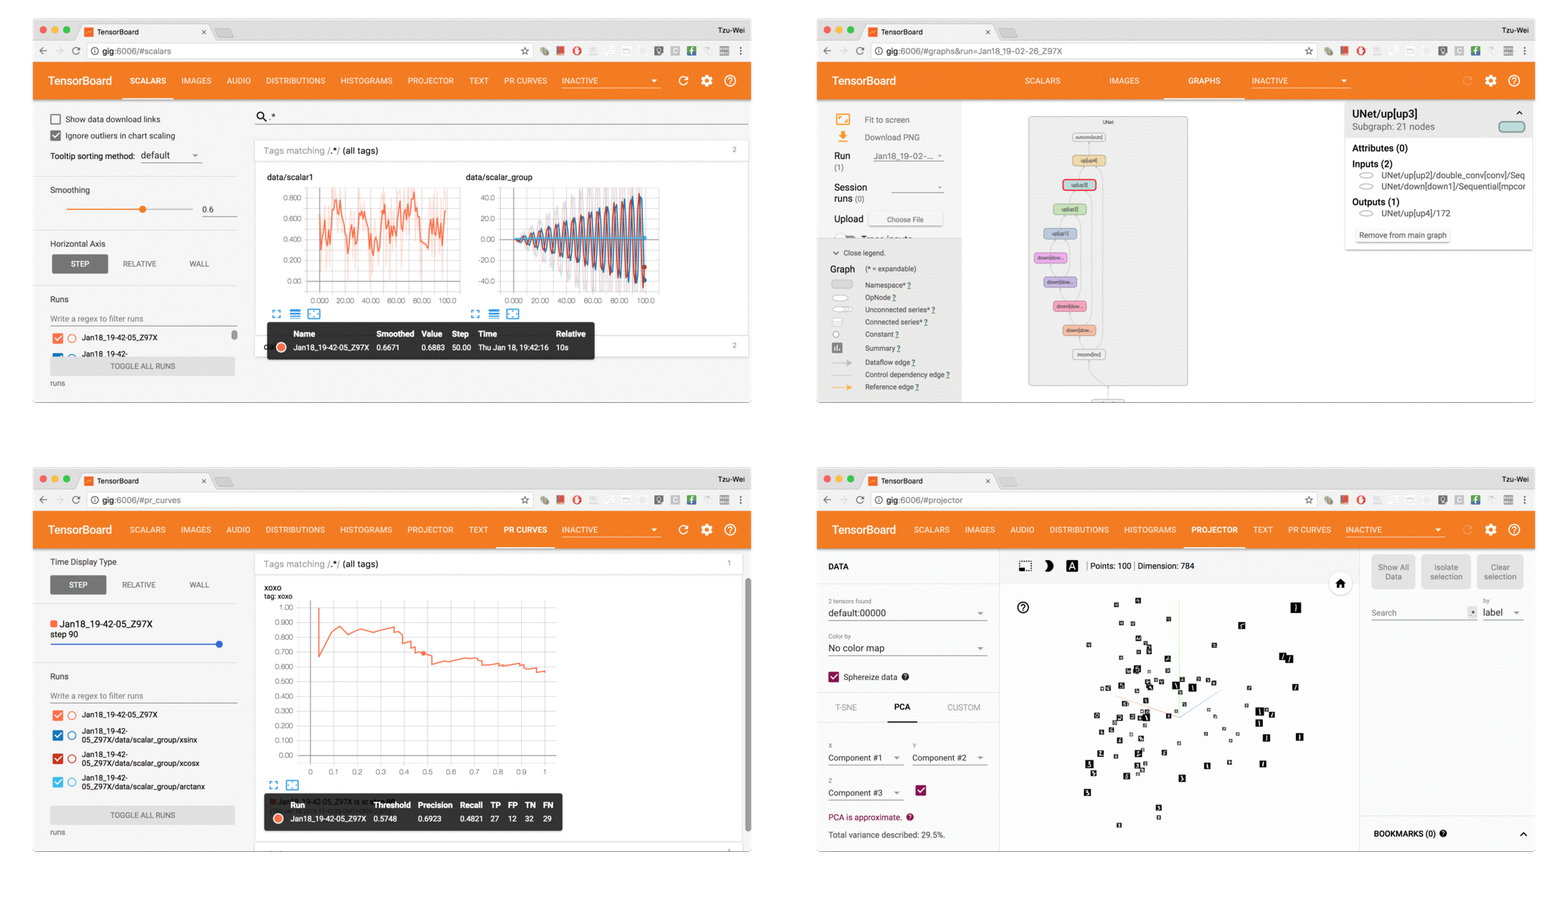
Screenshots
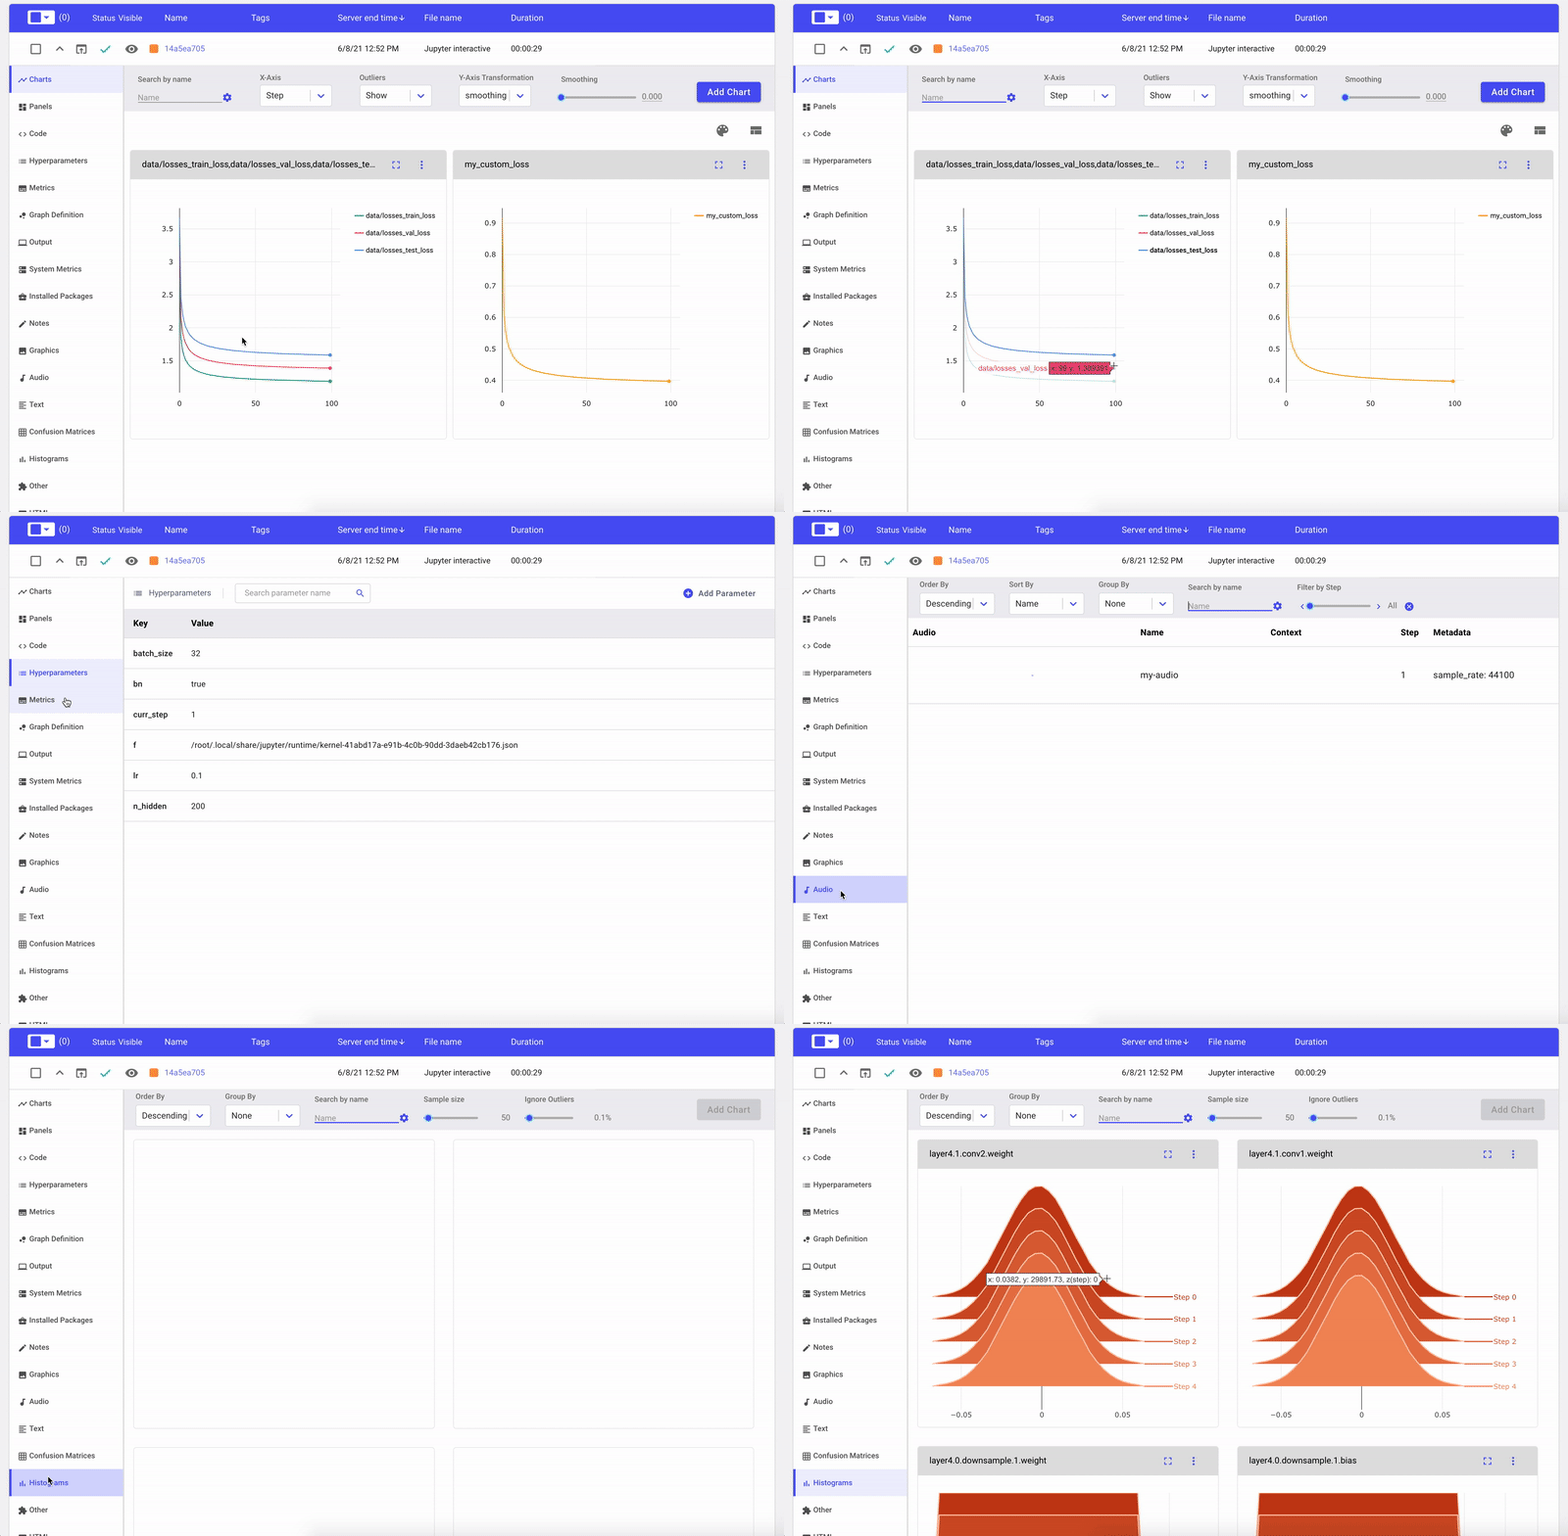
Using TensorboardX with Comet
TensorboardX now supports logging directly to Comet. Comet is a free cloud based solution that allows you to automatically track, compare and explain your experiments. It adds a lot of functionality on top of tensorboard such as dataset management, diffing experiments, seeing the code that generated the results and more.
This works out of the box and just require an additional line of code. See a full code example in this Colab Notebook
Tweaks
To add more ticks for the slider (show more image history), check https://github.com/lanpa/tensorboardX/issues/44 or https://github.com/tensorflow/tensorboard/pull/1138