
gadenbuie/tidyexplain
gadenbuie/tidyexplain has 797 GitHub stars and 235 forks. GitHot measured +1 stars in 24 hours. Last checked 2026-11-12 20:57 UTC. Last push 2022-01-11.
实测星标增长
- 24小时
- +1
- 7天
- 更新延迟
- 15天
- 更新延迟
- 1个月
- 更新延迟
各周期内的星标净变化,周期相互重叠,并非每日新增。缺失的测量保持空白。星标代表关注度,不代表软件质量。
关于
🤹♀ Animations of tidyverse verbs using R, the tidyverse, and gganimate
数据README.md
原文Tidy Animated Verbs


Garrick Aden-Buie – @grrrck – garrickadenbuie.com
Thanks to contributions from …
- Tyler Grant Smith contributed set operations animations.
- Lukas Wallrich and Kelsey Gonzalez helped create animations of tidyr’s pivoting functions.
Animations:
Mutating Joins —
inner_join(),left_join(),right_join(),full_join()Set Operations —
union(),union_all(),intersect(),setdiff()Tidy Data —
pivot_wider()andpivot_longer(),spread()andgather()Learn more about
Background
Usage
Please feel free to use these images for teaching or learning about action verbs from the tidyverse. You can directly download the original animations or static images in svg or png formats, or you can use the scripts to recreate the images locally.
Currently, the animations cover the dplyr two-table verbs and I’d like to expand the animations to include more verbs from the tidyverse. Suggestions are welcome!
Relational Data
The Relational Data chapter of the R for Data Science book by Garrett Grolemund and Hadley Wickham is an excellent resource for learning more about relational data.
The dplyr two-table verbs vignette and Jenny Bryan’s Cheatsheet for dplyr join functions are also great resources.
gganimate
The animations were made possible by the newly re-written gganimate package by Thomas Lin Pedersen (original by Dave Robinson). The package readme provides an excellent (and quick) introduction to gganimate.
Dynamic Animations
Thanks to an initial push by David Zimmermann, we have begun work towards functions that generate dynamic animations from users’ actual data. Please visit the pkg branch of the tidyexplain repository for more information (or to contribute!).
Mutating Joins
A mutating join allows you to combine variables from two tables. It first matches observations by their keys, then copies across variables from one table to the other.
R for Data Science: Mutating joins
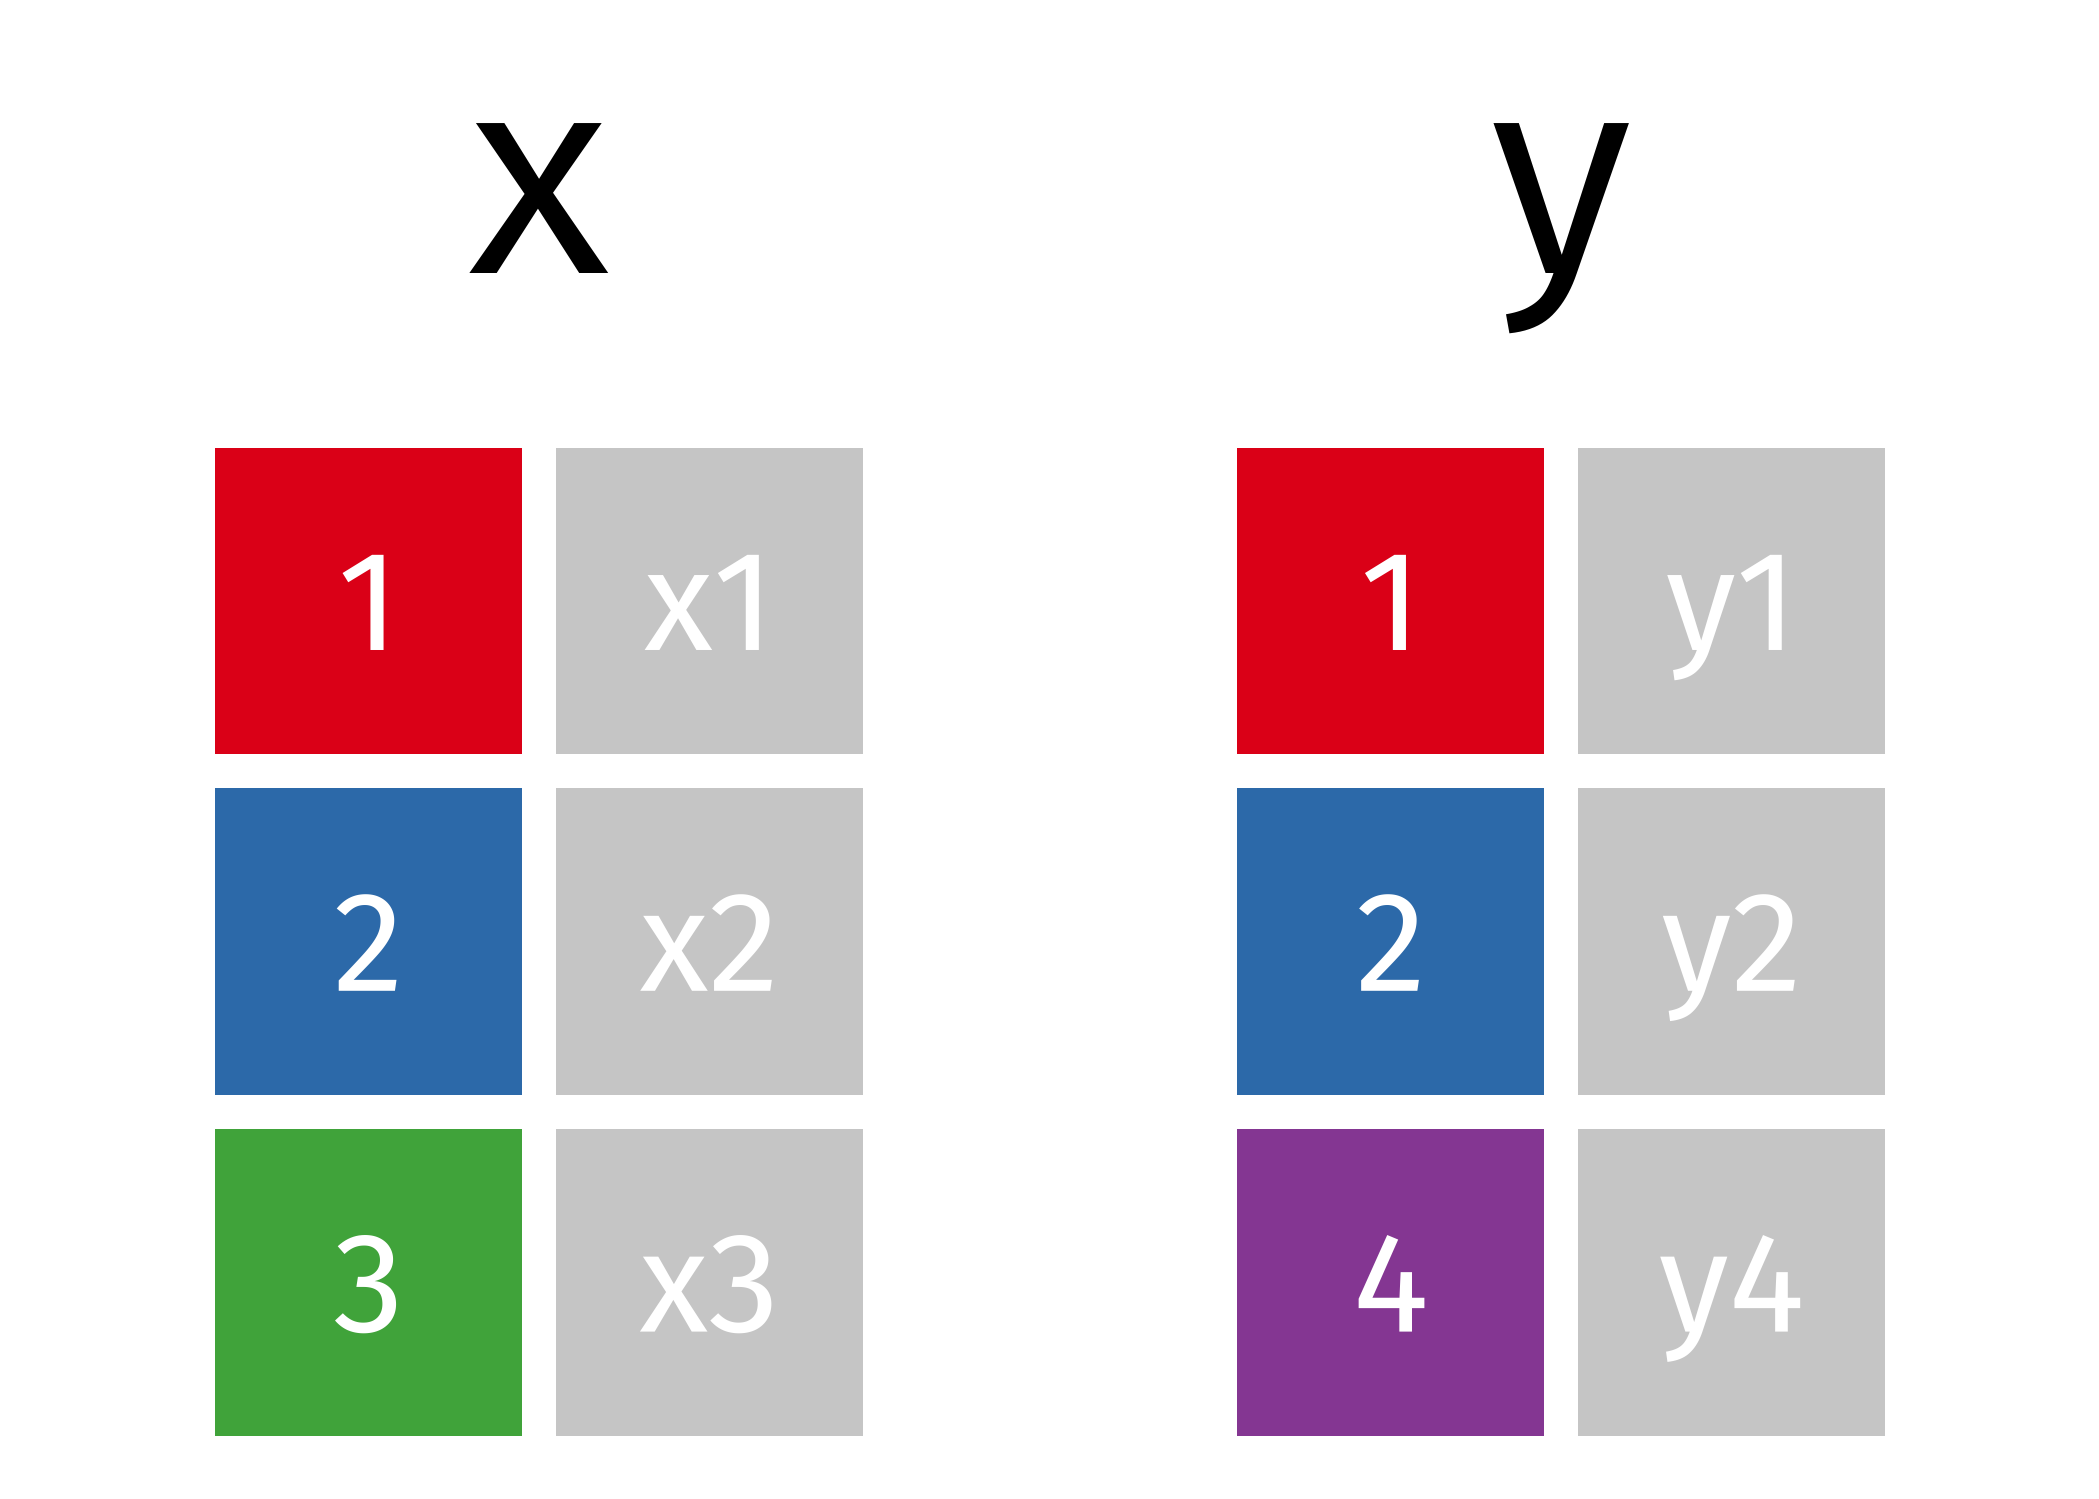
x
#> # A tibble: 3 × 2
#>      id x
#>   <int> <chr>
#> 1     1 x1
#> 2     2 x2
#> 3     3 x3
y
#> # A tibble: 3 × 2
#>      id y
#>   <int> <chr>
#> 1     1 y1
#> 2     2 y2
#> 3     4 y4
Inner Join
All rows from
xwhere there are matching values iny, and all columns fromxandy.
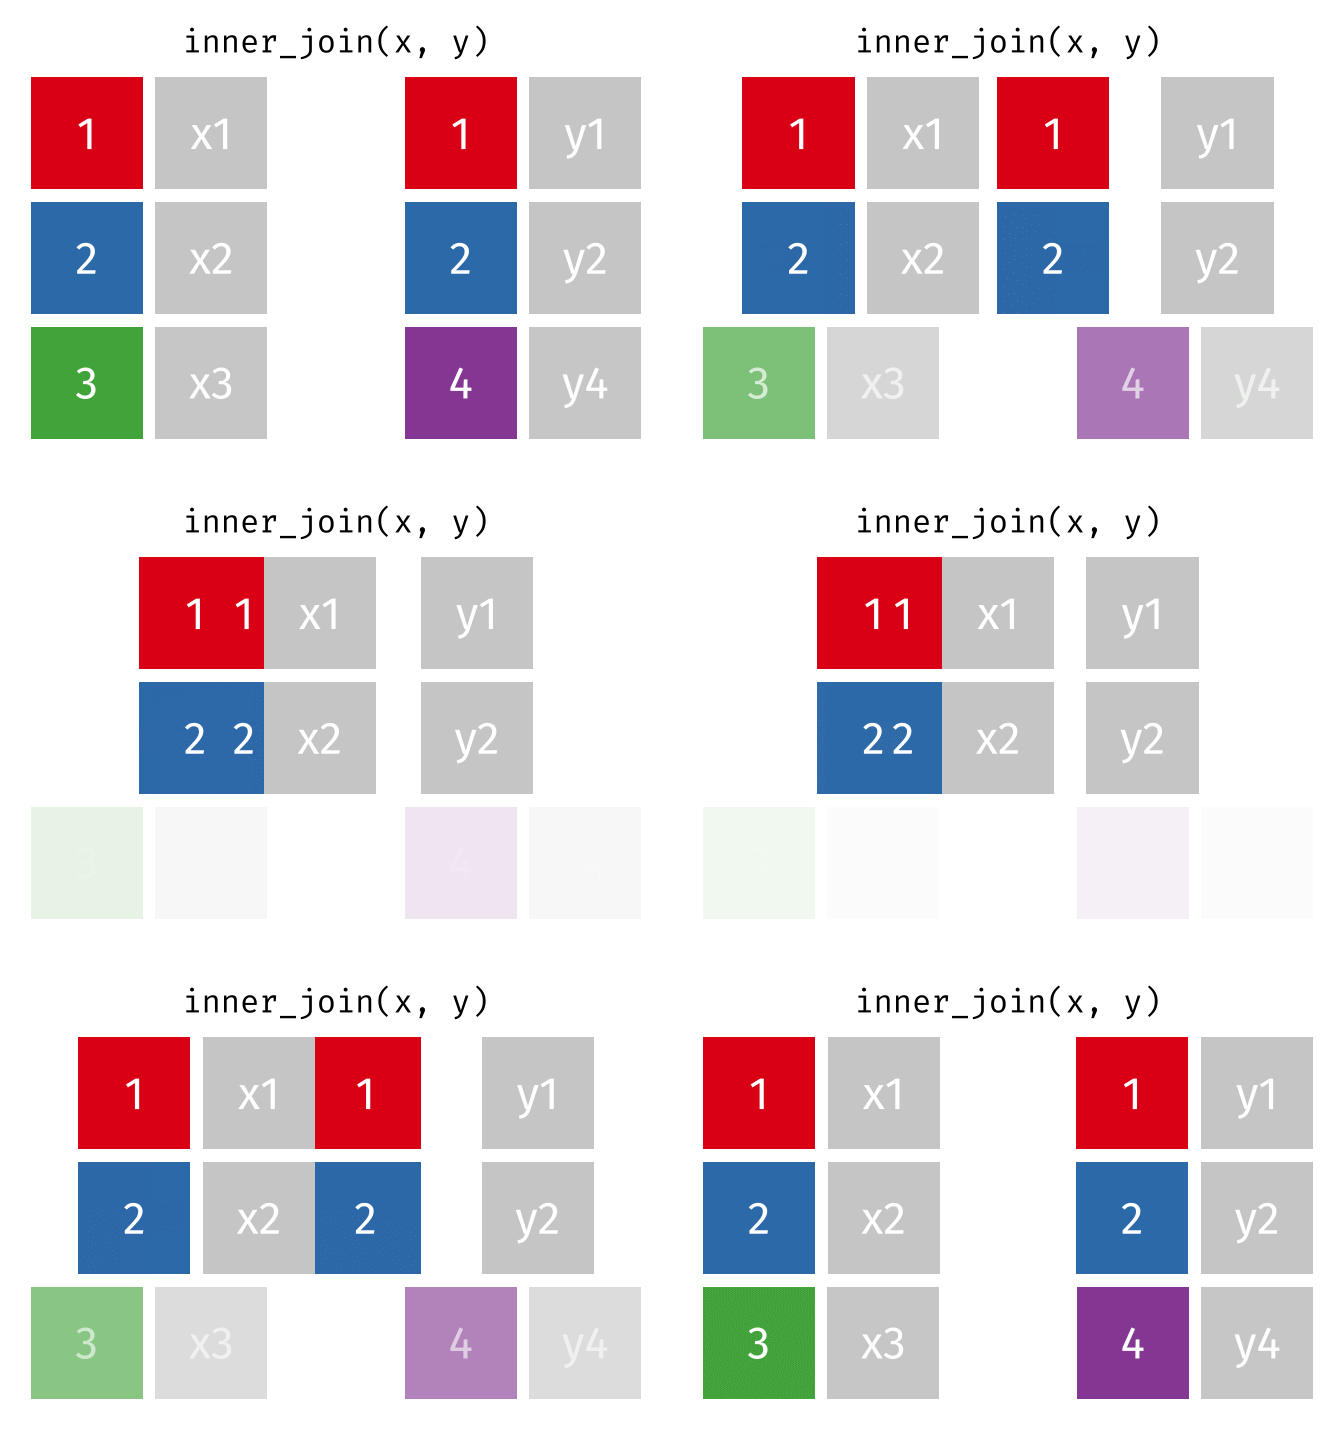
inner_join(x, y, by = "id")
#> # A tibble: 2 × 3
#>      id x     y
#>   <int> <chr> <chr>
#> 1     1 x1    y1
#> 2     2 x2    y2
Left Join
All rows from
x, and all columns fromxandy. Rows inxwith no match inywill haveNAvalues in the new columns.
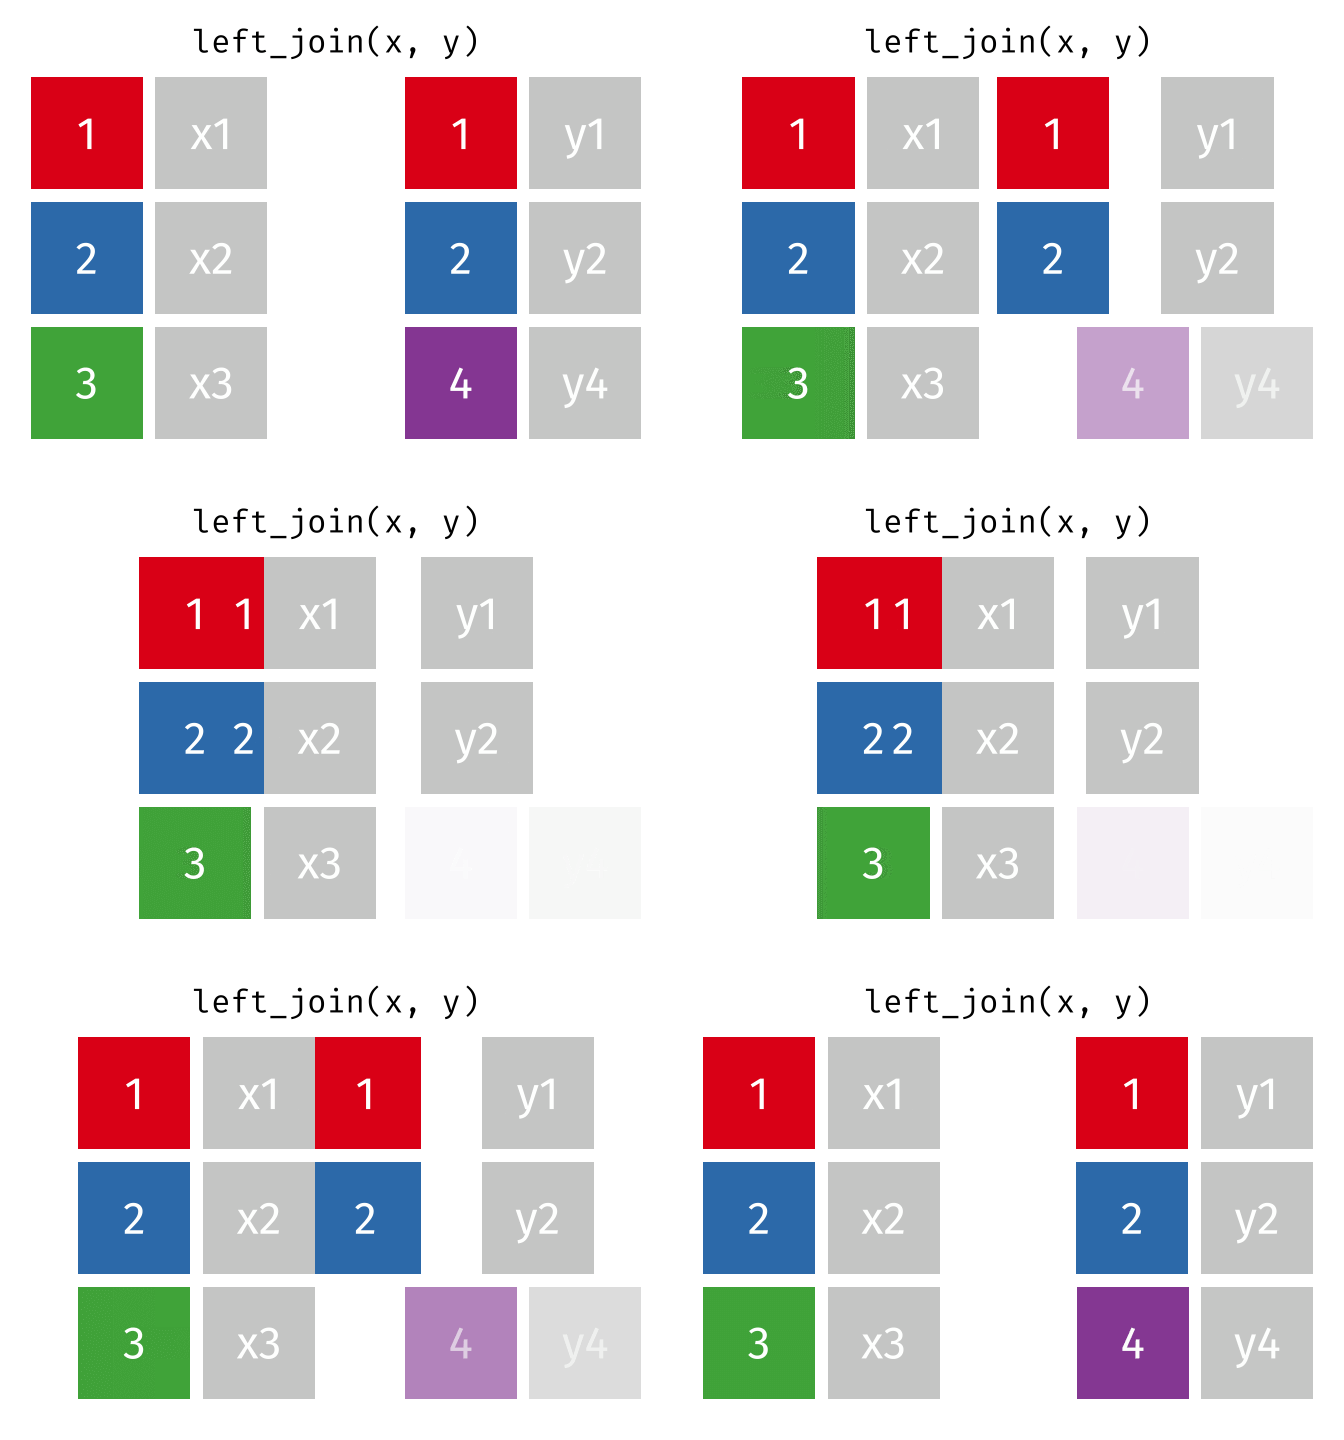
left_join(x, y, by = "id")
#> # A tibble: 3 × 3
#>      id x     y
#>   <int> <chr> <chr>
#> 1     1 x1    y1
#> 2     2 x2    y2
#> 3     3 x3    <NA>
Left Join (Extra Rows in y)
… If there are multiple matches between
xandy, all combinations of the matches are returned.
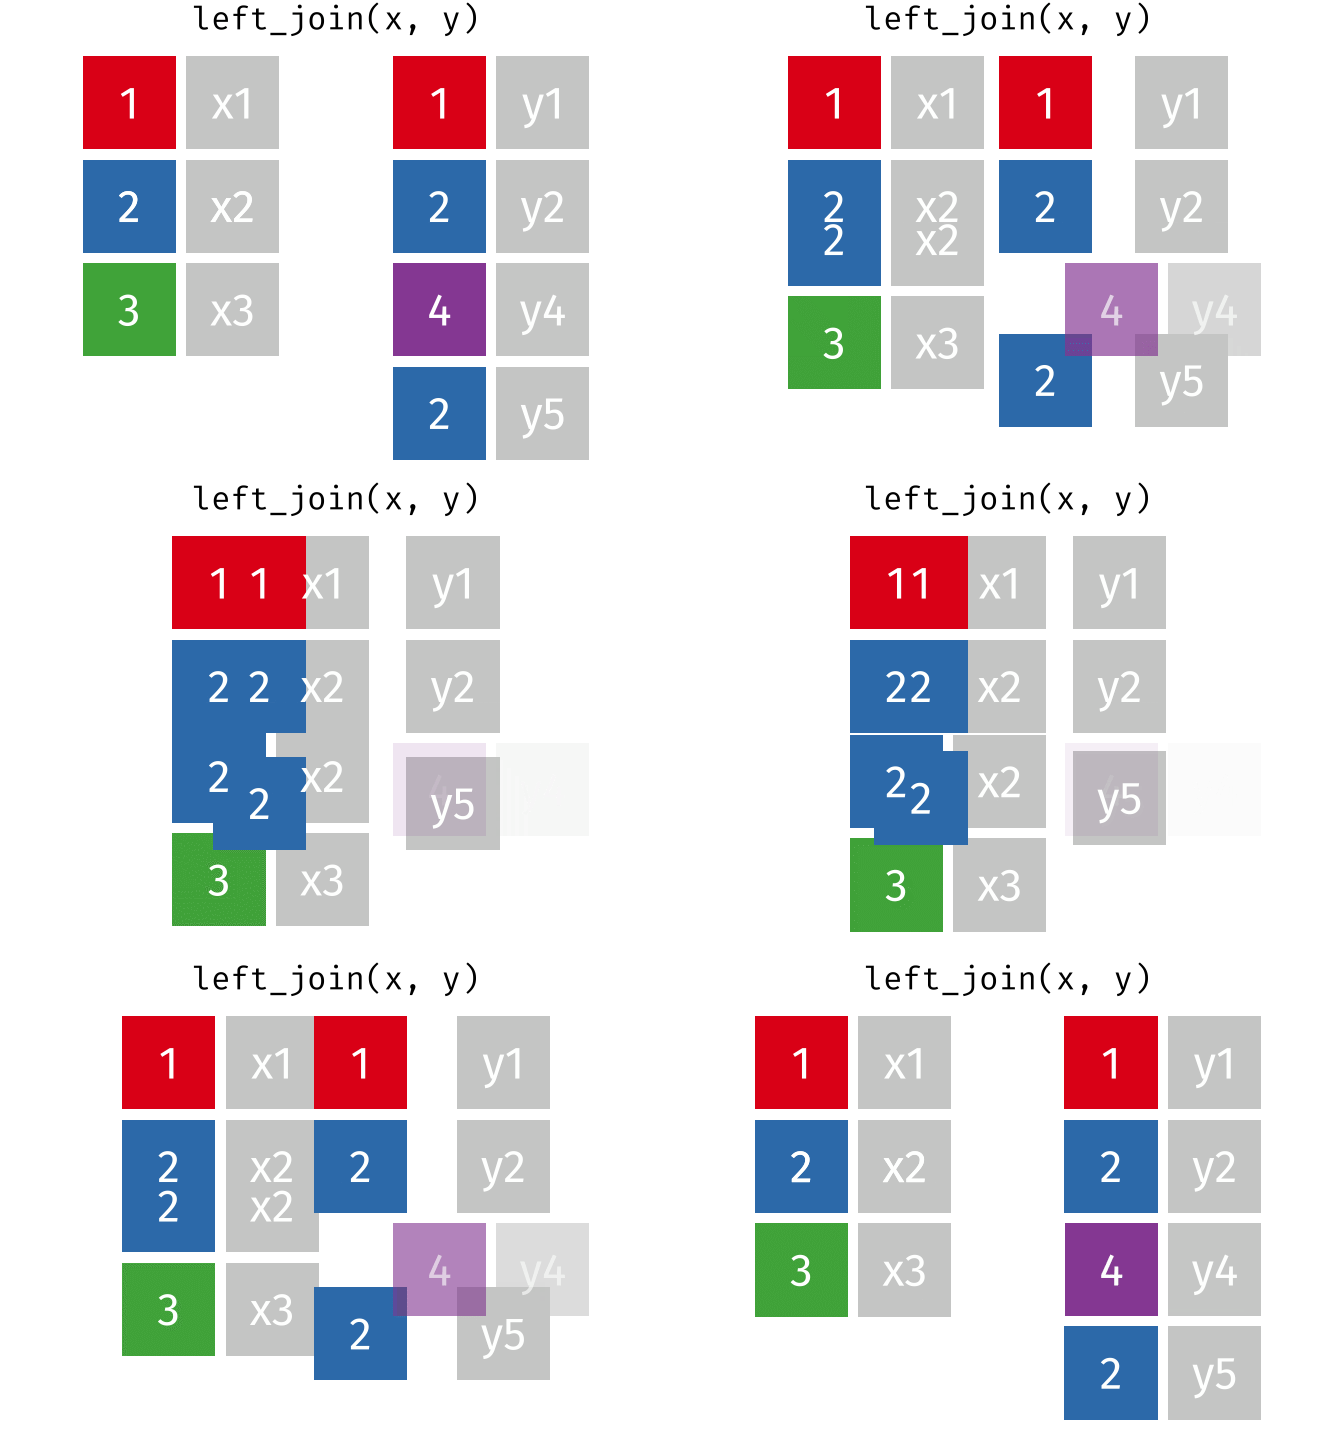
y_extra # has multiple rows with the key from `x`
#> # A tibble: 4 × 2
#>      id y
#>   <dbl> <chr>
#> 1     1 y1
#> 2     2 y2
#> 3     4 y4
#> 4     2 y5
left_join(x, y_extra, by = "id")
#> # A tibble: 4 × 3
#>      id x     y
#>   <dbl> <chr> <chr>
#> 1     1 x1    y1
#> 2     2 x2    y2
#> 3     2 x2    y5
#> 4     3 x3    <NA>
Right Join
All rows from y, and all columns from
xandy. Rows inywith no match inxwill haveNAvalues in the new columns.
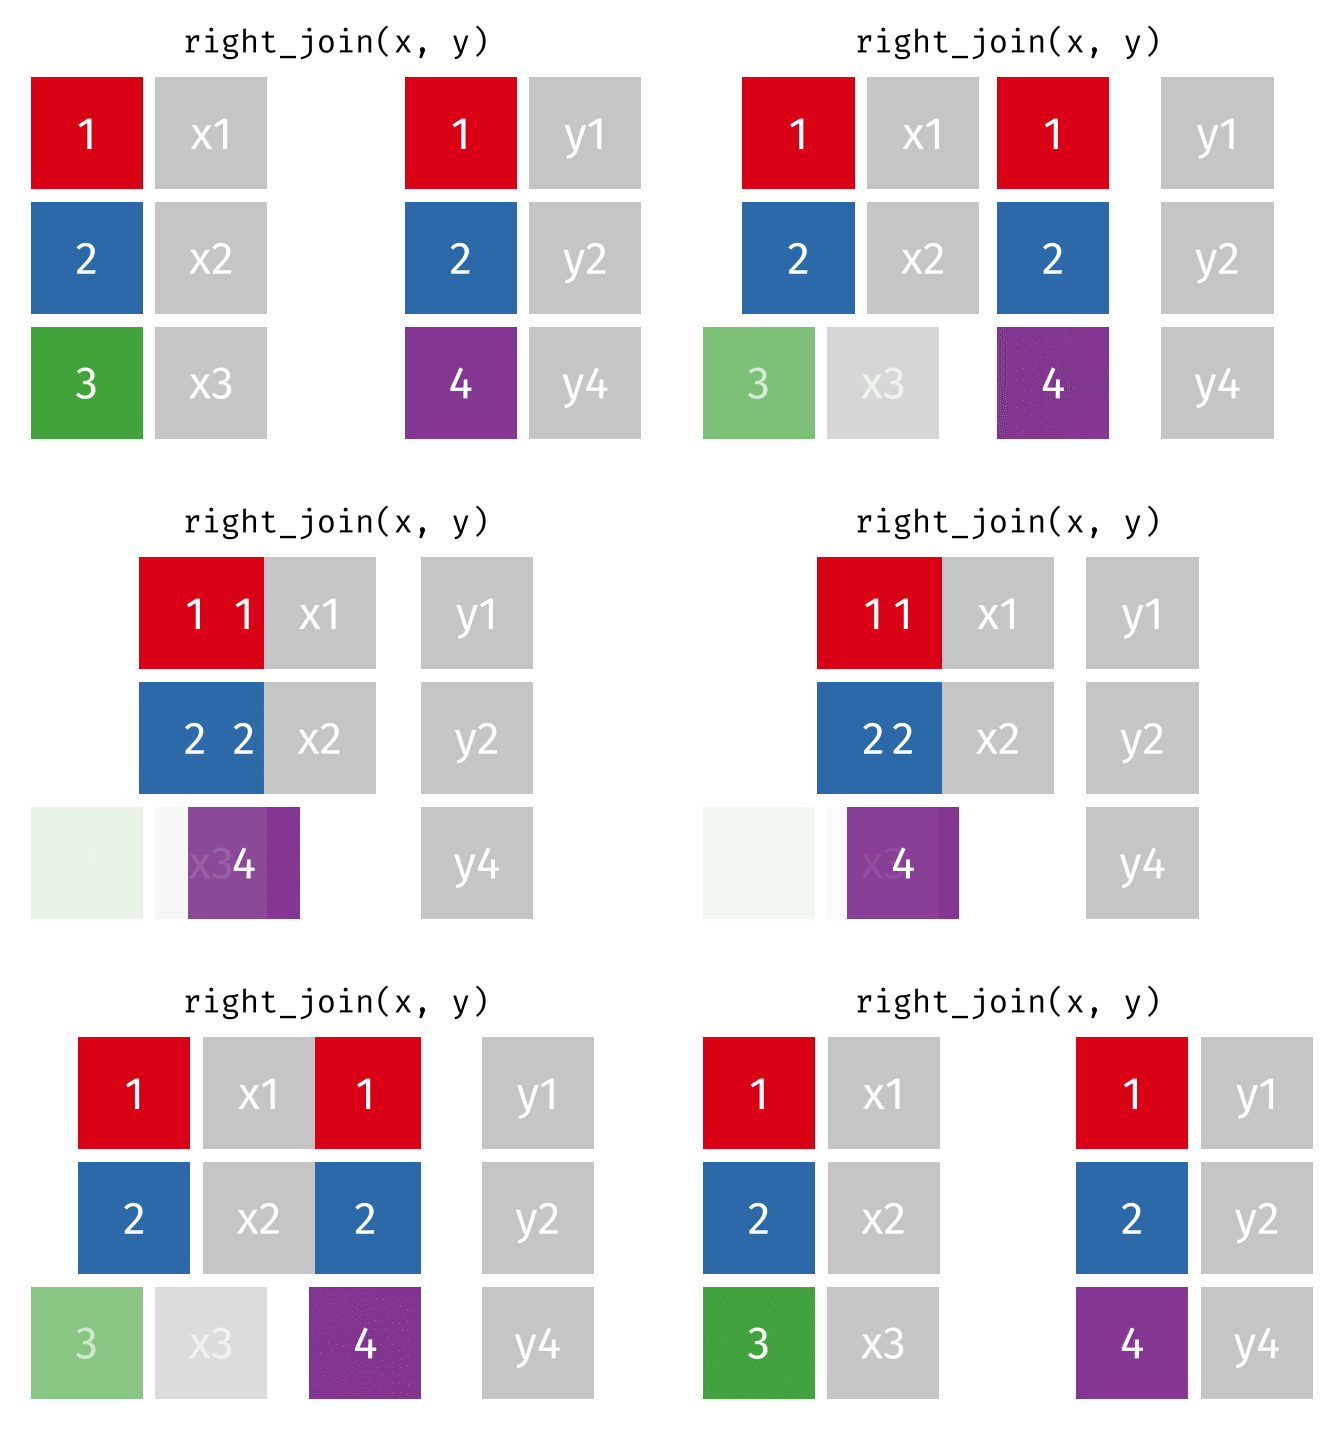
right_join(x, y, by = "id")
#> # A tibble: 3 × 3
#>      id x     y
#>   <int> <chr> <chr>
#> 1     1 x1    y1
#> 2     2 x2    y2
#> 3     4 <NA>  y4
Full Join
All rows and all columns from both
xandy. Where there are not matching values, returnsNAfor the one missing.
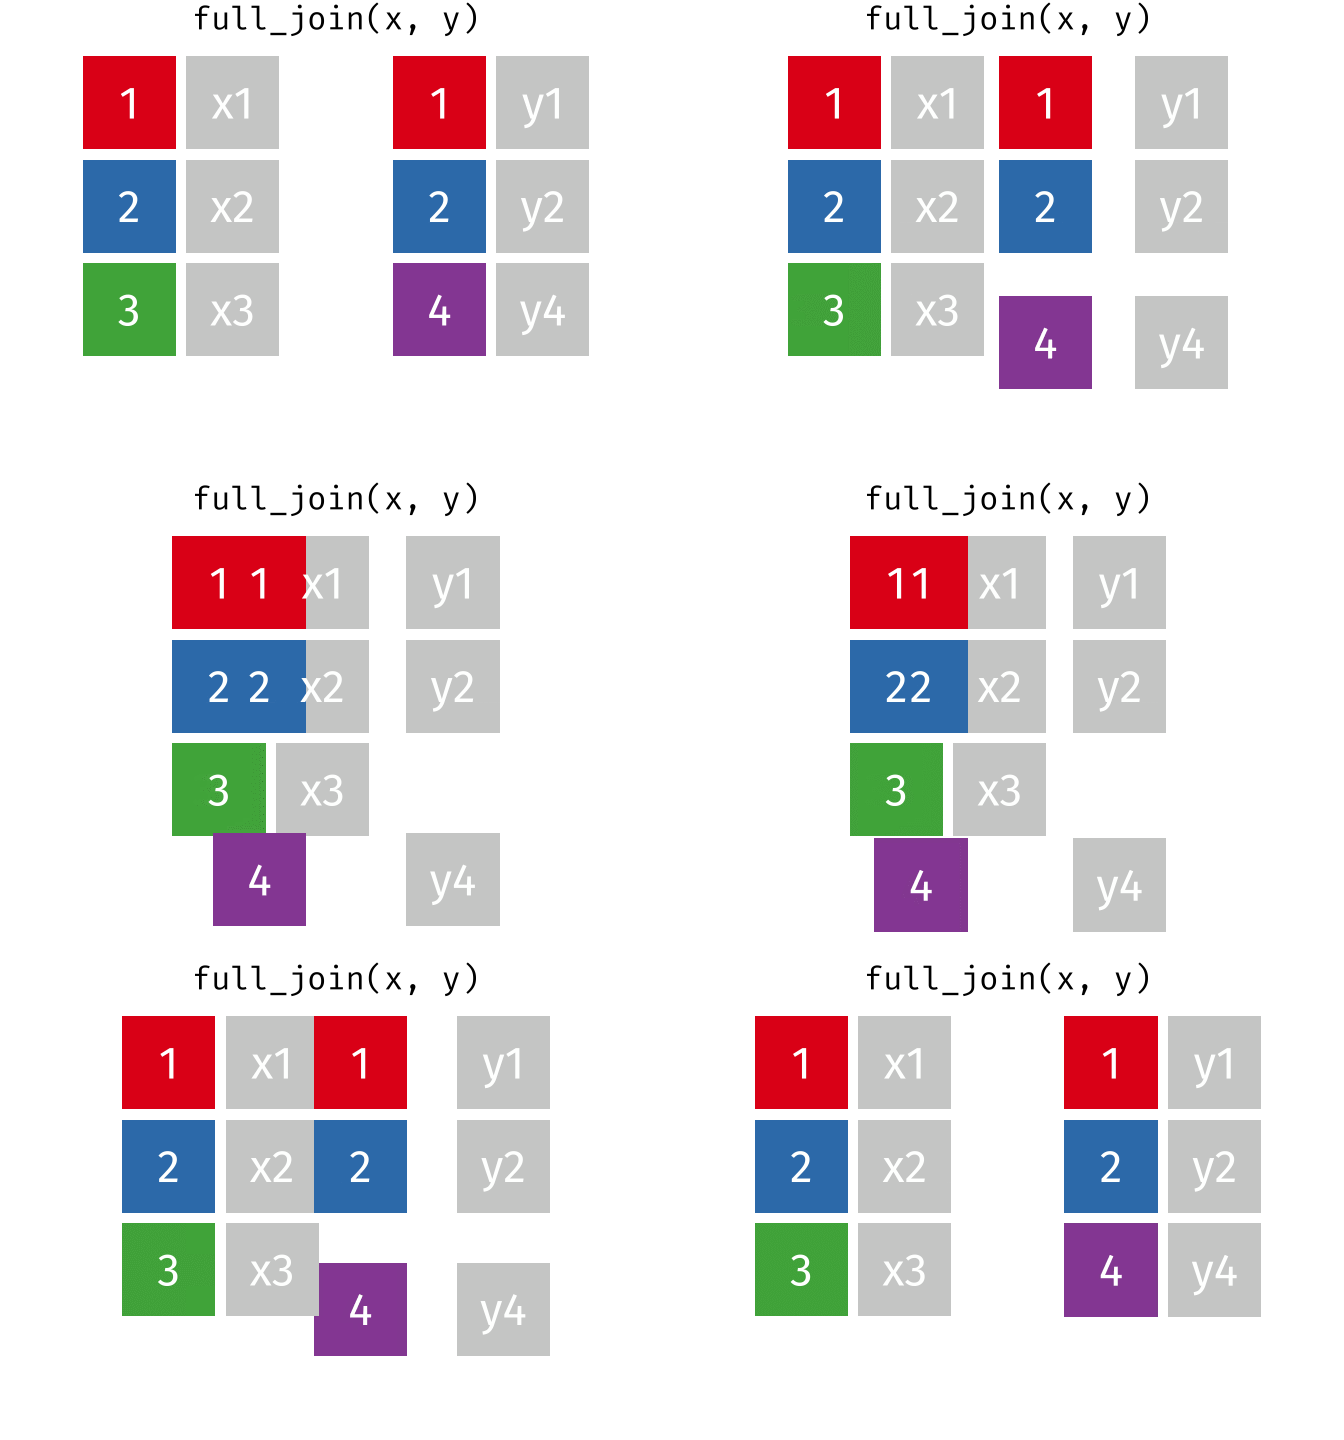
full_join(x, y, by = "id")
#> # A tibble: 4 × 3
#>      id x     y
#>   <int> <chr> <chr>
#> 1     1 x1    y1
#> 2     2 x2    y2
#> 3     3 x3    <NA>
#> 4     4 <NA>  y4
Filtering Joins
Filtering joins match observations in the same way as mutating joins, but affect the observations, not the variables. … Semi-joins are useful for matching filtered summary tables back to the original rows. … Anti-joins are useful for diagnosing join mismatches.
R for Data Science: Filtering Joins
Semi Join
All rows from
xwhere there are matching values iny, keeping just columns fromx.
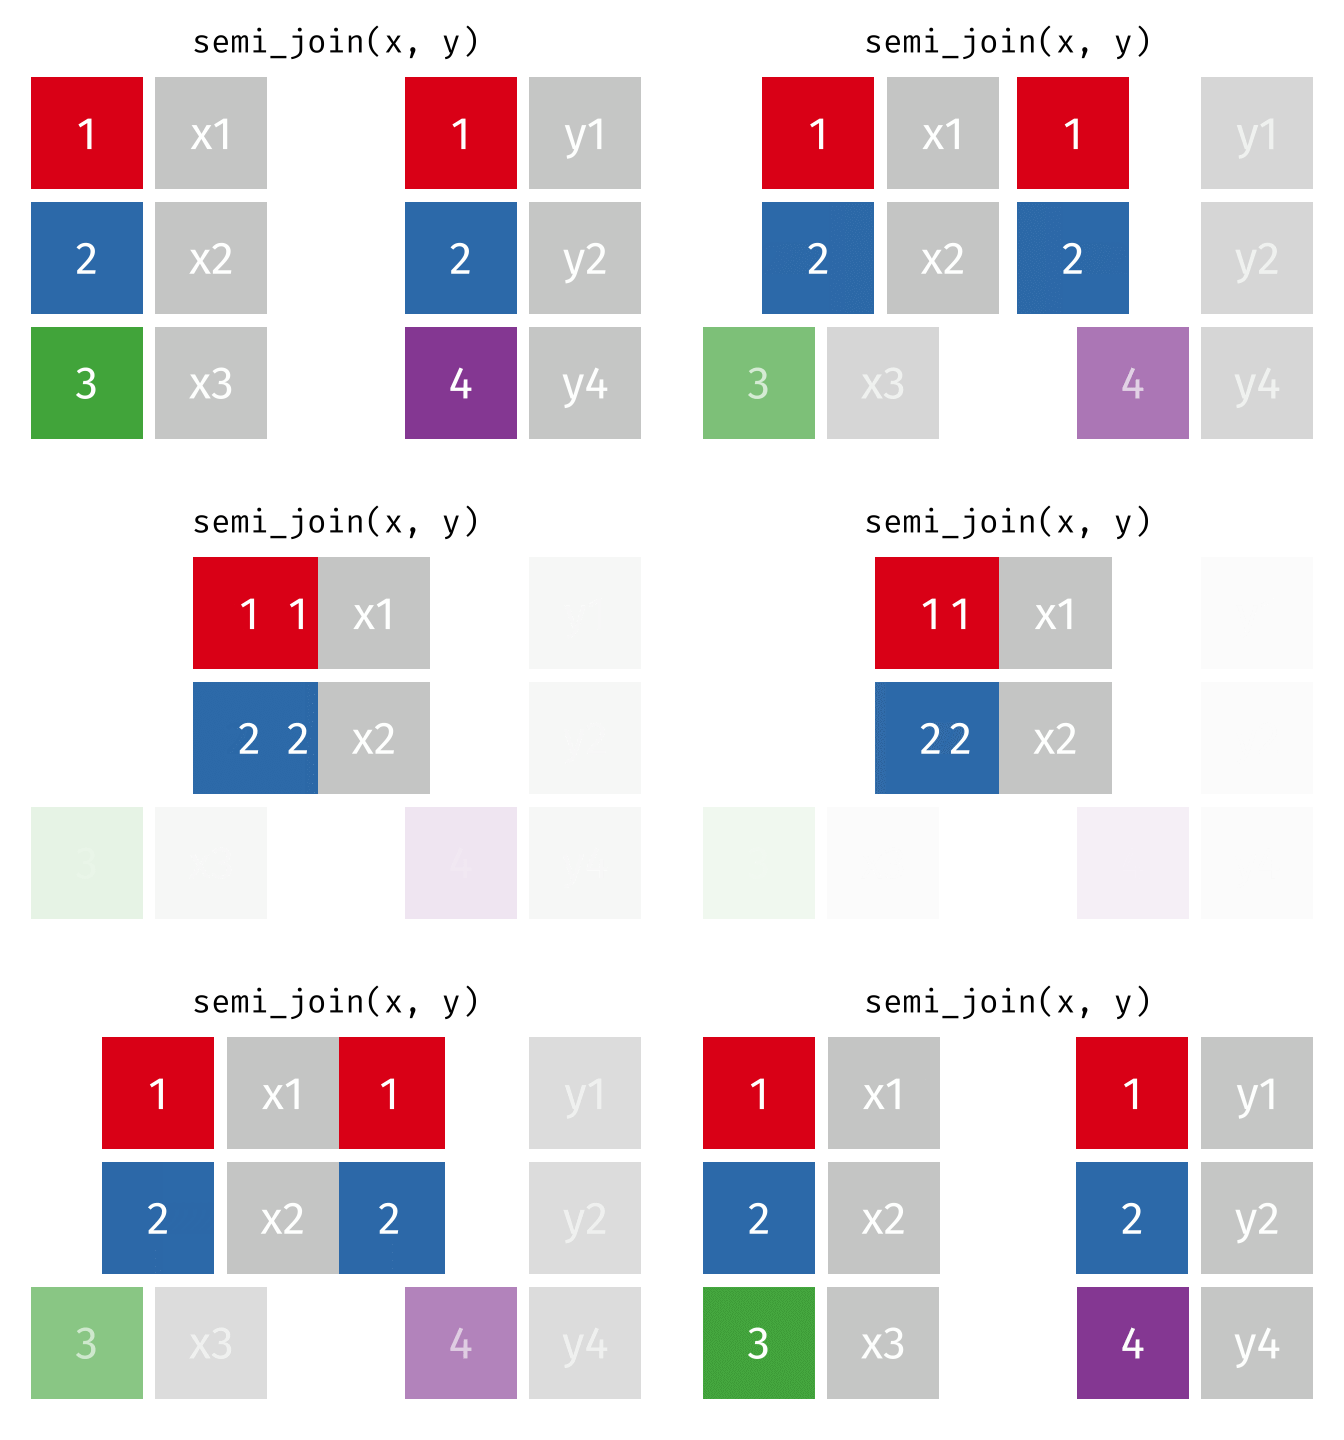
semi_join(x, y, by = "id")
#> # A tibble: 2 × 2
#>      id x
#>   <int> <chr>
#> 1     1 x1
#> 2     2 x2
Anti Join
All rows from
xwhere there are not matching values iny, keeping just columns fromx.
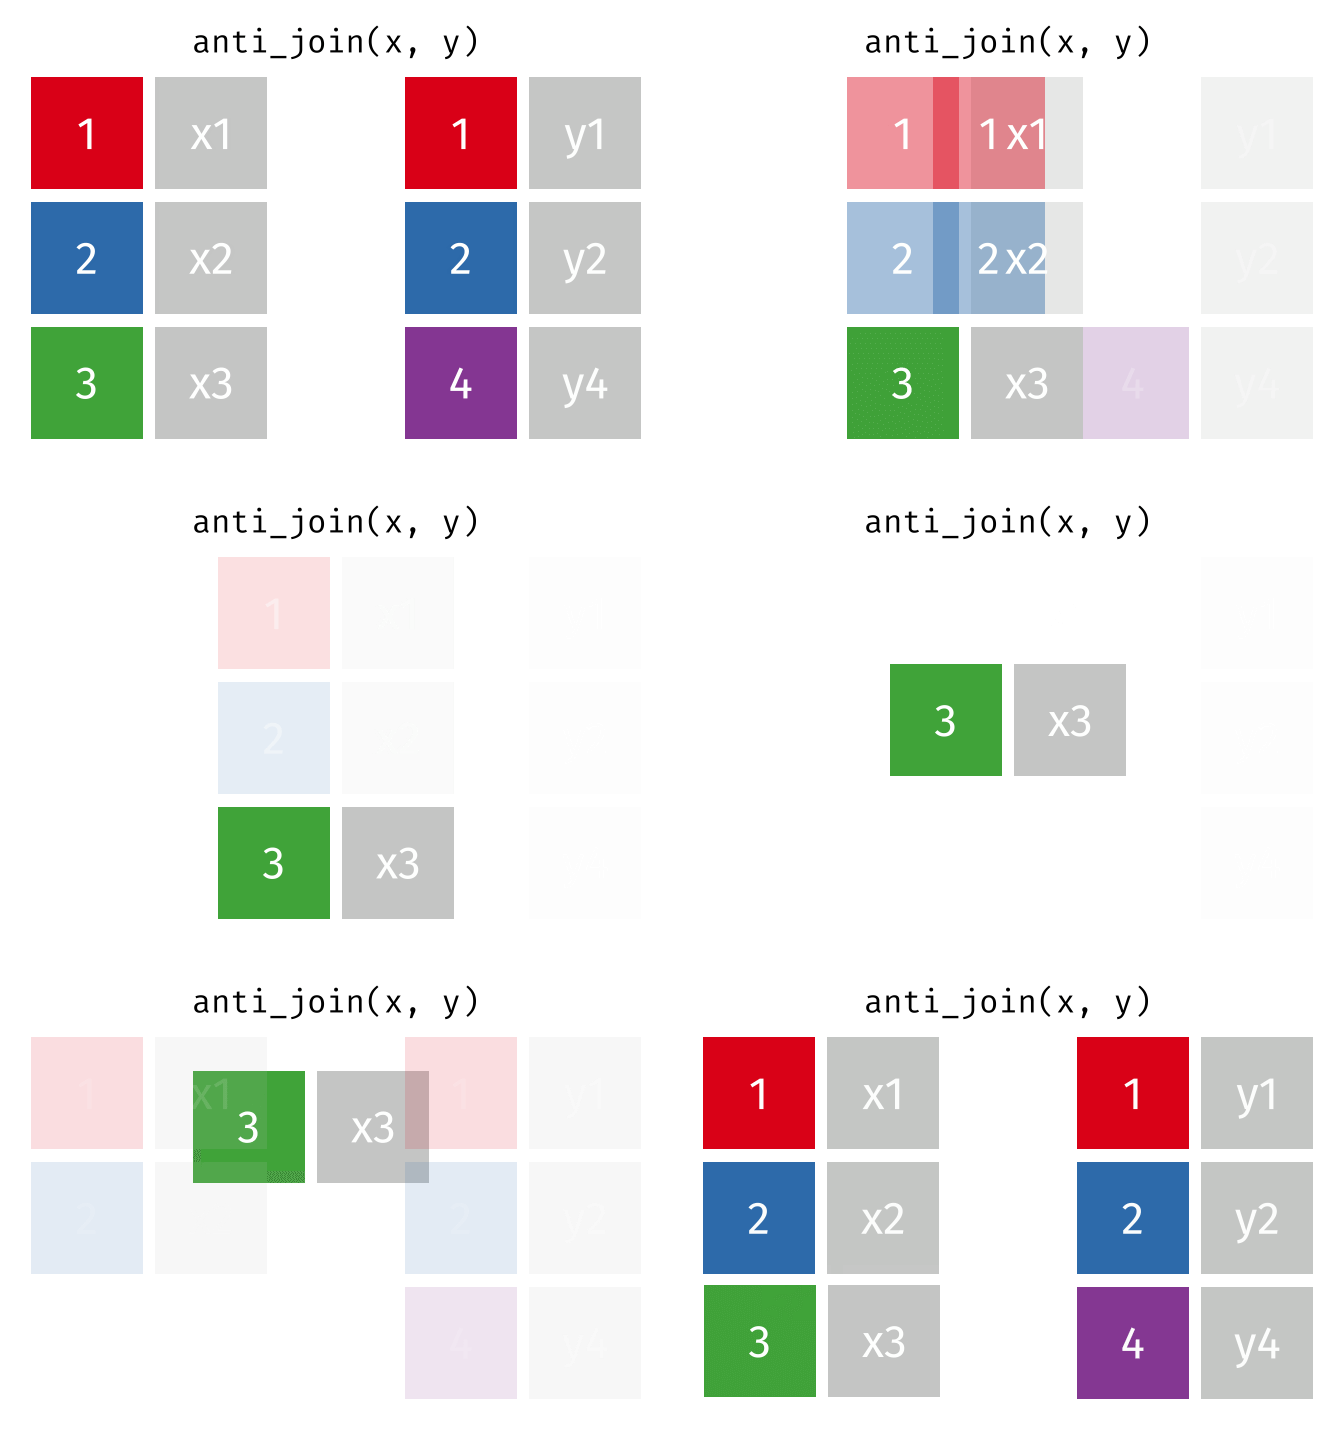
anti_join(x, y, by = "id")
#> # A tibble: 1 × 2
#>      id x
#>   <int> <chr>
#> 1     3 x3
Set Operations
Set operations are occasionally useful when you want to break a single complex filter into simpler pieces. All these operations work with a complete row, comparing the values of every variable. These expect the x and y inputs to have the same variables, and treat the observations like sets.
R for Data Science: Set operations
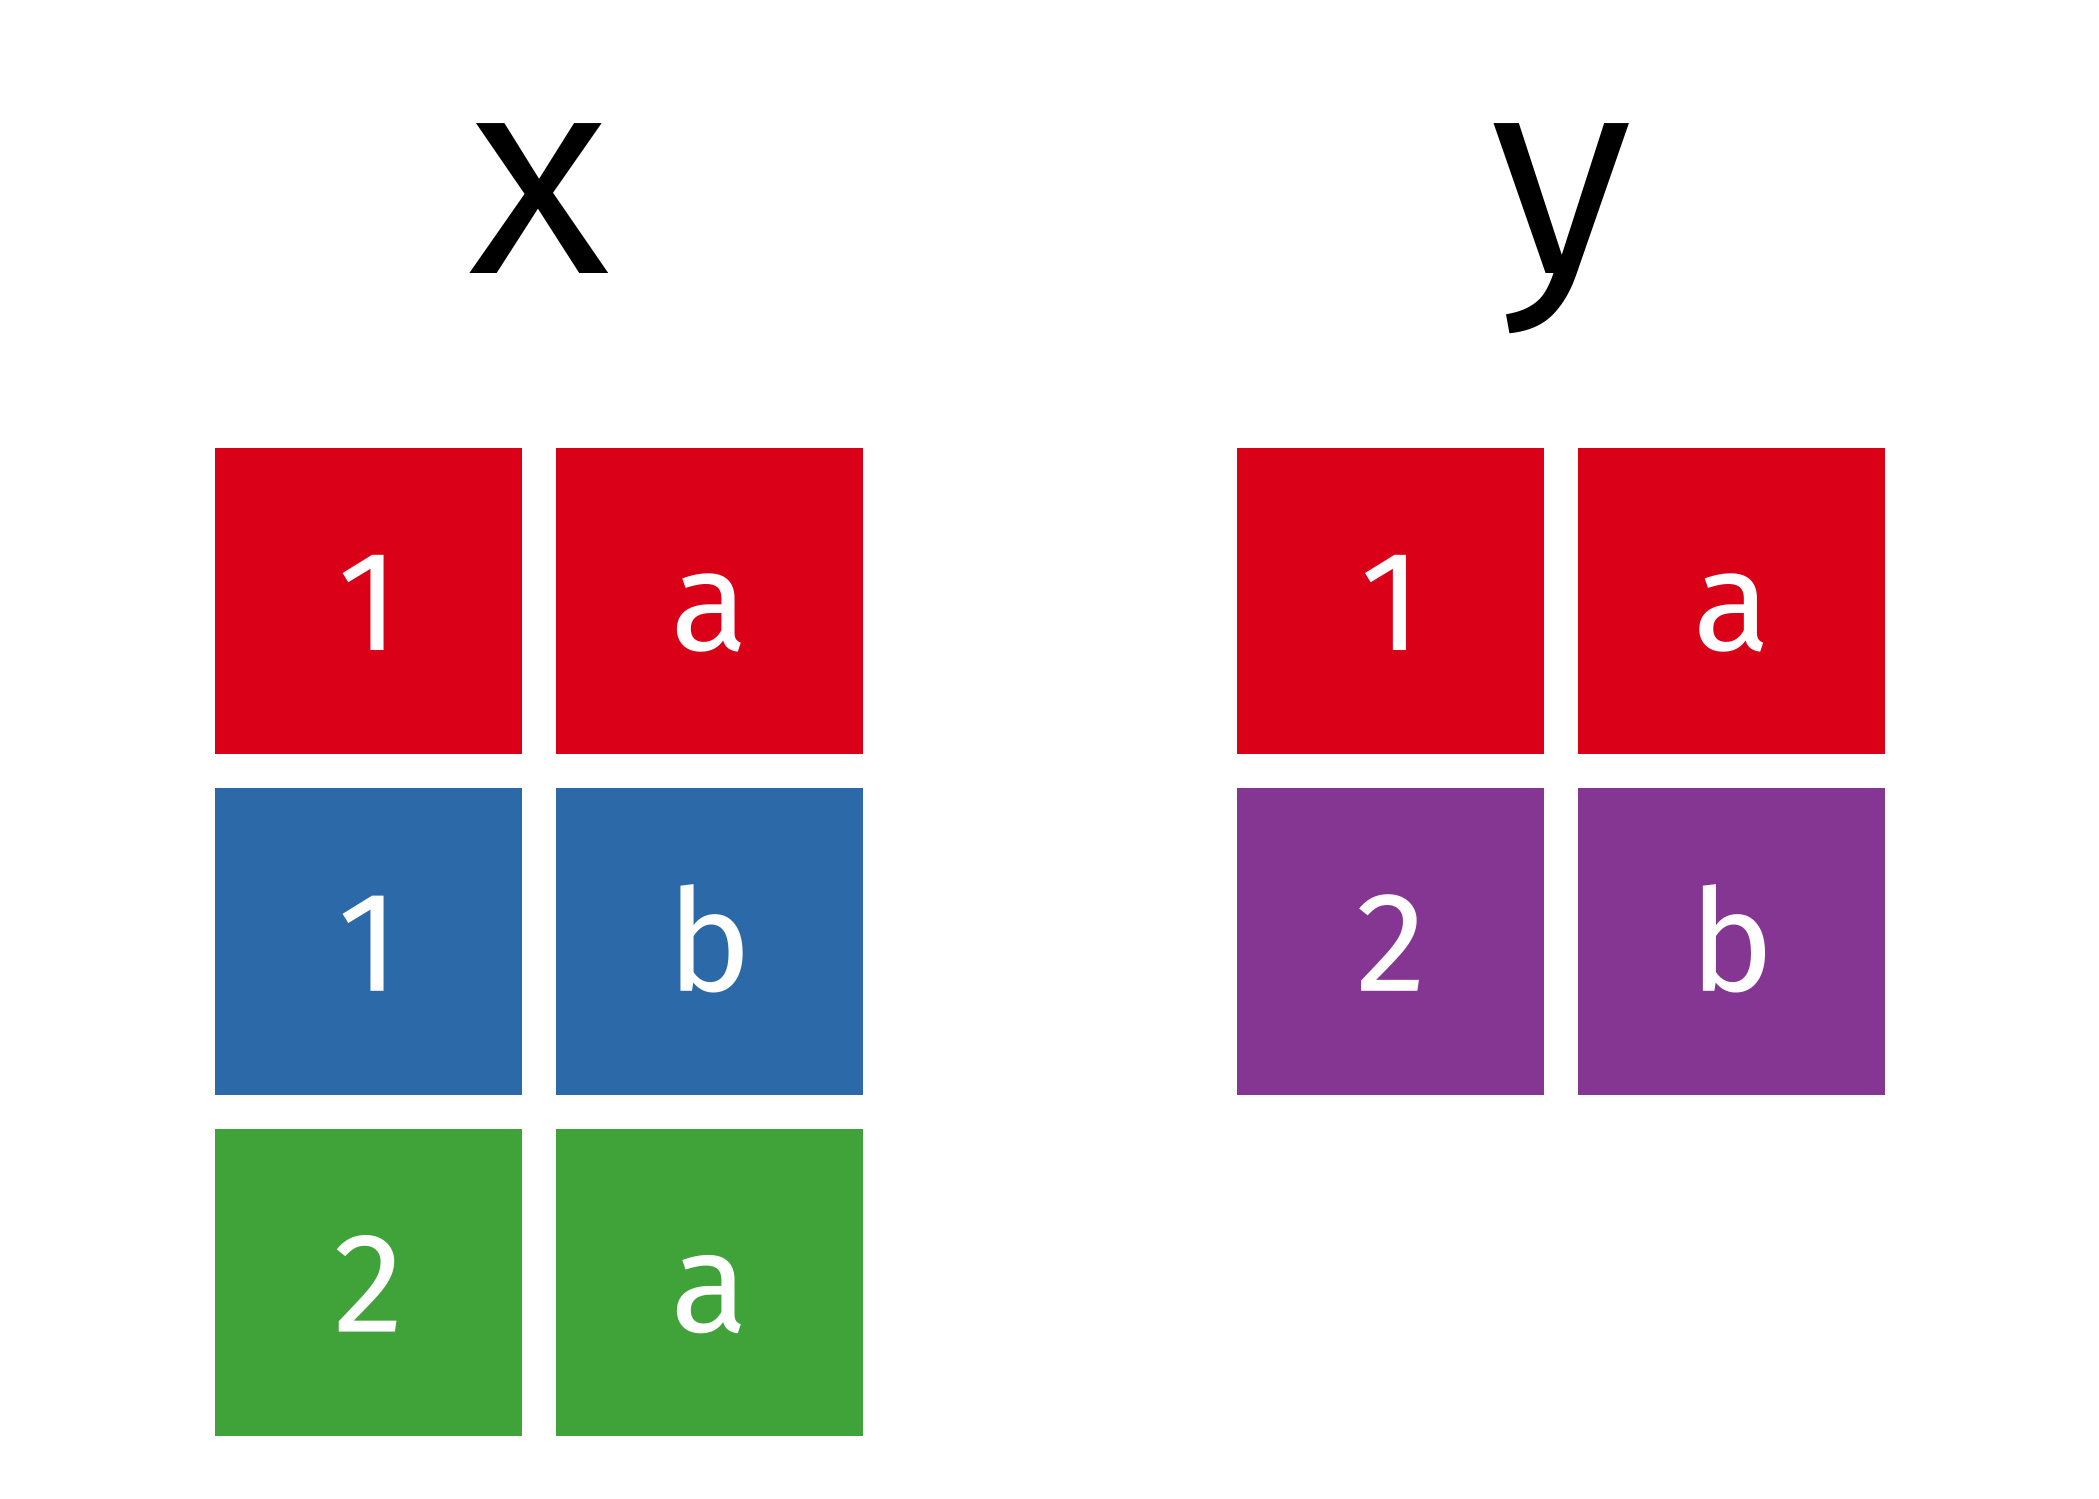
x
#> # A tibble: 3 × 2
#>   x     y
#>   <chr> <chr>
#> 1 1     a
#> 2 1     b
#> 3 2     a
y
#> # A tibble: 2 × 2
#>   x     y
#>   <chr> <chr>
#> 1 1     a
#> 2 2     b
Union
All unique rows from
xandy.
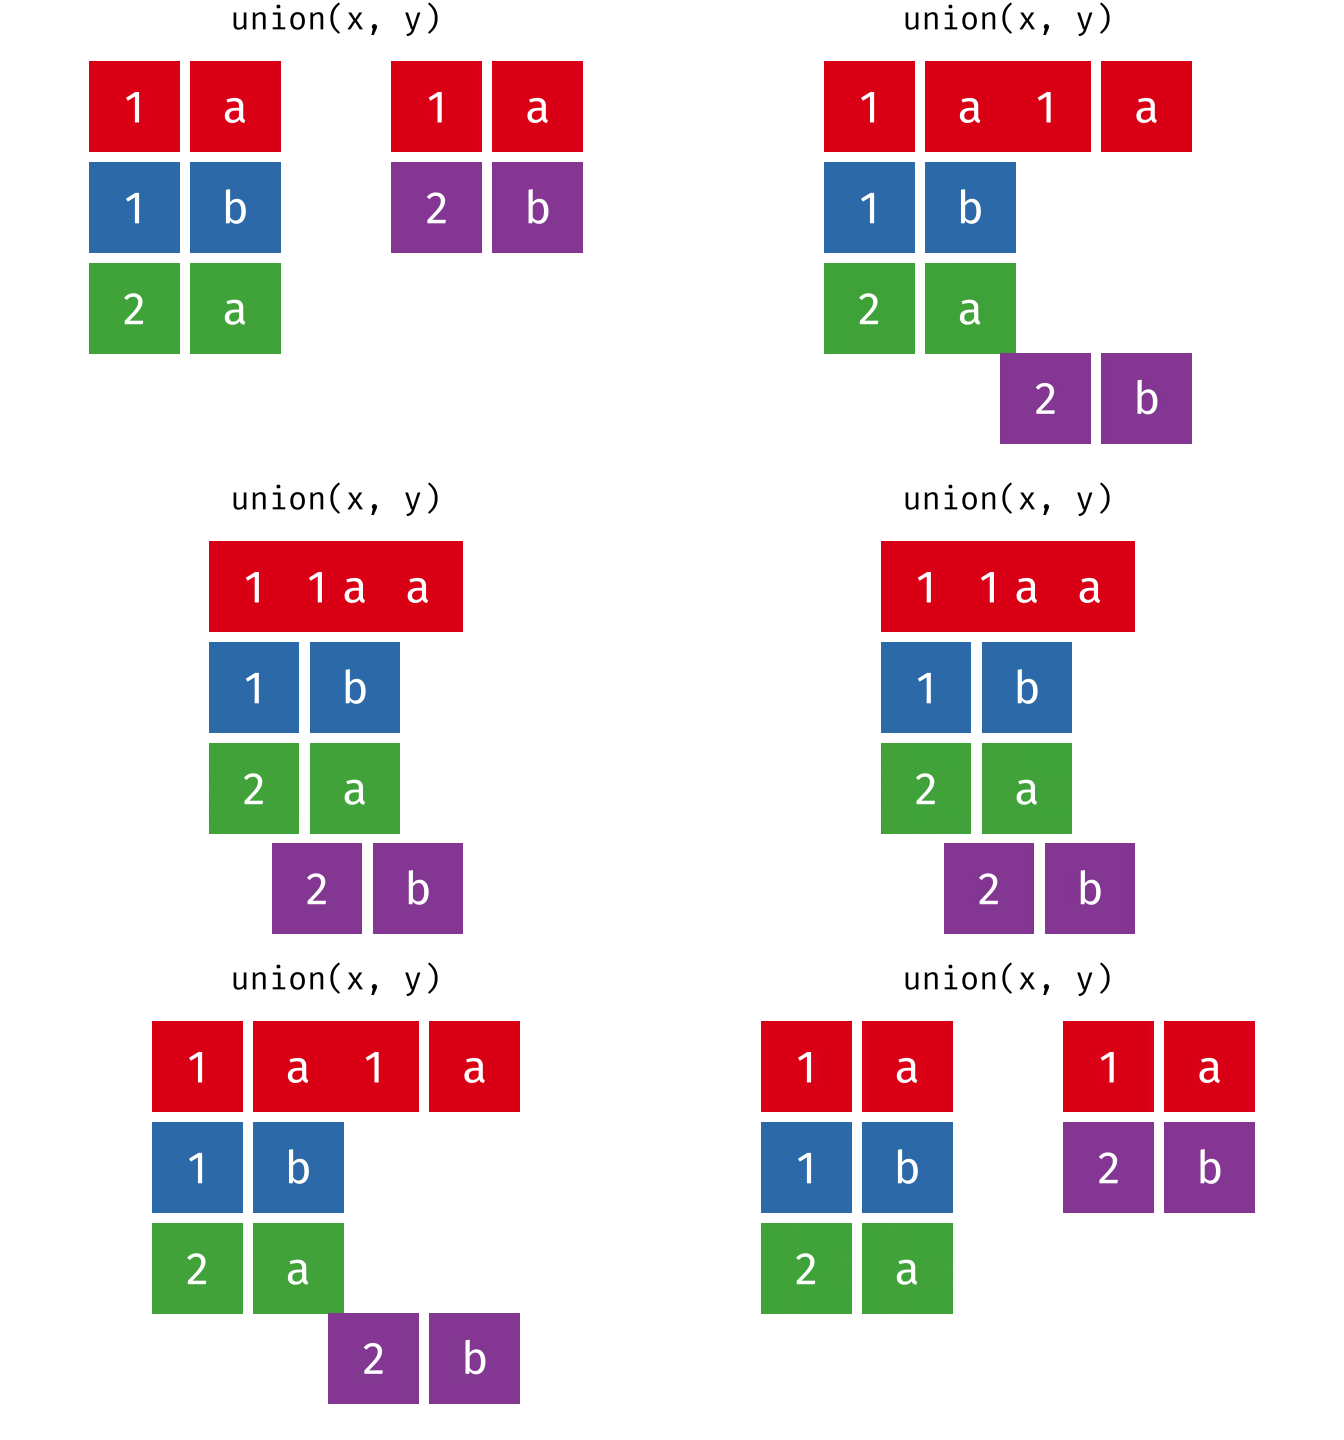
union(x, y)
#> # A tibble: 4 × 2
#>   x     y
#>   <chr> <chr>
#> 1 1     a
#> 2 1     b
#> 3 2     a
#> 4 2     b
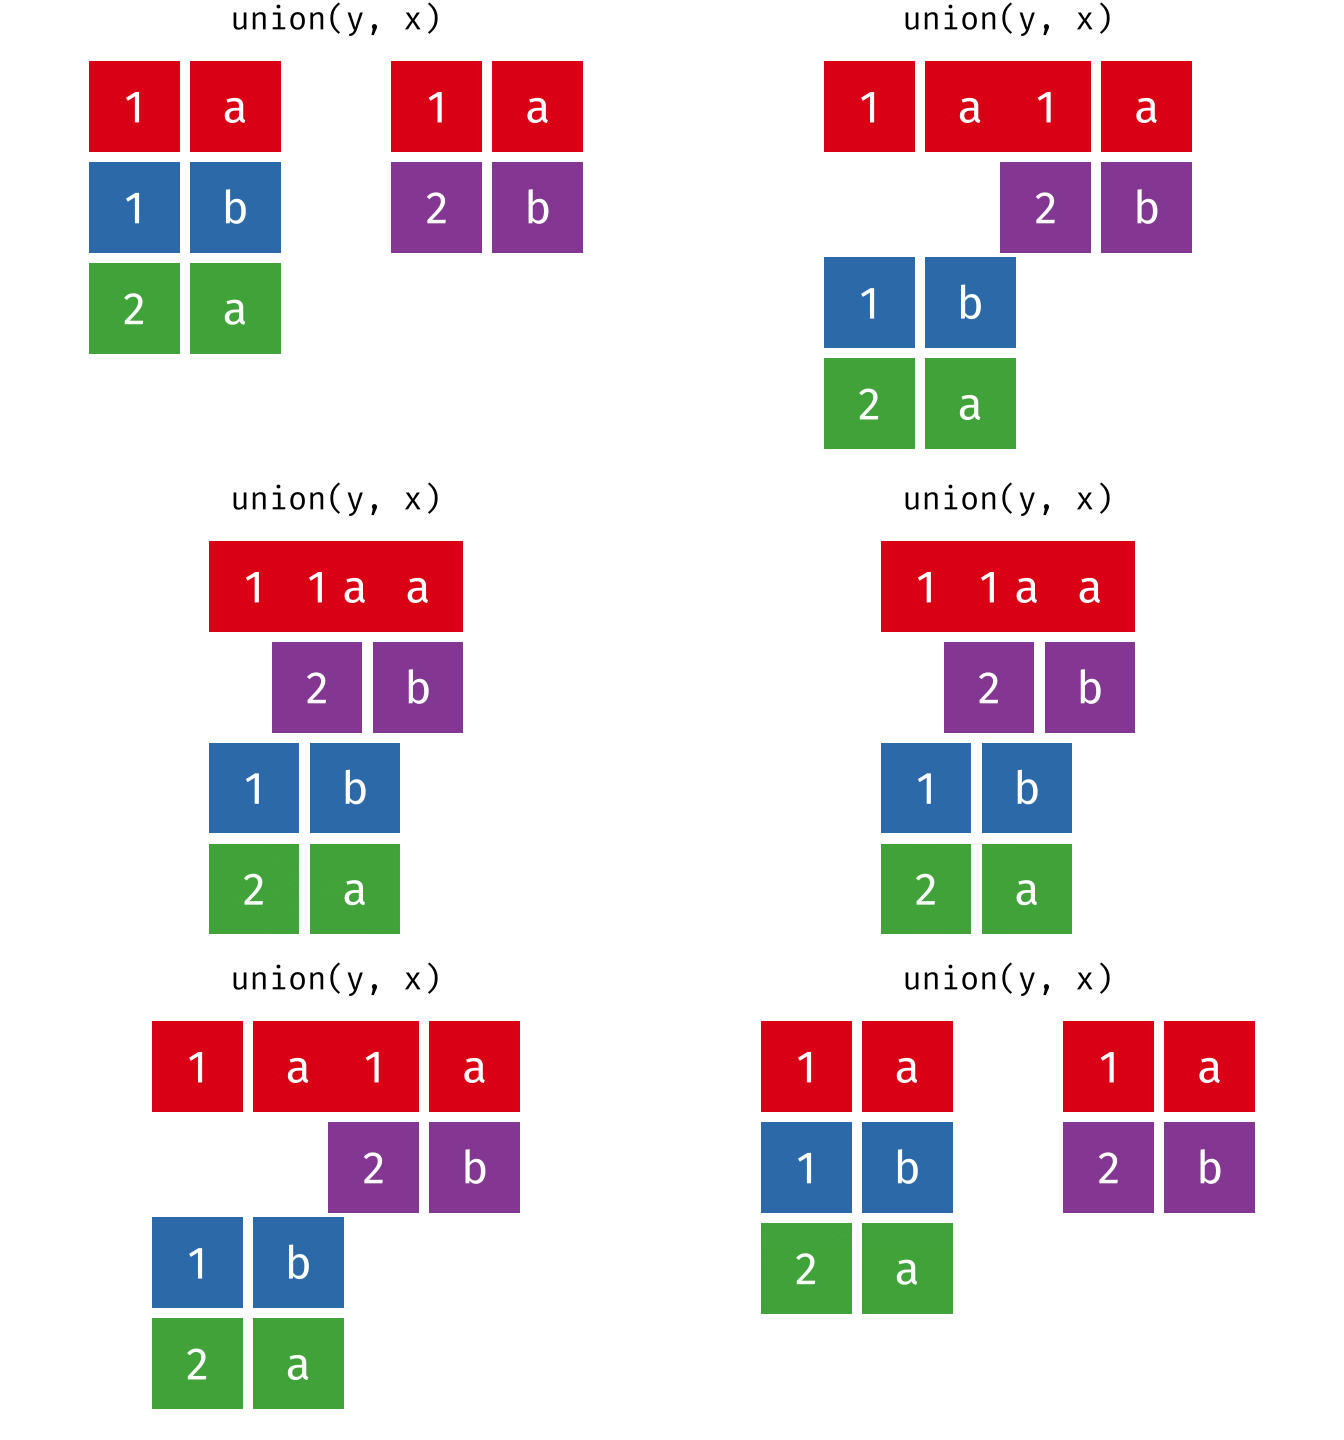
union(y, x)
#> # A tibble: 4 × 2
#>   x     y
#>   <chr> <chr>
#> 1 1     a
#> 2 2     b
#> 3 1     b
#> 4 2     a
Union All
All rows from
xandy, keeping duplicates.
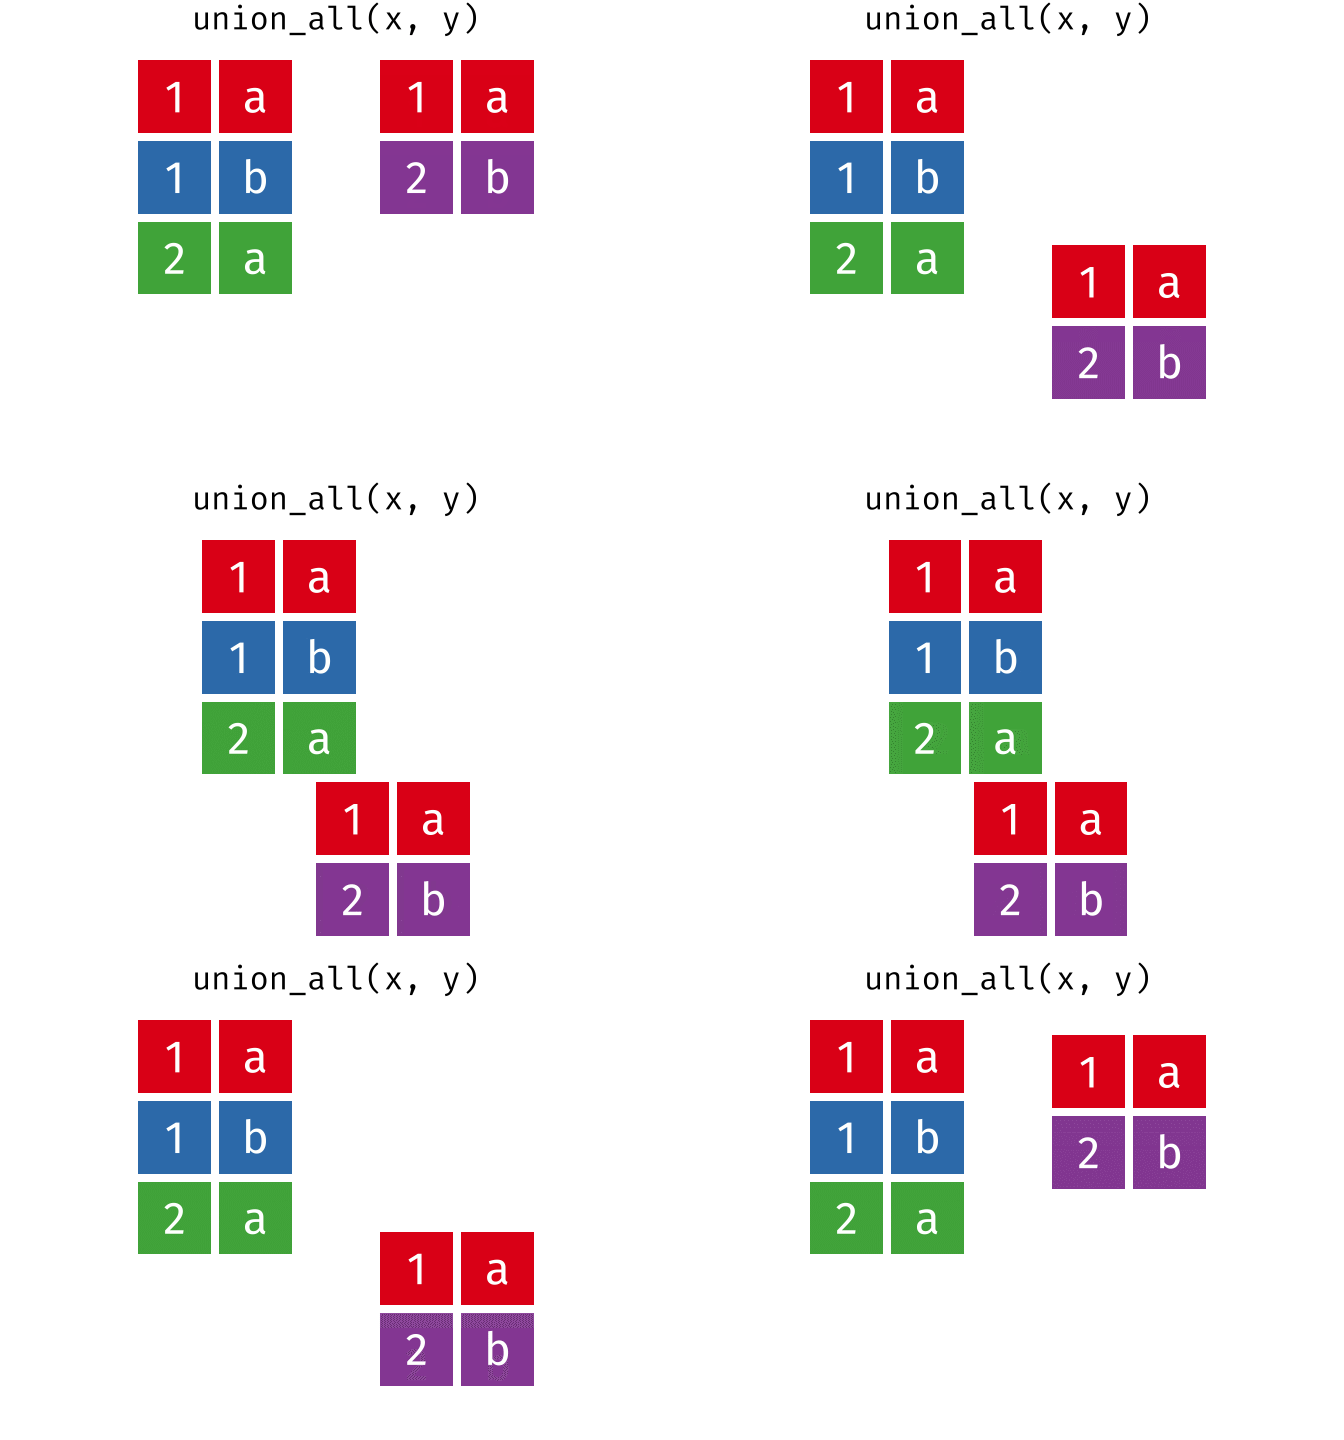
union_all(x, y)
#> # A tibble: 5 × 2
#>   x     y
#>   <chr> <chr>
#> 1 1     a
#> 2 1     b
#> 3 2     a
#> 4 1     a
#> 5 2     b
Intersection
Common rows in both
xandy, keeping just unique rows.
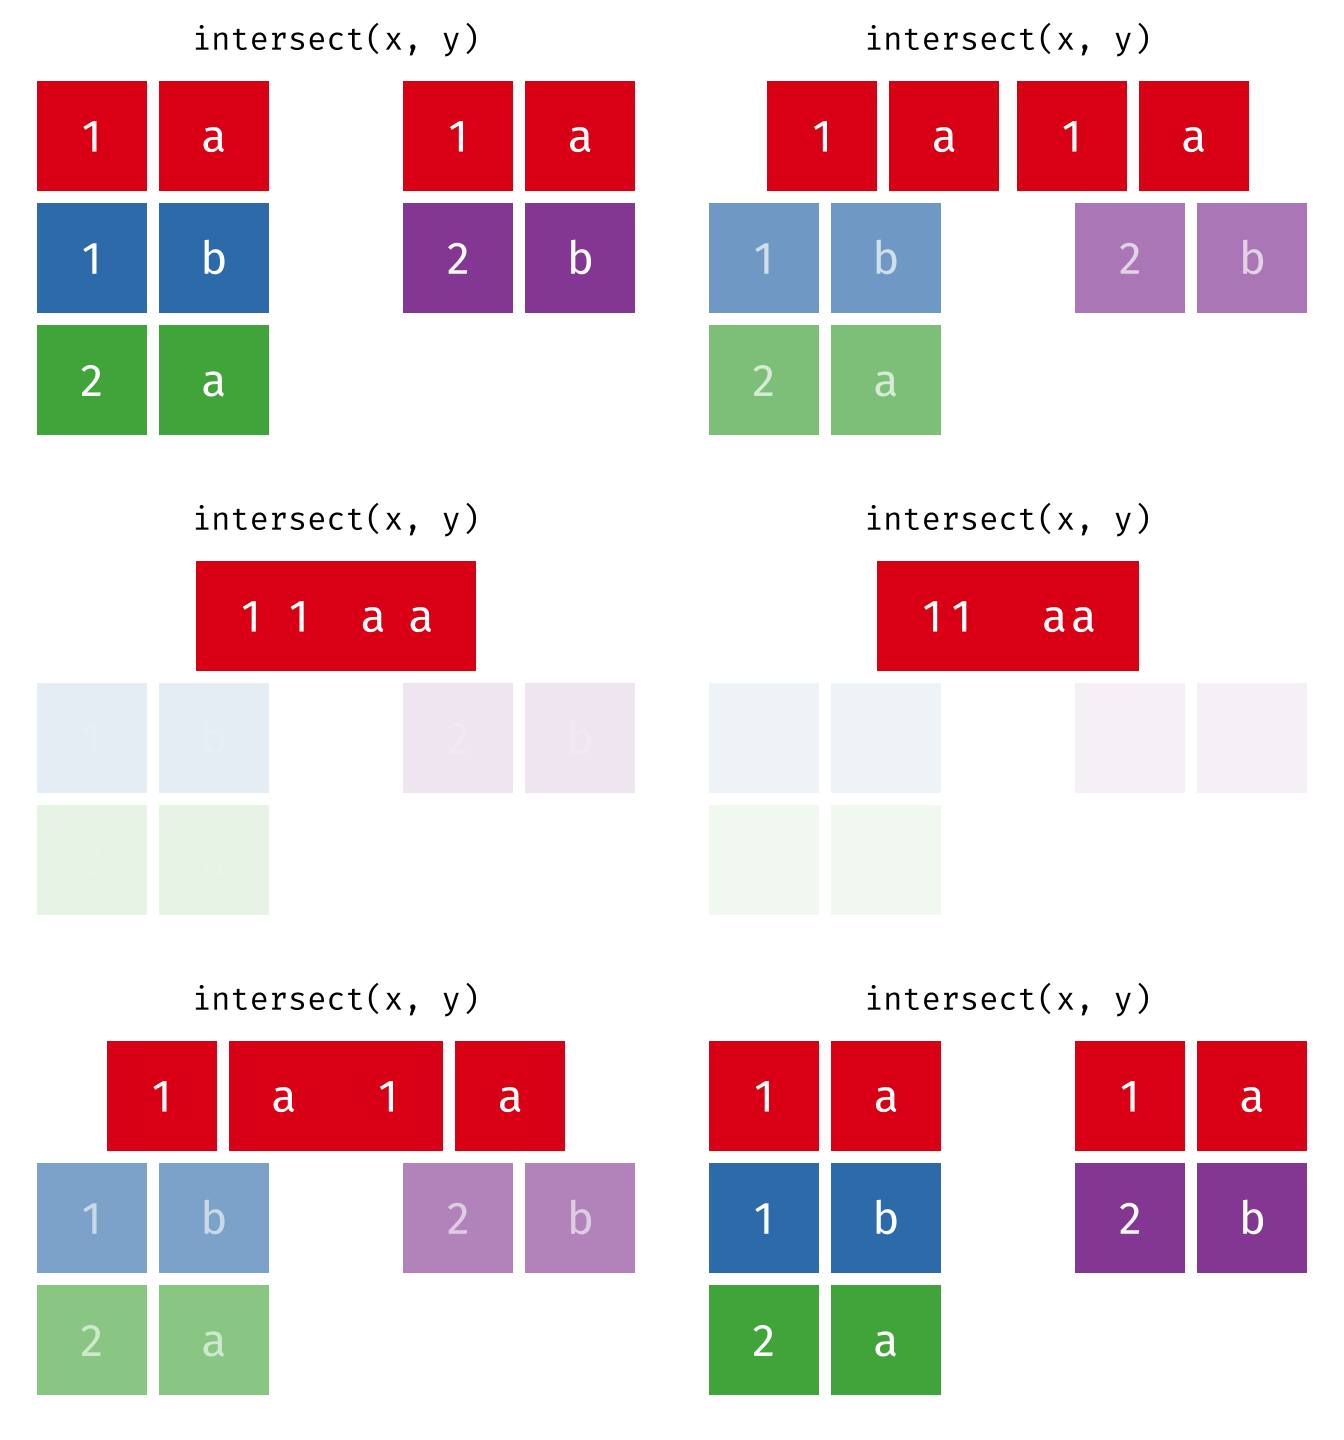
intersect(x, y)
#> # A tibble: 1 × 2
#>   x     y
#>   <chr> <chr>
#> 1 1     a
Set Difference
All rows from
xwhich are not also rows iny, keeping just unique rows.
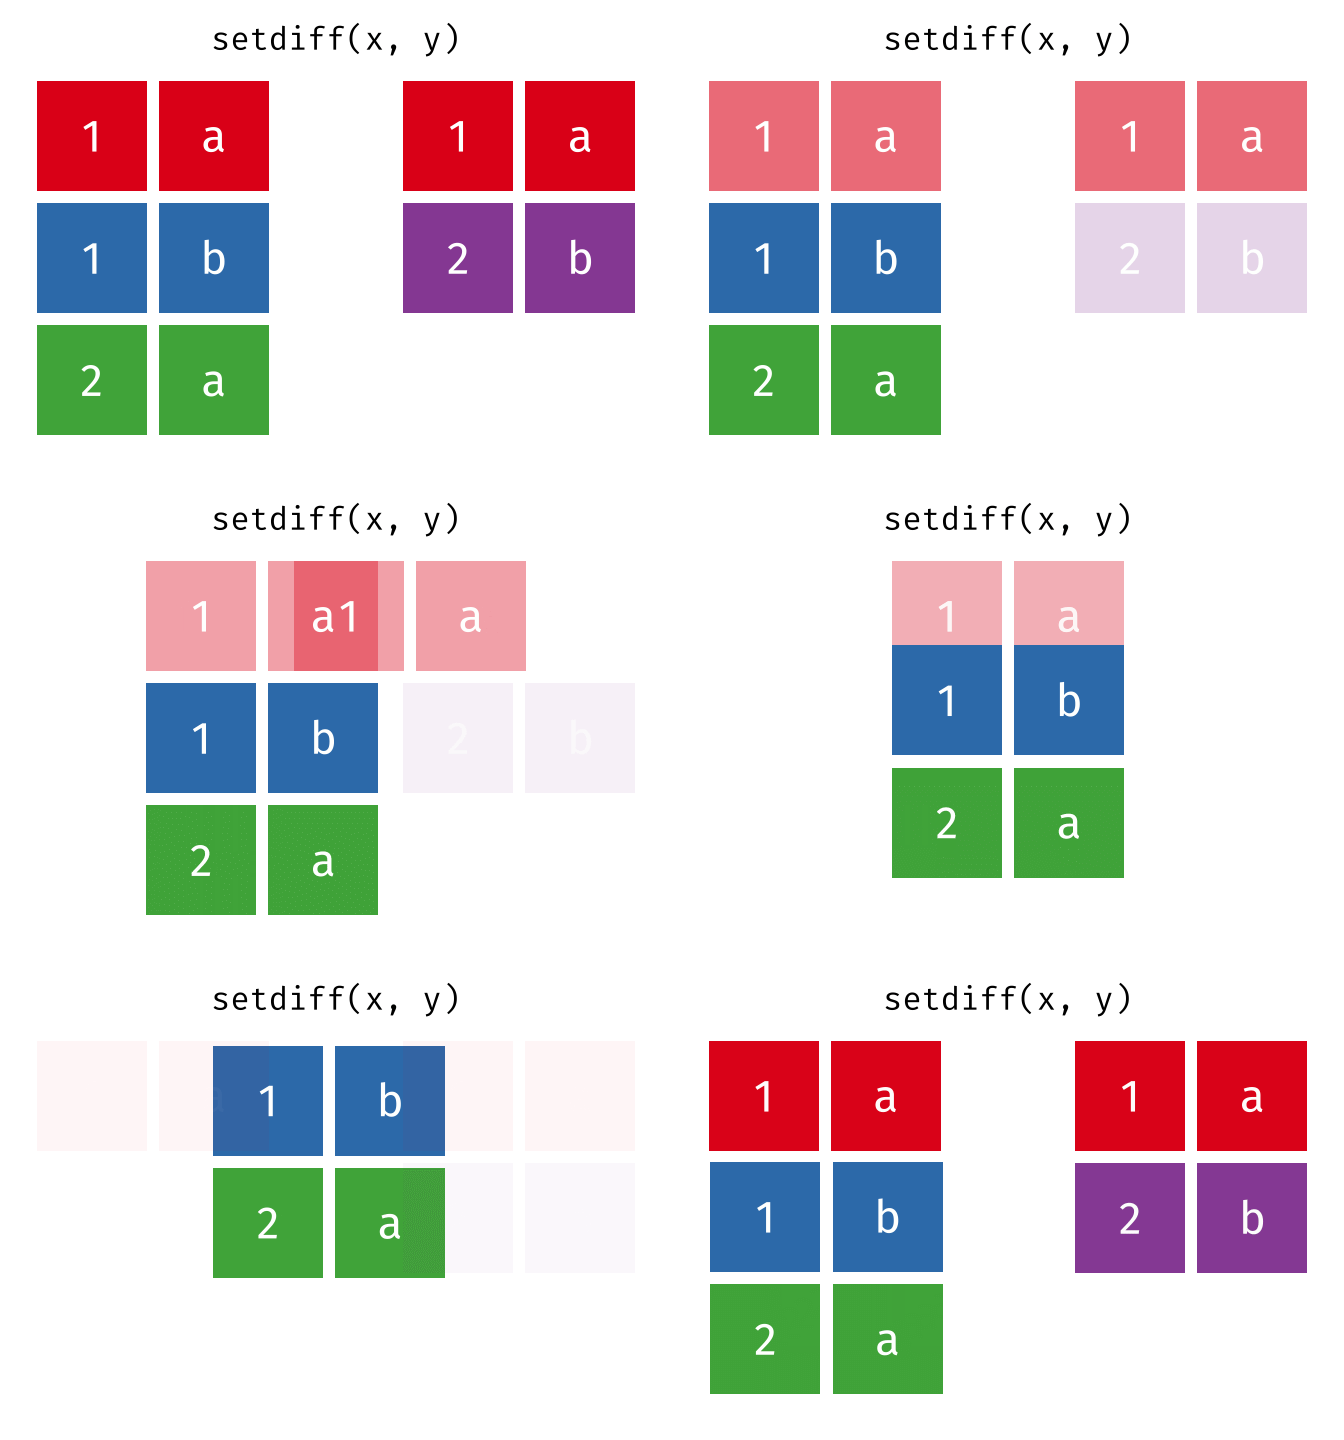
setdiff(x, y)
#> # A tibble: 2 × 2
#>   x     y
#>   <chr> <chr>
#> 1 1     b
#> 2 2     a
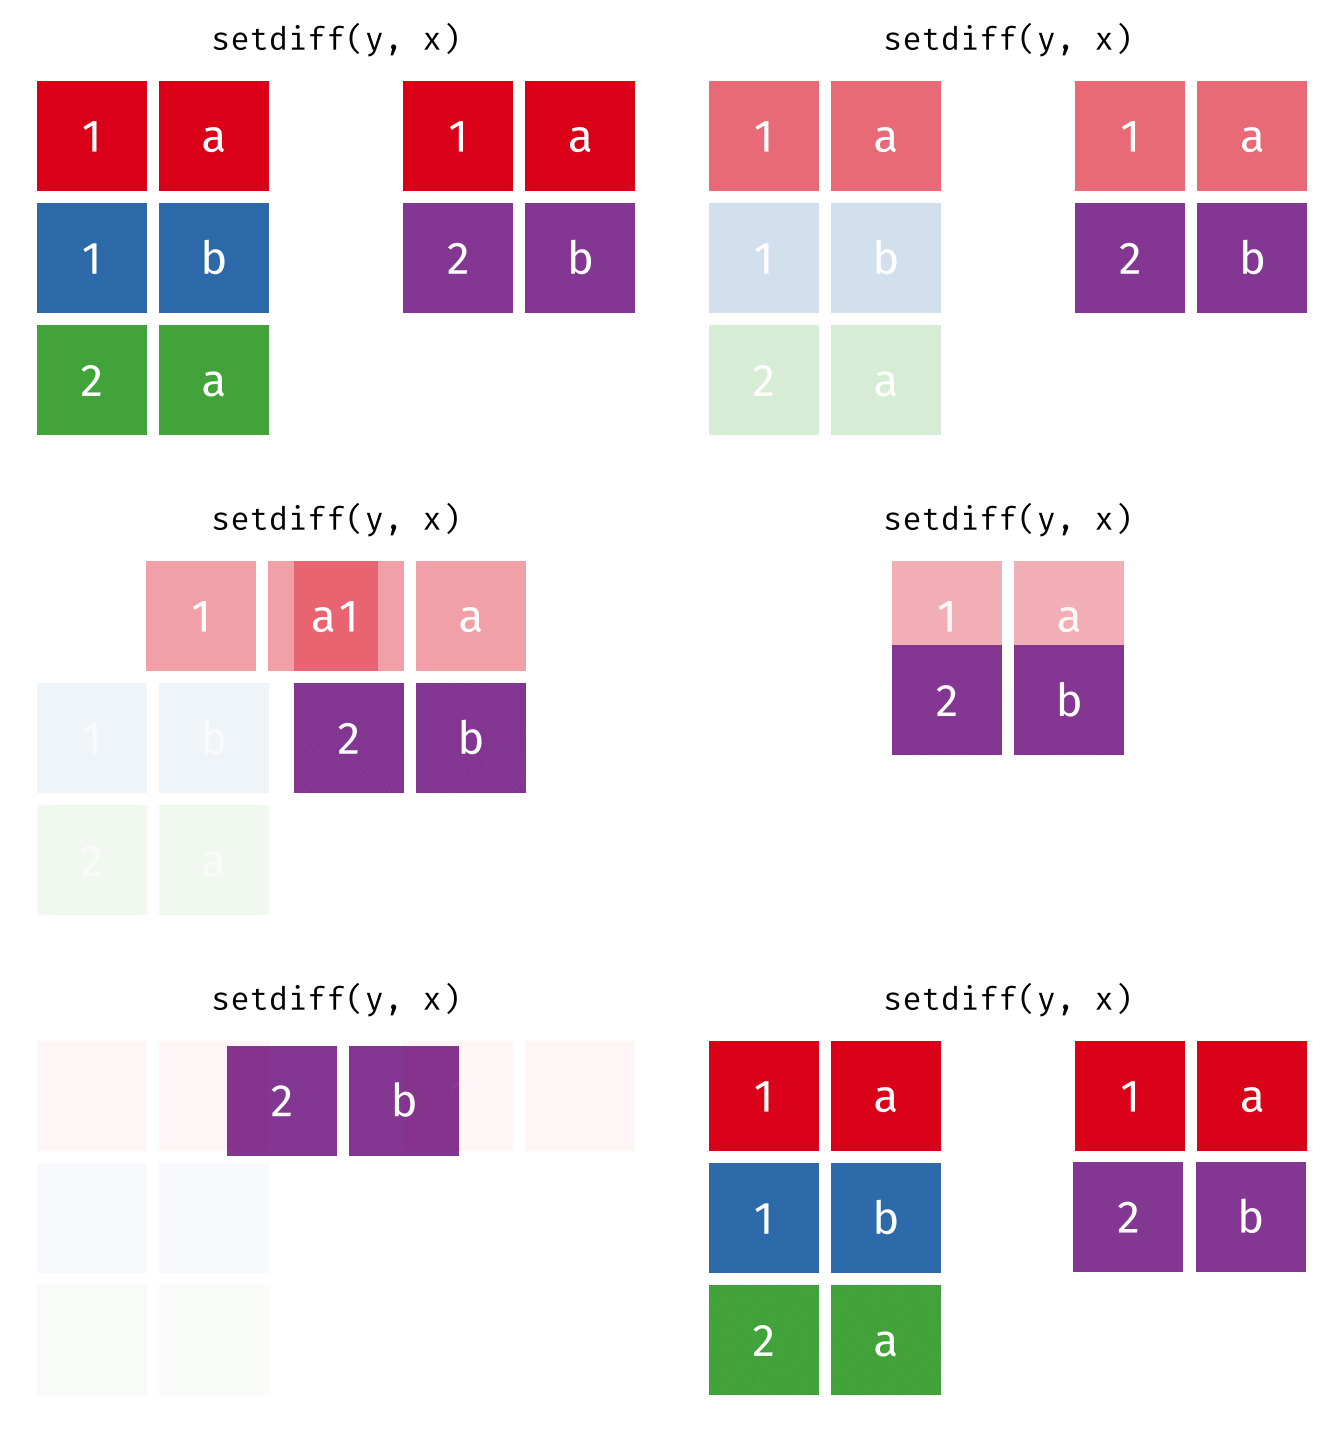
setdiff(y, x)
#> # A tibble: 1 × 2
#>   x     y
#>   <chr> <chr>
#> 1 2     b
Tidy Data
Tidy data follows the following three rules:
- Each variable has its own column.
- Each observation has its own row.
- Each value has its own cell.
Many of the tools in the tidyverse expect data to be formatted as a tidy dataset and the tidyr package provides functions to help you organize your data into tidy data.
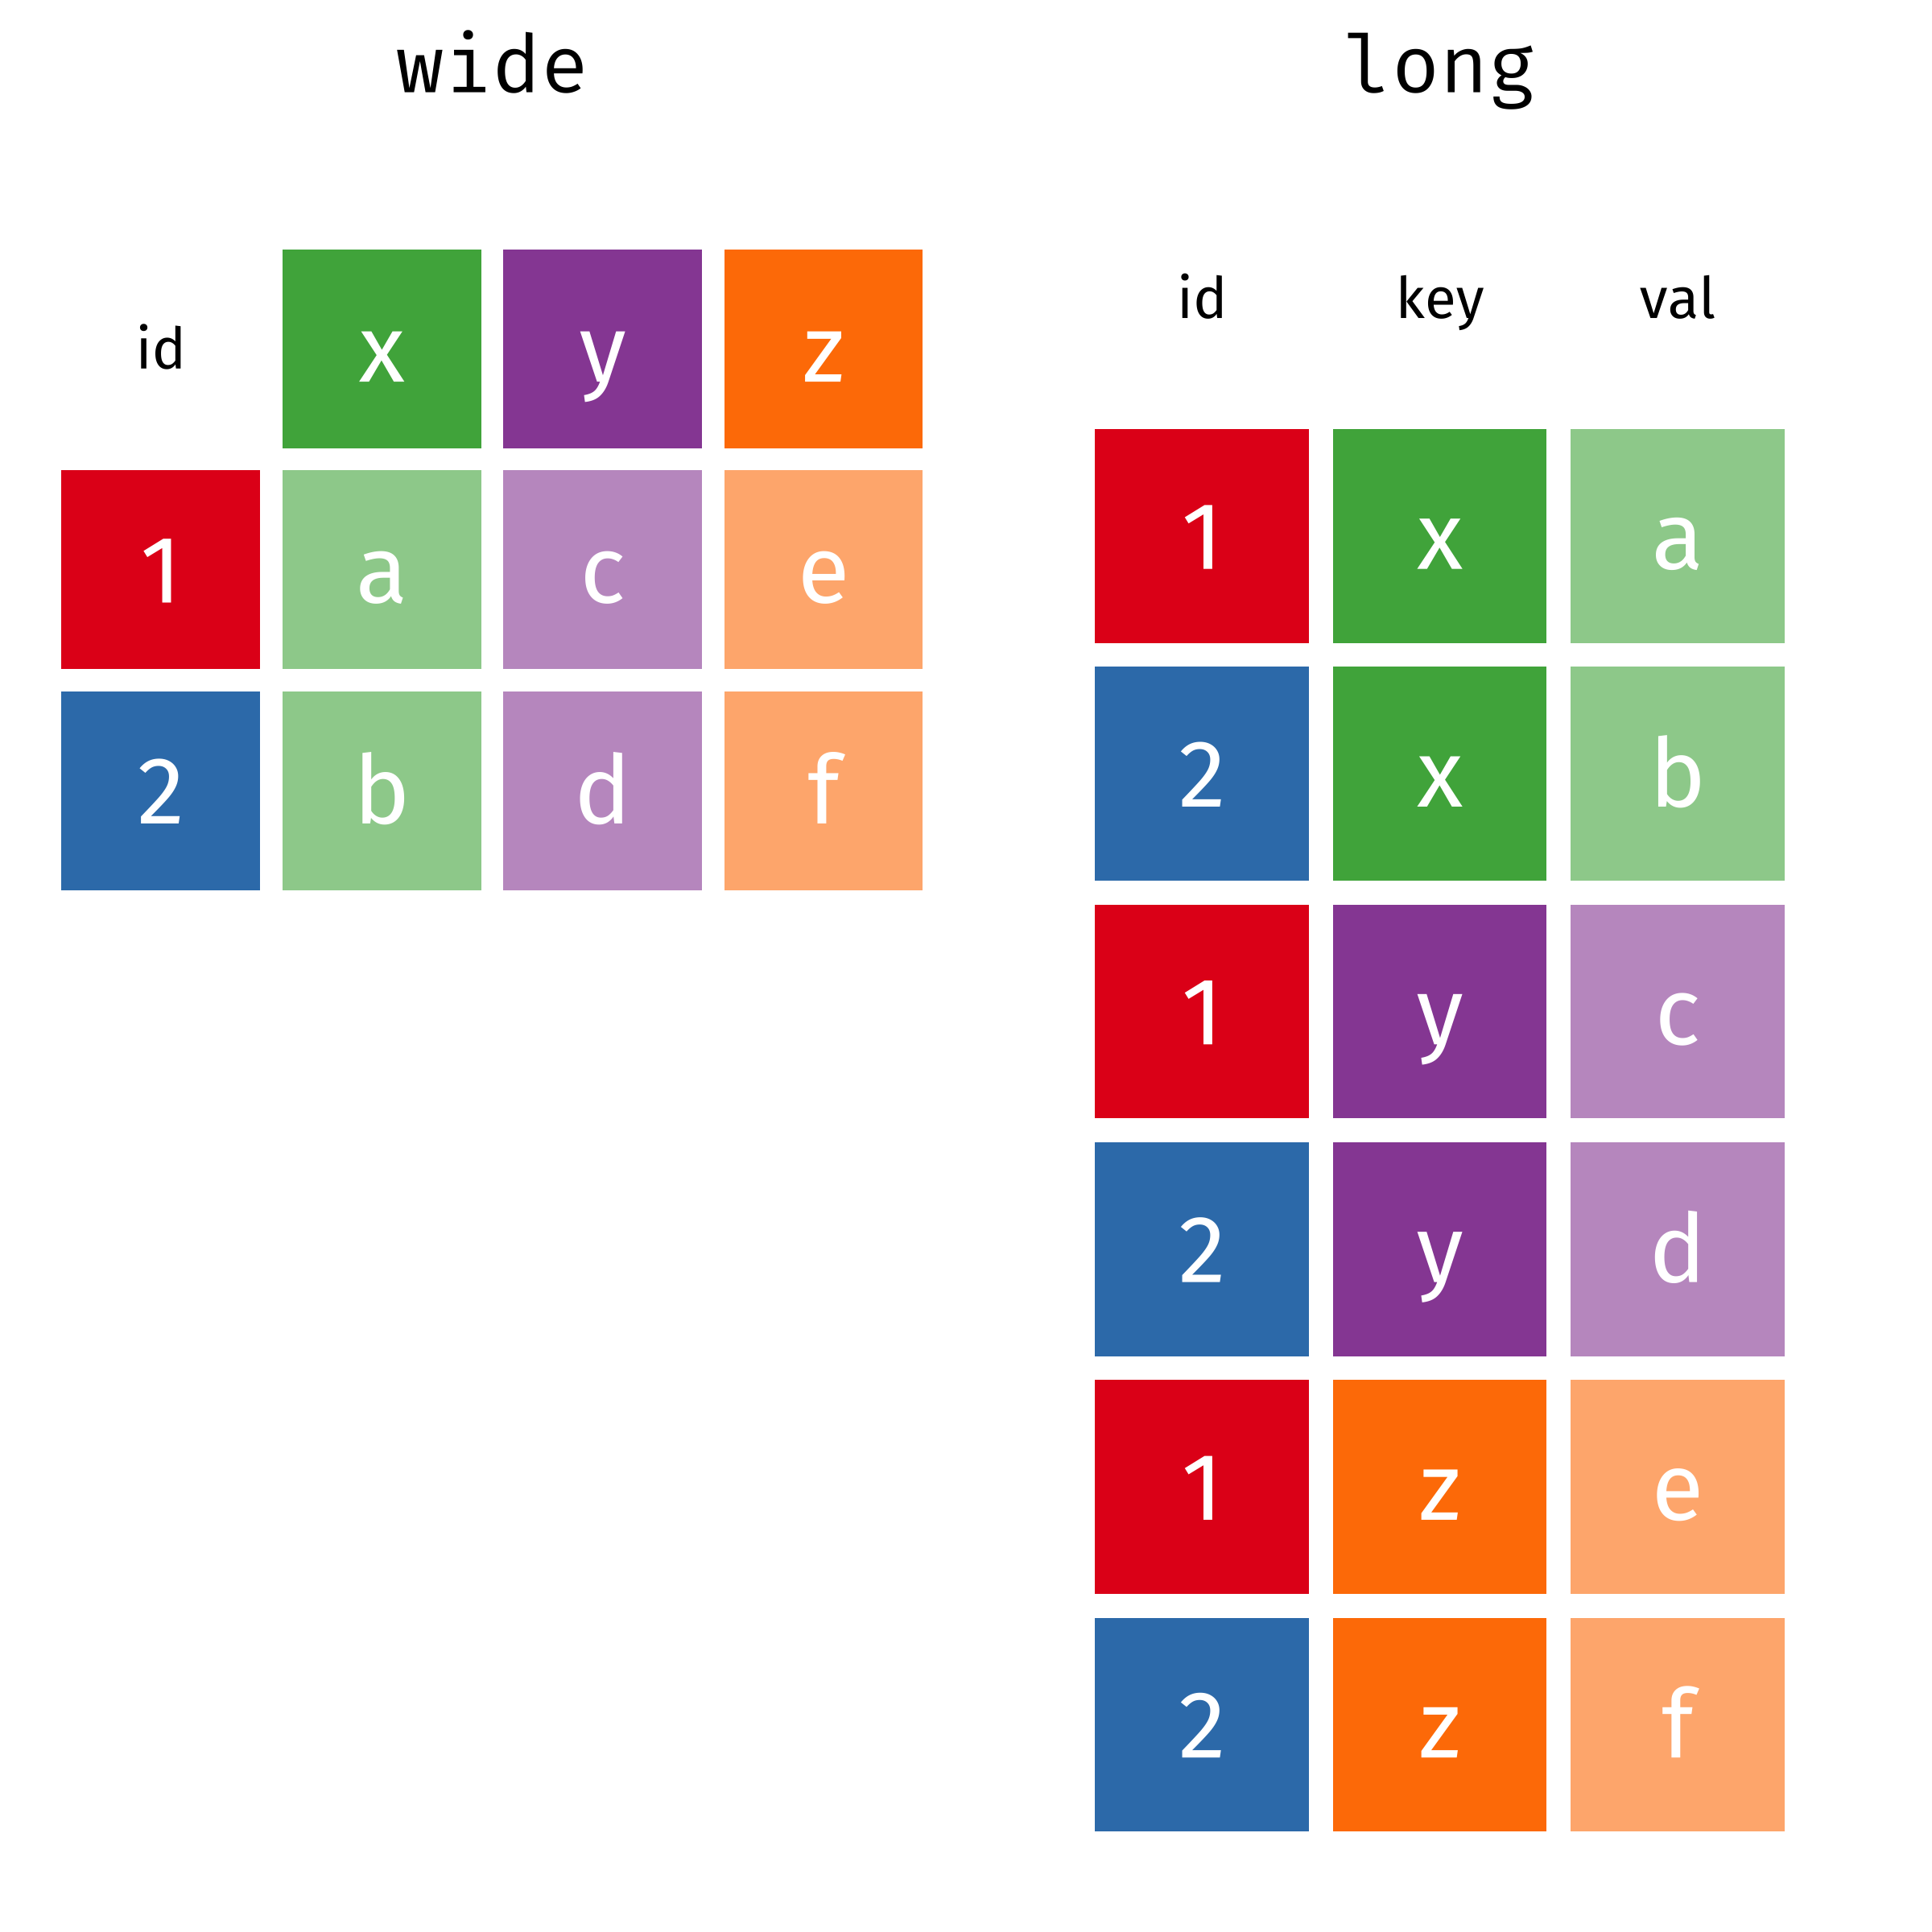
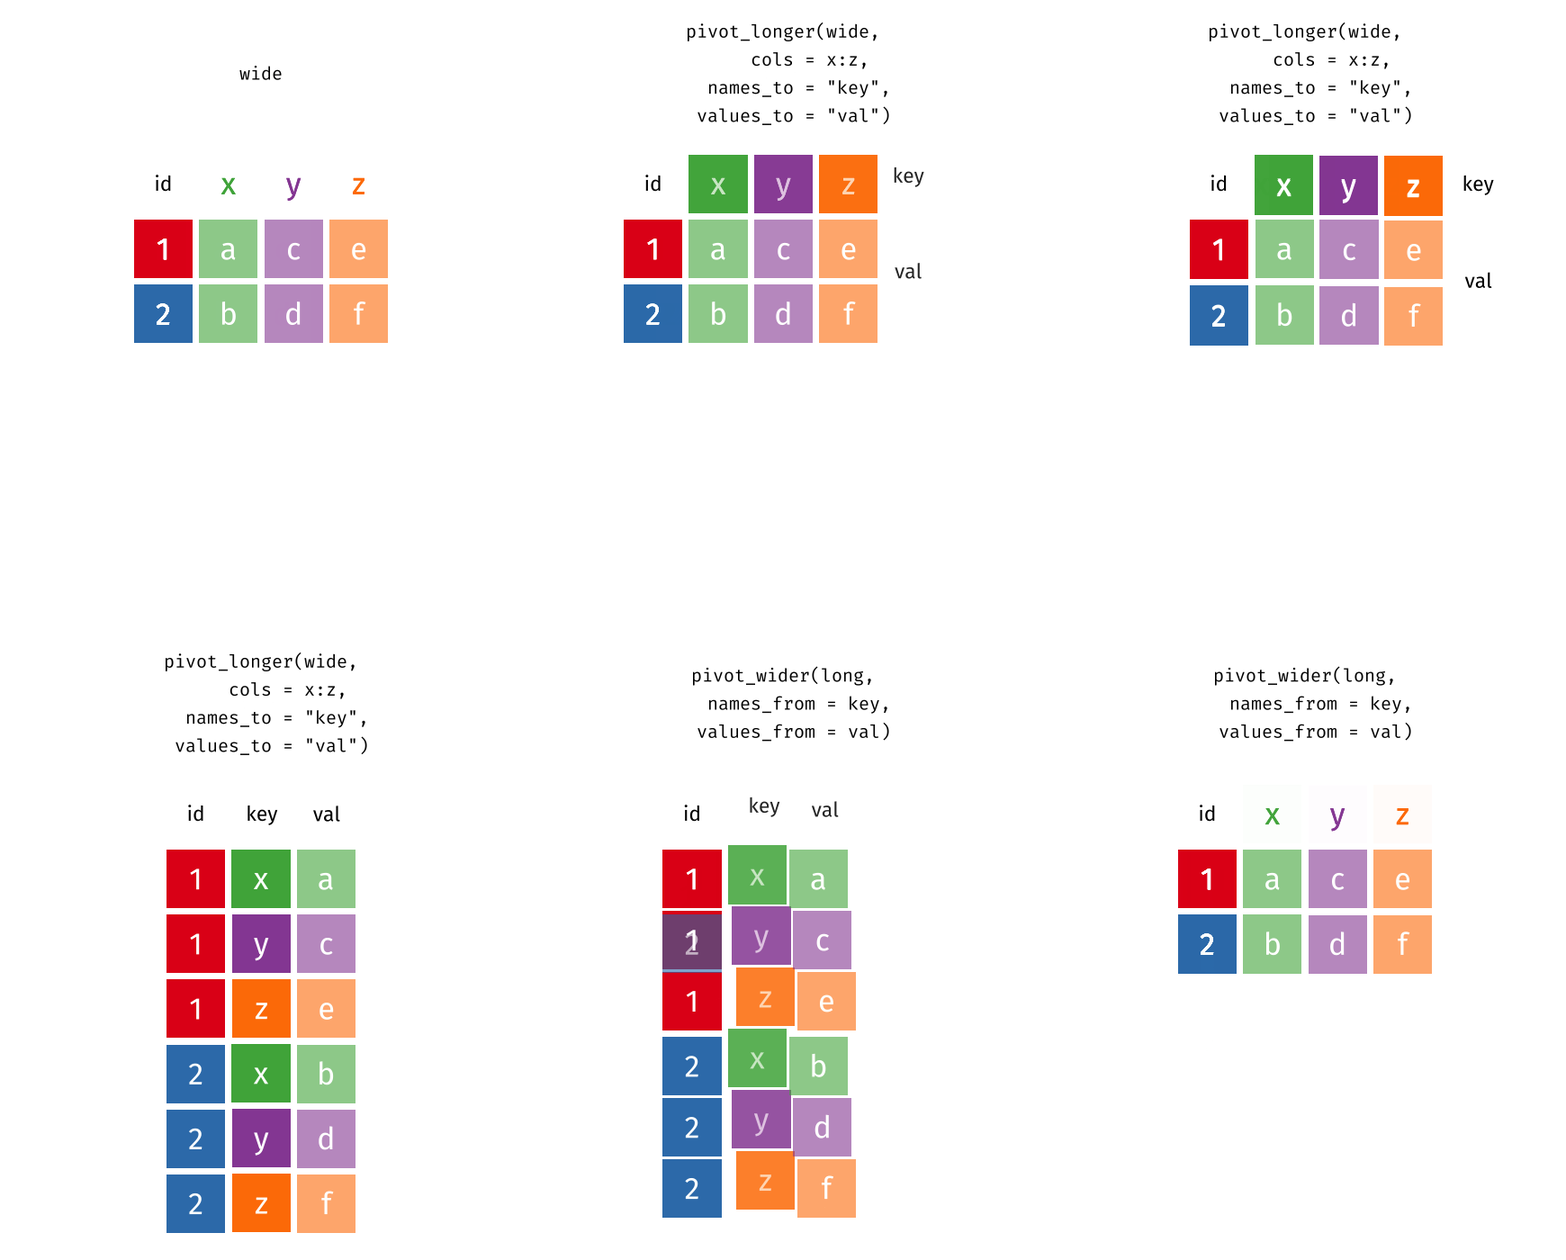
wide
#> # A tibble: 2 × 4
#>      id x     y     z
#>   <int> <chr> <chr> <chr>
#> 1     1 a     c     e
#> 2     2 b     d     f
long
#> # A tibble: 6 × 3
#>      id key   val
#>   <int> <chr> <chr>
#> 1     1 x     a
#> 2     2 x     b
#> 3     1 y     c
#> 4     2 y     d
#> 5     1 z     e
#> 6     2 z     f
Pivot Wider and Longer
pivot_wider() and pivot_longer() were introduced in tidyr version
1.0
(released in September 2019). They provide a more consistent and more
powerful approach to changing the fundamental shape of the data and are
“modern alternatives to spread() and gather().
Here we show the very basic mechanics of pivoting, but there’s much more that the pivot functions can do. You can learn more about them in the Pivoting vignette in tidyr.
pivot_wider(data, names_from = key, values_from = val)
pivot_wider()“widens” data, increasing the number of columns and decreasing the number of rows.
pivot_longer(data, cols = x:y, names_to = "key", values_to = "val")
pivot_longer()“lengthens” data, increasing the number of rows and decreasing the number of columns.
Spread and Gather
spread(data, key, value)
Spread a key-value pair across multiple columns. Use it when an a column contains observations from multiple variables.
gather(data, key = "key", value = "value", ...)
Gather takes multiple columns and collapses into key-value pairs, duplicating all other columns as needed. You use
gather()when you notice that your column names are not names of variables, but values of a variable.
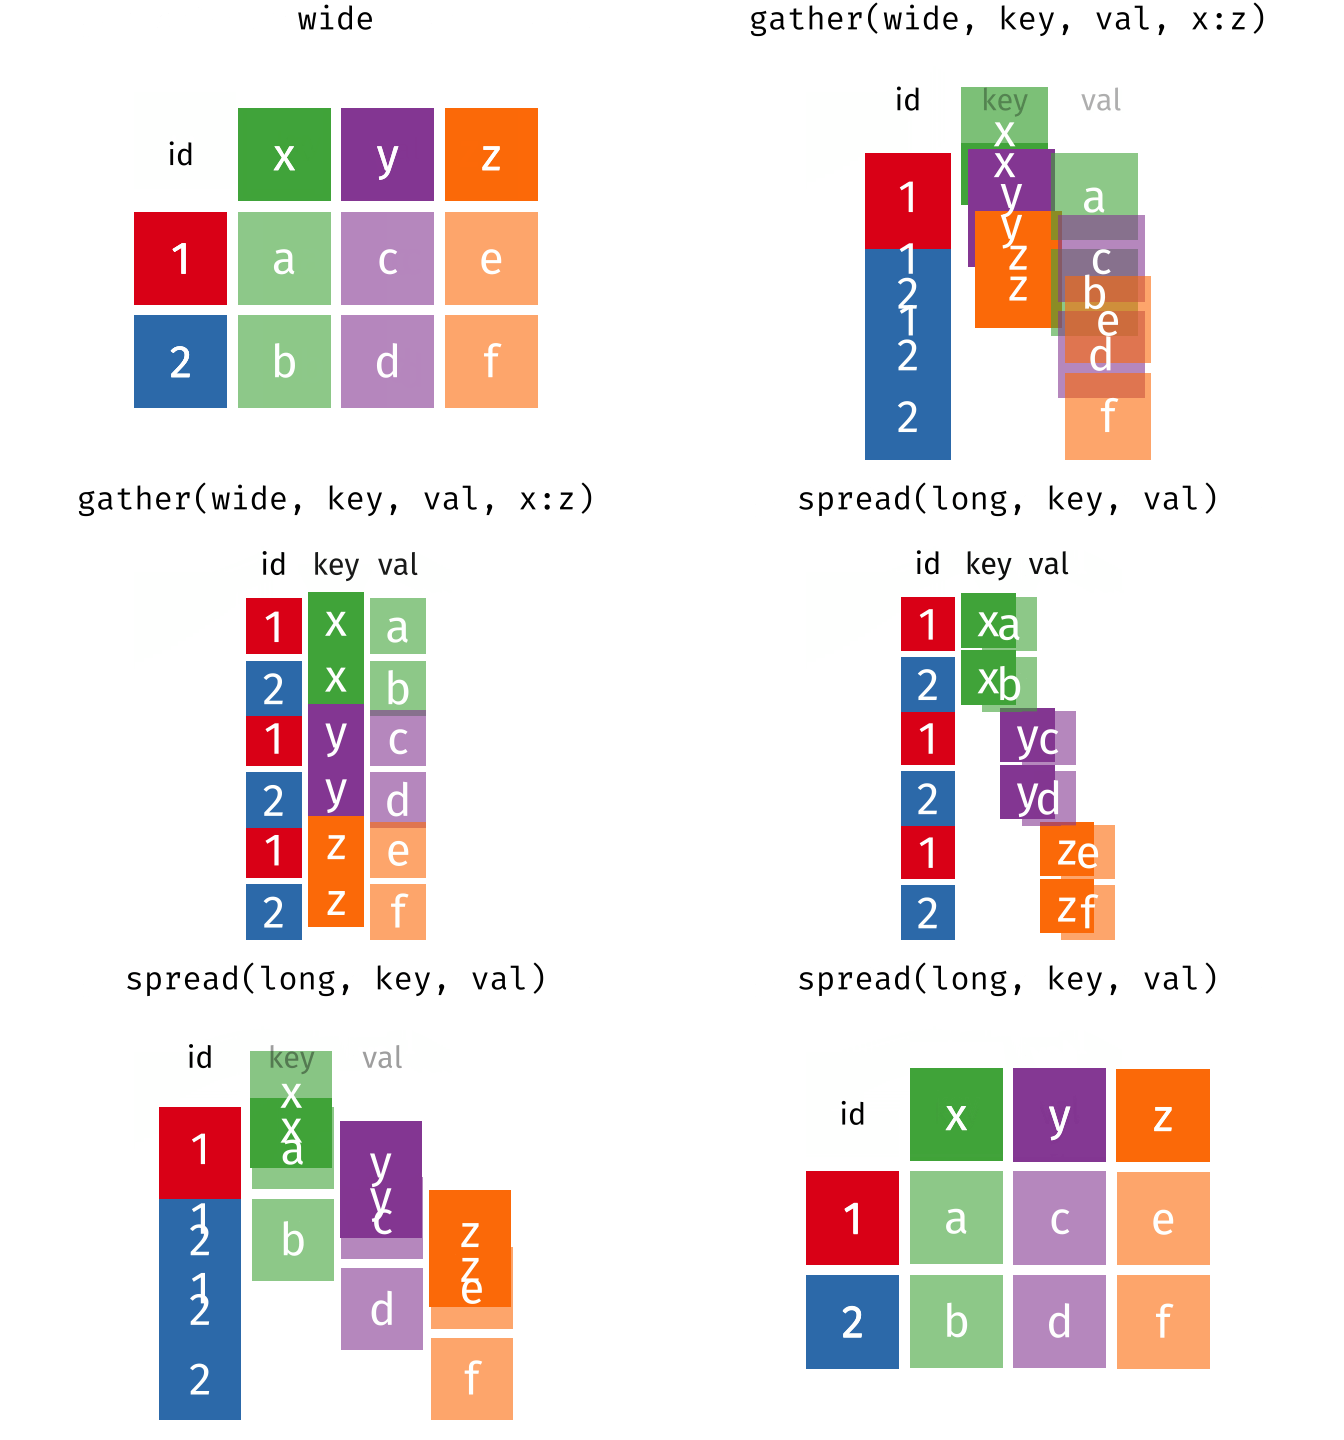
gather(wide, key, val, x:z)
#> # A tibble: 6 × 3
#>      id key   val
#>   <int> <chr> <chr>
#> 1     1 x     a
#> 2     2 x     b
#> 3     1 y     c
#> 4     2 y     d
#> 5     1 z     e
#> 6     2 z     f
spread(long, key, val)
#> # A tibble: 2 × 4
#>      id x     y     z
#>   <int> <chr> <chr> <chr>
#> 1     1 a     c     e
#> 2     2 b     d     f
探索相关项目
Asabeneh/30-Days-Of-Python
30 Days of Python 编程挑战是一份循序渐进的指南,用于在 30 天内学习 Python 编程语言。这项挑战可能需要超过 100 天。请按自己的节奏进行。这些视频或许也有帮助:https://www.youtube.com/channel/UC7PNRuno1rzYPb1xLa4yktw
78,686 星标grafana/grafana
开放且可组合的可观测性与数据可视化平台。可对来自 Prometheus、Loki、Elasticsearch、InfluxDB、Postgres 等众多数据源的指标、日志和追踪进行可视化。
77,876 星标redis/redis
对于正在构建实时数据驱动应用的开发者而言,Redis 是首选、速度最快且功能最丰富的缓存、数据结构服务器和文档与向量查询引擎。
77,489 星标apache/superset
Apache Superset 是一个数据可视化与数据探索平台
75,513 星标