
datasifaw/shopflow-dataops
datasifaw/shopflow-dataops has 87 GitHub stars and 0 forks. GitHot measured 0 stars in 24 hours and +2 in 7 days. Last checked 2026-11-12 12:29 UTC. Last push 2026-11-01.
E-commerce DataOps project with Python, SQL Server, Docker, Jenkins and Jira
可以做什么
- End-to-end pipeline from CSV to dashboard
- SQL Server transactional and dimensional modeling
- Centralized data validation
- Financial reconciliation between source and warehouse
实测星标增长
- 24小时
- 0
- 7天
- +2
- 15天
- 正在收集历史
- 1个月
- 正在收集历史
各周期内的星标净变化,周期相互重叠,并非每日新增。缺失的测量保持空白。星标代表关注度,不代表软件质量。
README.md
原文ShopFlow DataOps
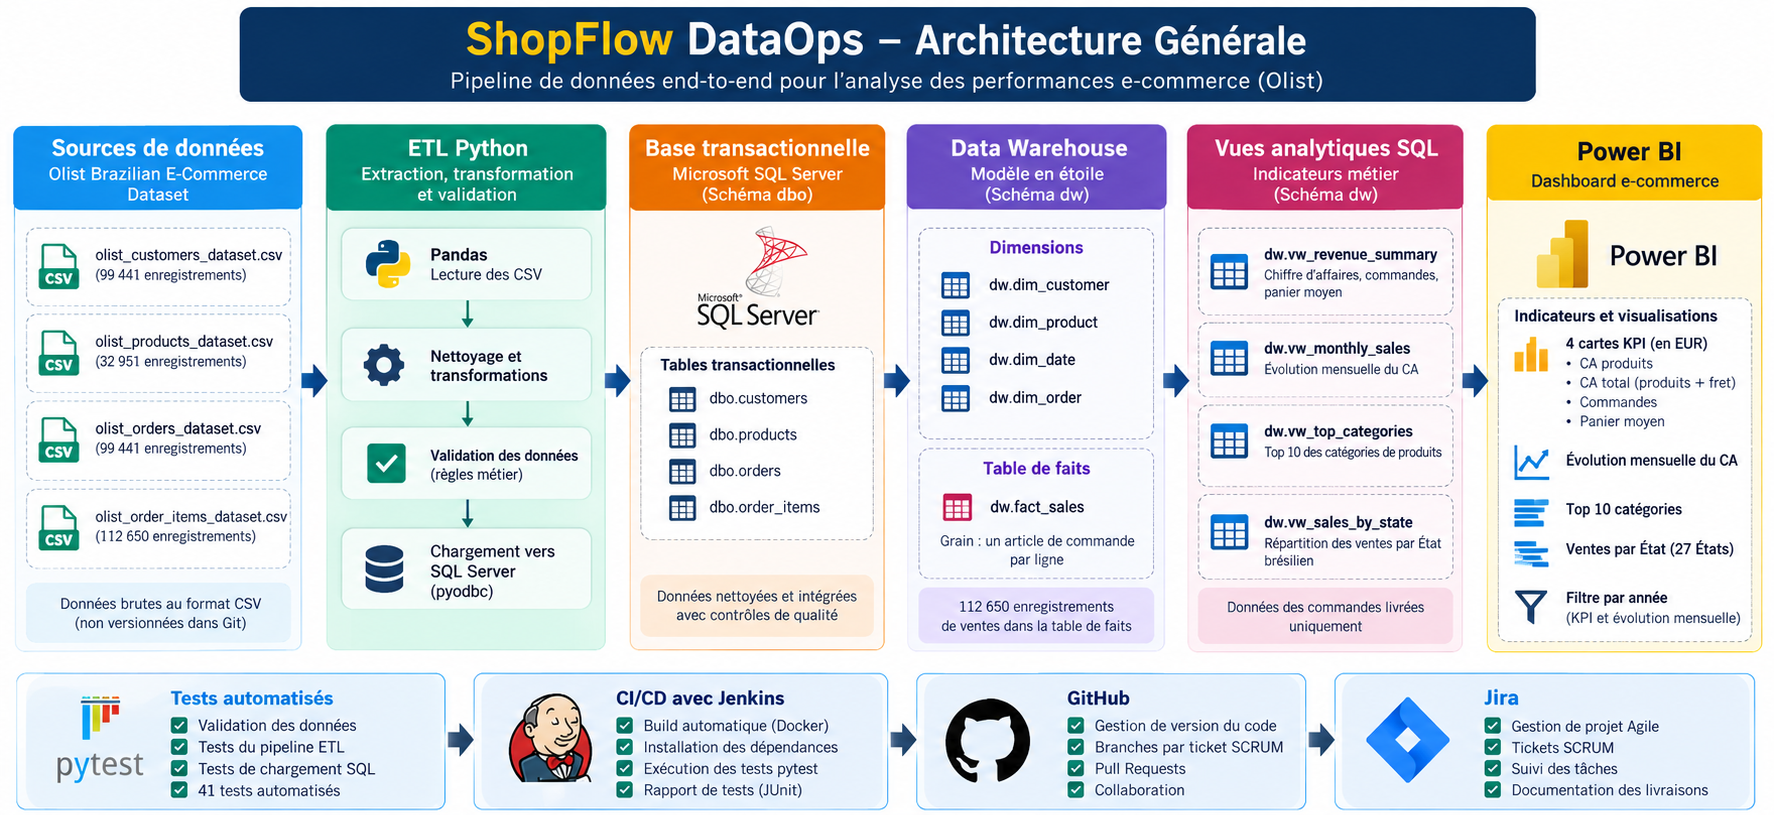
End-to-End E-commerce Data Engineering Project





Overview
ShopFlow DataOps is an end-to-end Data Engineering portfolio project built using the Brazilian E-Commerce Public Dataset by Olist.
The project covers the complete data lifecycle:
- Data extraction and validation with Python and Pandas
- ETL loading into Microsoft SQL Server
- Transactional database design and data quality controls
- Dimensional modeling with a star schema
- SQL analytics and business KPIs
- Automated testing with pytest
- Continuous Integration using Jenkins and Docker
- Interactive business reporting with Power BI
Architecture
Olist CSV Files
      |
      v
Python + Pandas
Data Validation
      |
      v
Microsoft SQL Server
dbo.customers
dbo.products
dbo.orders
dbo.order_items
      |
      v
Data Warehouse (dw)
dim_customer
dim_product
dim_date
dim_order
fact_sales
      |
      v
Analytical SQL Views
Revenue Summary
Monthly Sales
Top Categories
Sales by State
      |
      v
Power BI Dashboard
Technologies
| Technology | Purpose |
|---|---|
| Python | ETL development |
| Pandas | CSV processing and transformations |
| pyodbc | SQL Server connectivity |
| SQL Server | Data storage and dimensional warehouse |
| pytest | Automated data quality and ETL tests |
| Docker | Jenkins execution environment |
| Jenkins | Continuous Integration |
| Power BI | Business Intelligence reporting |
| GitHub | Version control and collaboration |
| Jira | Agile project management |
Dataset
Source: Olist Brazilian E-Commerce Public Dataset.
Four primary datasets are used:
| Dataset | Records |
|---|---|
| Customers | 99,441 |
| Products | 32,951 |
| Orders | 99,441 |
| Order Items | 112,650 |
Raw CSV files are excluded from Git version control.
Data Warehouse
The warehouse uses the dw schema in SQL Server.
Dimensions
dw.dim_customerdw.dim_productdw.dim_datedw.dim_order
Fact Table
dw.fact_sales
Grain: one order item per row.
The warehouse contains 112,650 sales fact records.
Reconciliation
Source and warehouse values have been reconciled:
- Product amount: BRL 13,591,643.70
- Freight amount: BRL 2,251,909.54
- Total amount: BRL 15,843,553.24
- Reconciliation difference: BRL 0.00
These figures include all order statuses.
Business Analytics
Four analytical SQL views support Power BI:
dw.vw_revenue_summarydw.vw_monthly_salesdw.vw_top_categoriesdw.vw_sales_by_state
Delivered orders only:
| KPI | Result |
|---|---|
| Delivered orders | 96,478 |
| Delivered order items | 110,197 |
| Product revenue | BRL 13,221,498.11 |
| Freight revenue | BRL 2,198,275.64 |
| Total including freight | BRL 15,419,773.75 |
Power BI Dashboard
The ShopFlow dashboard presents:
- Product revenue in EUR
- Total revenue including freight in EUR
- Delivered order count
- Average order value
- Monthly sales evolution
- Top 10 product categories
- Sales by Brazilian state
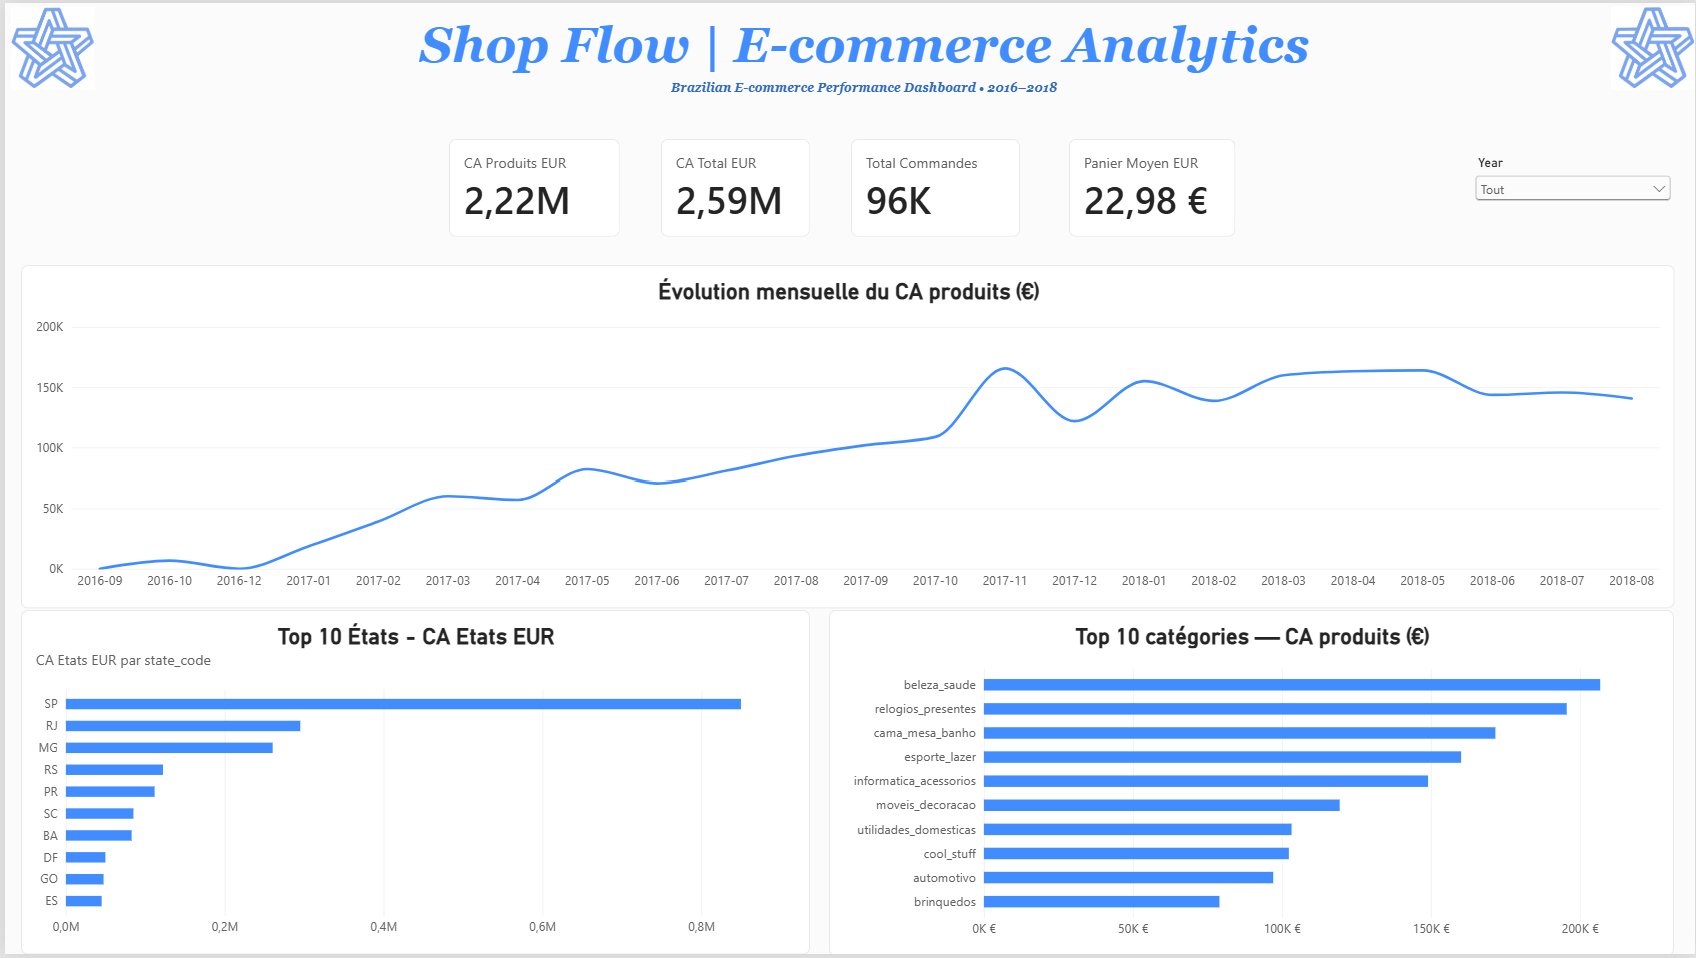
EUR conversion uses a fixed indicative rate: 1 EUR = 5.9624 BRL.
This is a demonstration rate, not a historical transaction rate.
Automated Testing
The project includes 41 pytest tests covering:
- Data validation
- CSV extraction and transformation
- SQL loader protections using mocks
- Transaction rollback and commit scenarios
Run the test suite:
python -m pytest -v
Continuous Integration
A Jenkins pipeline runs inside Docker and performs:
- Environment verification
- Python virtual environment creation
- Dependency installation
- Automated pytest execution
- JUnit test reporting
The Jenkins job monitors GitHub main using Poll SCM.
Repository Structure
shopflow-dataops/
|
|-- data/
|   |-- raw/               # Ignored source CSV files
|
|-- src/                   # ETL and validation scripts
|-- tests/                 # Automated pytest suite
|-- sql/
|   |-- analytics/         # Transactional analytics
|   |-- warehouse/         # Warehouse DDL and ETL
|       |-- analytics/     # Warehouse analytical views
|
|-- docker/
|   |-- jenkins/
|
|-- docs/
|   |-- images/
|
|-- powerbi/
|   |-- ShopFlow_Ecommerce_Analytics.pbix
|
|-- Jenkinsfile
|-- requirements.txt
|-- pytest.ini
|-- README.md
Project Highlights
- End-to-end pipeline from CSV to dashboard
- SQL Server transactional and dimensional modeling
- Centralized data validation
- Financial reconciliation between source and warehouse
- Automated CI testing with Docker and Jenkins
- Power BI reporting with EUR-converted business indicators
- Agile delivery with Jira tickets and GitHub Pull Requests
Author
Developed as a hands-on Data Engineering portfolio project.
探索相关项目
Asabeneh/30-Days-Of-Python
30 Days of Python 编程挑战是一份循序渐进的指南,用于在 30 天内学习 Python 编程语言。这项挑战可能需要超过 100 天。请按自己的节奏进行。这些视频或许也有帮助:https://www.youtube.com/channel/UC7PNRuno1rzYPb1xLa4yktw
78,618 星标grafana/grafana
开放且可组合的可观测性与数据可视化平台。可对来自 Prometheus、Loki、Elasticsearch、InfluxDB、Postgres 等众多数据源的指标、日志和追踪进行可视化。
77,859 星标redis/redis
对于正在构建实时数据驱动应用的开发者而言,Redis 是首选、速度最快且功能最丰富的缓存、数据结构服务器和文档与向量查询引擎。
77,472 星标apache/superset
Apache Superset 是一个数据可视化与数据探索平台
75,495 星标