项目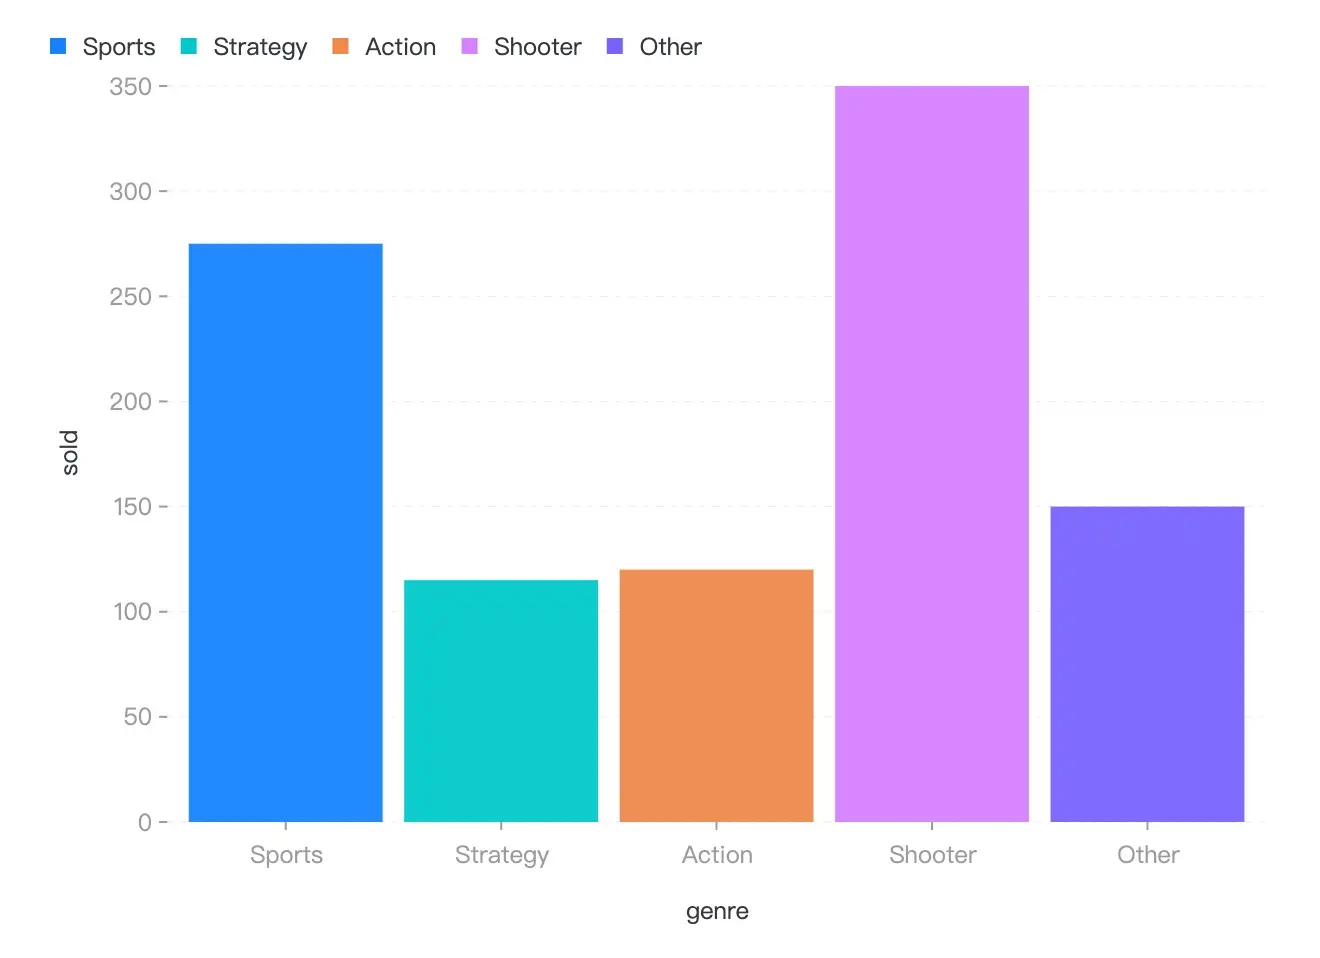


antvis/G2 has 12,655 GitHub stars and 1,662 forks. GitHot measured +1 stars in 24 hours, +3 in 7 days, and +10 in 15 days. Last checked 2026-11-09 02:18 UTC. Last push 2026-10-28.
📊 简洁的渐进式可视化语法。
可以做什么
- Progressive Usage - The main objective of G2 is to help you get meaningful visualizations quickly with concise declarations and it infers the rest. But you can configure much more for complex and advanced situations.
- Declarative API - We employs a functional declarative API to specify chart options in a programmatic fashion, which contributes to better logic reuse and more flexible code organization.
- High Extensibility - To satisfy specific needs, G2 provides a convenient and consistent mechanism to extend everything you can imagine, whether a scale, a transform, a mark, etc,. You can even customize a brand new visualization tool based on this mechanism.
- Comprehensive Grammar - G2 rejects a chart typology in favor of marks, transforms, scales, coordinates, and compositions. In addition to static visual representations, it's possible to declare data-driven animations and apply well-designed action-based interactions to plots as well.
实测星标增长
- 24小时
- +1
- 7天
- +3
- 15天
- +10
- 1个月
- 正在收集历史
各周期内的星标净变化,周期相互重叠,并非每日新增。缺失的测量保持空白。星标代表关注度,不代表软件质量。
README.zh-CN.md
原文 English | 简体中文
G2:一套简明和渐进式的可视化语法


G2 起源于 Leland Wilkinson 的图形语法:《The Grammar of Graphics》,但又不止于图形语法。
✨ 特色
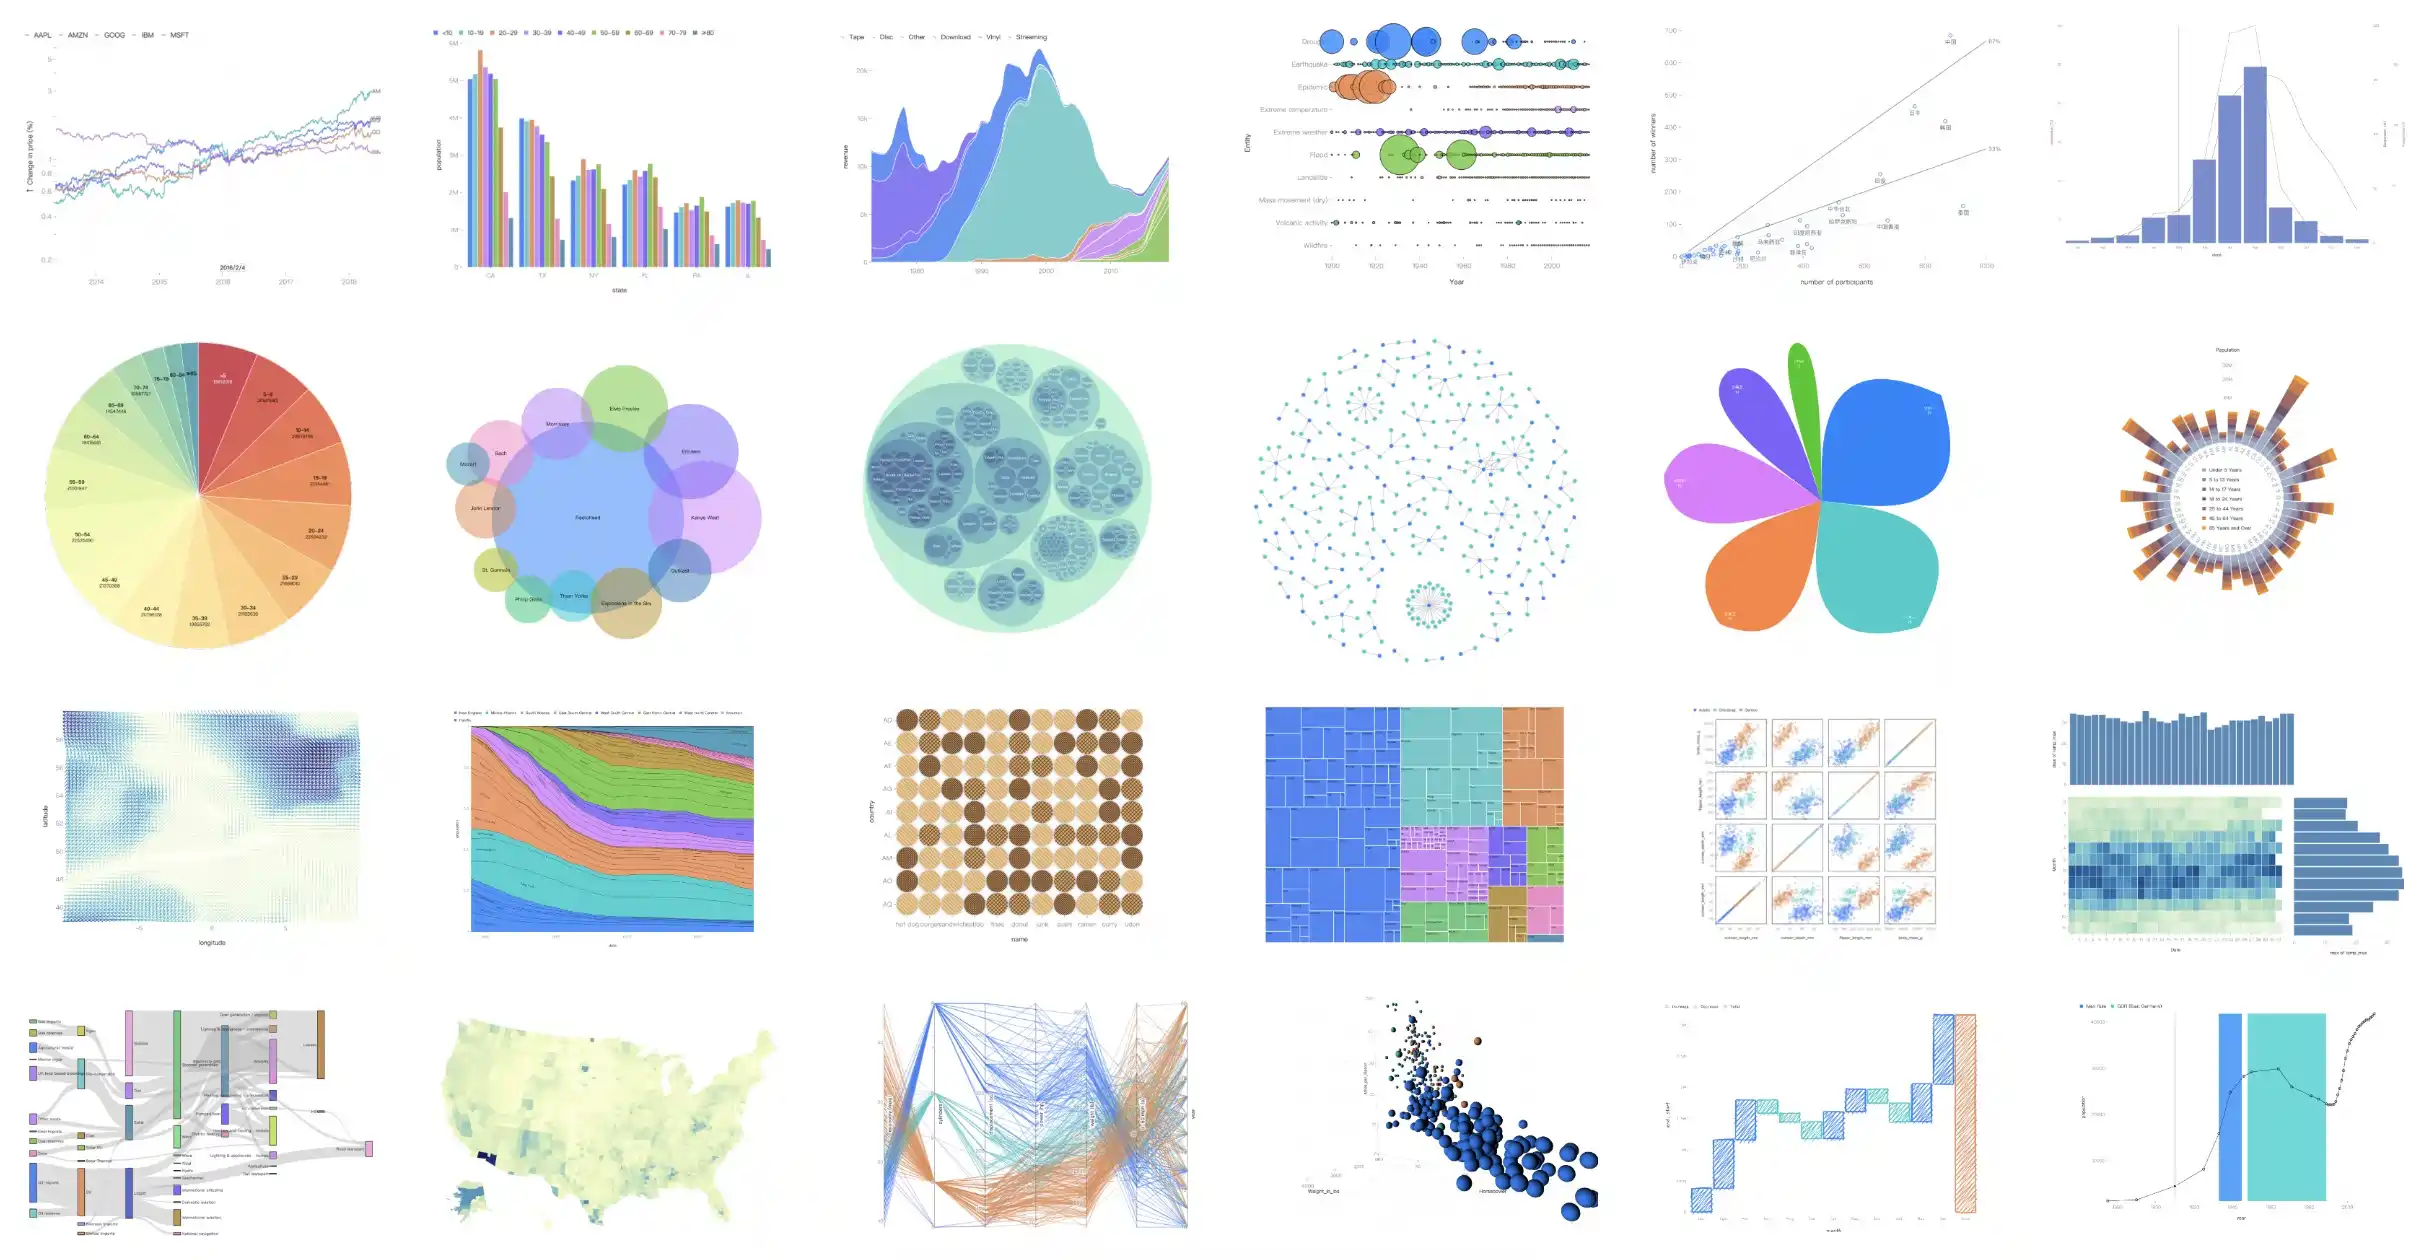
- 渐进式语法:结合工业和学术实践,实现图形语法、动画语法和交互语法。
- 丰富的标记:内置 10+ 基础标记,8+ 高阶标记。
- 高可扩展性:提供统一机制扩展所有可视化组件。
- 个性化风格:支持手绘、圆角、纹理等风格。
- 多环境渲染:支持 Canvas、SVG 以及 WebGL,和 Node.js 服务端渲染。
🔨 开始使用
可以通过 NPM 或 Yarn 等包管理器来安装。
$ npm install @antv/g2
$ yarn add @antv/g2
成功安装之后,可以通过 import 导入 Chart 对象。
<div id="container"></div>
import { Chart } from '@antv/g2';

// 准备数据
const data = [
  { genre: 'Sports', sold: 275 },
  { genre: 'Strategy', sold: 115 },
  { genre: 'Action', sold: 120 },
  { genre: 'Shooter', sold: 350 },
  { genre: 'Other', sold: 150 },
];

// 初始化图表实例
const chart = new Chart({
  container: 'container',
});

// 声明可视化
chart.options({
  // 创建一个 Interval 标记
  type: 'interval',

  // 绑定数据
  data: data,
  encode: {
    // 编码 x 通道
    x: 'genre',
    // 编码 y 通道
    y: 'sold',
    // 编码 color 通道
    color: 'genre',
  },
});

// 渲染可视化
chart.render();
如果一切顺利,你可以得到下面的柱状图!
🌍 生态
- g2-react - G2 的轻量级 React 组件,没有额外特性。
- g2-extensions - G2 的一系列插件库,包含 3D 和智能可视化等。
- ant-design-charts - React 图表库,基于 G2, G6, X6, L7Plot.
- 更多...
📮 参与贡献
感谢所有为这个项目做出贡献的人,感谢所有支持者!🙏
📄 许可证
MIT@AntV.