
Yous3ry/Python_Automated_DCA
Yous3ry/Python_Automated_DCA has 26 GitHub stars and 13 forks. GitHot measured 0 stars in 24 hours and 0 in 7 days. Last checked 2026-11-20 20:46 UTC. Last push 2026-11-11.
实测星标增长
- 24小时
- 0
- 7天
- 0
- 15天
- 正在收集历史
- 1个月
- 正在收集历史
各周期内的星标净变化,周期相互重叠,并非每日新增。缺失的测量保持空白。星标代表关注度,不代表软件质量。
关于
Python Automatic Decline Curve Analysis (DCA) For Petroleum Producing wells
数据README.md
原文Python Automatic Decline Curve Analysis (DCA) For Petroleum Producing wells
Table of Contents
About The Project
Decline Curve Analysis (DCA) is a widely accepted method for analyzing declining production rates and forecasting future performance of oil and gas wells. [1] For oil fields with hundreds or even thousands of wells updating the production forecast for each well based on DCA could be very time consuimg. Here's why:
- Typically curve fitting to estimate the decline rate and initial rate is done graphically which could be very time consuming, and
- Over the life of a conventional oil producing well, decline rates may change over time with changes in operating conditions, e.g. start of water injection, aritifical lift methodlogy or effciency changes, etc. Thus the history of the well could be divided into different distinct regions and DCA parameters should only be estimated based on the last stable producing conditions rather than average fitting of all the historical performance.
Workflow
- Connect to production database to read well data (Python File here)
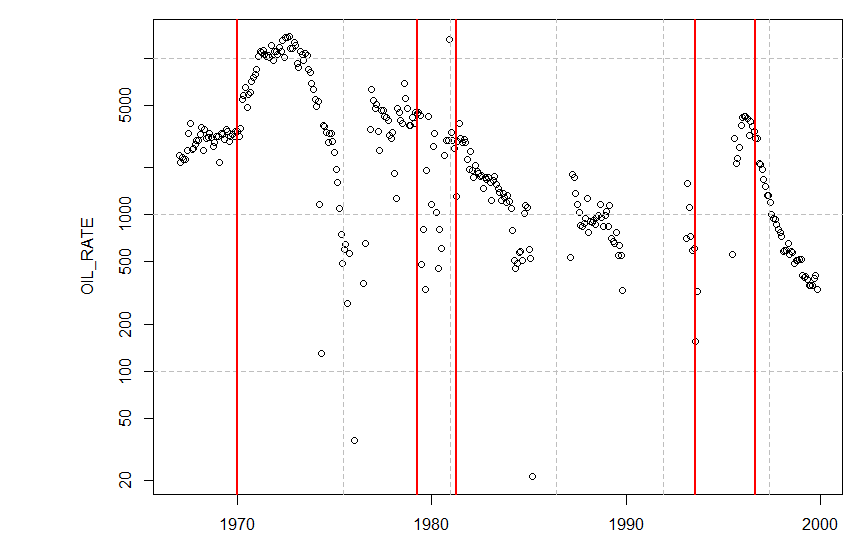
- Use R to detect change points assuming a piecewise linear trend using EnvCpt Package[2] as shown in example below (R File here)
- Finally an integrated Python file (Final Python File here) is used to a) Load Well Data b) detect change points using R via Rpy2 c) fit exponential or Hyperbolic decline based on user input on the last stable period d) Forecast production rate. Note forecast is limited by user minimum rate and forecast period.
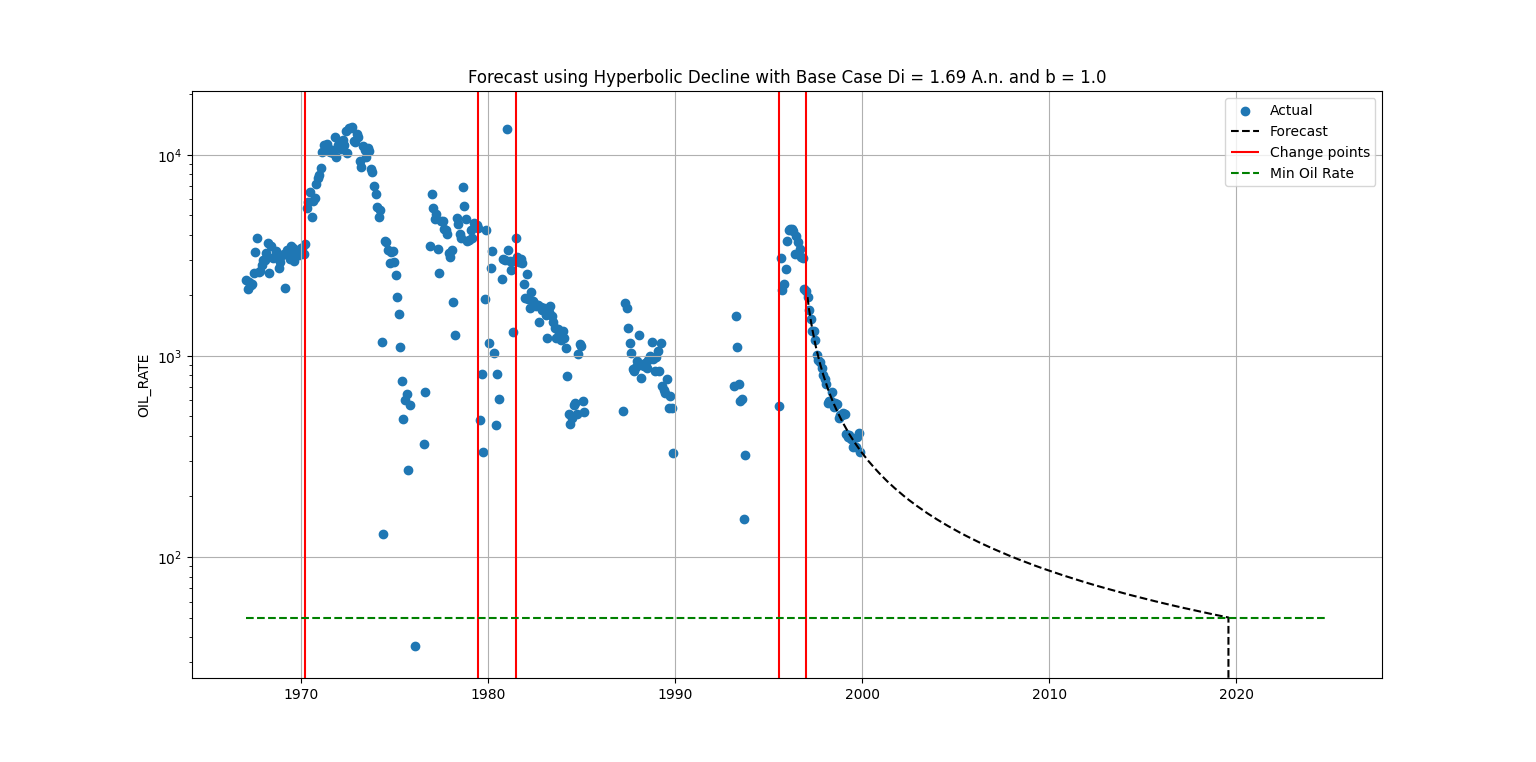
NOTE A compiled Python Script integrates all previous steps and loops through all the wells in the database and exports the total field/company forecast. (Compiled Python File here)
Dependencies
Python Packages <- sqlalchemy, scipy, matplotlib, pandas, numpy, json, rpy2
R Packages <- EnvCpt
References
[1]
https://petrowiki.spe.org/Production_forecasting_decline_curve_analysis#:~:text=Decline%20curve%20analysis%20(DCA)%20is,fluids%2C%20are%20usually%20the%20cause.
[2]
https://rdrr.io/cran/EnvCpt/man/envcpt.html