
yogeshhk/MidcurveNN
yogeshhk/MidcurveNN has 44 GitHub stars and 19 forks. GitHot measured 0 stars in 24 hours. Last checked 2026-11-10 03:08 UTC. Last push 2026-11-03.
Neural network approaches (image/GAN, graph, LLM) for computing the midcurve of 2D closed polygons, research project with 3 parallel methods.
Measured star growth
- in 24h
- 0
- in 7 days
- Collecting history
- in 15 days
- Collecting history
- in 1 month
- Collecting history
Net star changes over overlapping periods, not daily totals. Missing measurements are left blank. Stars measure attention, not software quality.
README.md
OriginalMidcurveNN
Midcurve by Neural Networks


MidcurveNN is a project aimed at solving the challenging problem of finding the midcurve of a 2D closed shape using neural networks. The primary goal is to transform a closed polygon, represented by a set of points or connected lines, into another set of points or connected lines, allowing for the possibility of open or branched polygons in the output. To run the project, follow the provided instructions in the "Instructions to Run" section.
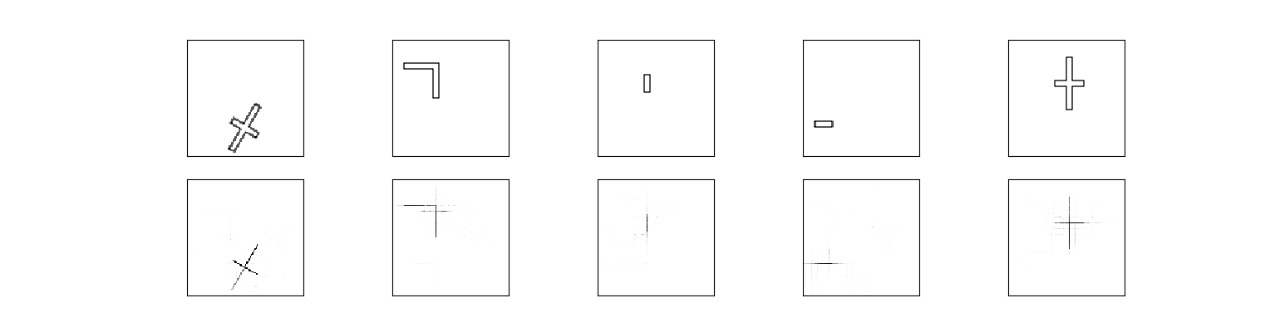
- Goal: Given a 2D closed shape (closed polygon), find its midcurve (polyline, closed or open).
- Input: Set of points or set of connected lines, non-intersecting, simple, convex, closed polygon.
- Output: Another set of points or set of connected lines, open/branched polygons possible.
If you are interested in working/contributing to this project voluntarily, do have a look at the issues
Status (November 2026): work has resumed as three independent tracks, each with its own
run.py.
Track Folder Status Results Image src/image_based/New code, dataset and tests done; experiments partial RESULTS_image.md Graph src/geometry_based/New code and tests done; reduced-budget experiments, one criterion narrowly missed RESULTS_graph.md Text/LLM src/text_based/Code and tests done; NOT RUN, no results none The live plan is
src/proposal/06_EXECUTION_PLAN.md. Numbers are kept in the RESULTS files and are not repeated here. The earlier UNet figure of 0.998 used a leaky 3-channel input (it included the distance transform, whose ridge is the midcurve) and is being re-measured with the 1-channel outline input.The August 2026 text below still applies to the legacy code. All three phases were implemented there. Everything still outstanding in Phase I (image) and Phase II (text/LLM) has been written up as GitHub issues rather than left as stale TODOs — each states what a complete fix has to include.
Phase III (geometry) is now offered as an MS/PhD research topic. Its blocker was never a bug list, it was architectural: the model learns where midcurve points belong but does not learn how they connect (adjacency cross-entropy ~1.15, indistinguishable from chance). The open questions are set prediction without known output size or node correspondence, topology as a first-class prediction target, long-range geometric reasoning across a polygon, and honest generalization from only four base shapes. See the two-page topic proposal. Students and co-supervisors are welcome to open an issue.
Caveat on all legacy numbers: every headline accuracy figure from the legacy code (including the paper and blog figures such as MAE 0.78 and PSR 98%) was measured under train/test leakage -- augmented variants of the same four base shapes were shuffled flatly across splits. They reflect interpolation, not generalization. This is documented in each phase's
analysis_report.md. The new tracks use pose and leave-one-shape-out splits; even those rest on only four real shapes.
Publications/Talks
- Vixra paper MidcurveNN: Encoder-Decoder Neural Network for Computing Midcurve of a Thin Polygon, viXra.org e-Print archive, viXra:1904.0429 http://vixra.org/abs/1904.0429
- ODSC proposal https://confengine.com/odsc-india-2019/proposal/10090/midcurvenn-encoder-decoder-neural-network-for-computing-midcurve-of-a-thin-polygon
- CAD Conference 2021, Barcelona, pages 223-225 http://www.cad-conference.net/files/CAD21/CAD21_223-225.pdf
- CAD & Applications 2022 Journal paper 19(6) http://www.cad-journal.net/files/vol_19/CAD_19(6)_2022_1154-1161.pdf
- Google Developers Dev Library https://devlibrary.withgoogle.com/products/ml/repos/yogeshhk-MidcurveNN
- Medium story Geometry, Graphs and GPT talks about using LLMs (Large Language Models) to see if geometry serialized as line-list can predict the midcurve.
- Kaggle LLM-dataset and its Ludwig fine-tuning Notebook. The Image-dataset and its Simple Encode Decoder
- ICONIEA 2024 (IIT Kharagpur) extended abstract: "Midcurve Computation using Large Language Models", presented at International Conference on Intelligent and Innovative Endeavors in Applied Research, 2024
- ICCCIT 2025: "Computing Midcurve with Multi-Layer and Convolutional Neural Networks", published in IEEE Xplore (
publications/MidcurveNN_ICCCIT2025.zip) - Medium blog Nemotron-Mini-4B for Midcurve: describes the 3-approach Nemotron pipeline (HF SFTTrainer, Unsloth, few-shot), results (PSR=85.7%, topology=0.83), and deployment on consumer hardware
- Journal paper (in preparation): "MidcurveNN: A Tri-Paradigm Neural Framework for Geometric Dimension Reduction", IEEEtran format covering all 3 phases (
publications/Midcurve_LaTeX/Main_Paper_MidcurveNN_Comprehensive.tex) - Research topic proposal (2026): "Learning the Medial Axis: Geometry-Native Neural Networks for Midcurve Extraction" — a two-page brief for prospective MS/PhD students (PDF), with a matching 12-slide LinkedIn carousel
Repository Structure
New per-track layout (each track is independent; only src/data/raw/ is shared):
src/
├── config.py  benchmark.py  run_all_tests.py  environment.yml
├── data/raw/                   # .dat/.mid, plus .edges and splits.json (shared by all)
├── utils/                      # shared legacy data prep / plotting (do not run prepare_data.py: it deletes datasets)
├── proposal/                   # plans, 06_EXECUTION_PLAN.md (live), 08_REORG_PLAN.md, RESULTS_*.md
│
├── image_based/                # Phase I   | the same template in all three approaches
├── geometry_based/             # Phase III |
└── text_based/                 # Phase II  |
    ├── README.md  TODO.md  run.py  pytest.ini  conftest.py
    ├── common/                 # shared code: prepare_data, dataset, evaluate, losses, blocks / geom / prompts ...
    ├── data/                   # approach data (image_based/data/ has image-pairs, unet-splits, images-combo)
    ├── docs/                   # analysis_report.md
    ├── tests/                  # approach-level tests
    └── methods/<method>/       # README.md; old implementation at the top level; enhanced/ = standard version + runs/
| approach | methods (folder names) |
|---|---|
image_based |
simple_encoder_decoder, dense_encoder_decoder, cnn_encoder_decoder, denoiser_encoder_decoder, unet, pix2pix (+ img2img/), skeleton |
geometry_based |
set_transformer, classical_voronoi, equi_collapse, graph_transformer (frozen negative result), finetuned_graph_transformer and gnn_encoder_decoder (retired) |
text_based |
fewshot_prompt, lmstudio_prompt, qwen_qlora, nemotron_qlora, code_t5, ludwig, manual_prompt |
Each method folder has its own README.md. Each run folder methods/<method>/[enhanced/]runs/<split>__<tag>/ holds
metrics.json, grid.png, log.csv, args.json and a git-ignored best.pt. The older per-method code (Keras scripts,
notebooks, finetuning/, nemotron3/) stays at the top of its method folder; its figures were measured under leakage.
The reorganisation of 2026-11-03 is logged in src/proposal/08_REORG_PLAN.md.
Each of image_based/, geometry_based/, and text_based/ has an analysis_report.md
documenting known bugs, design risks, and accuracy recommendations for that approach
(as of 2026-08-02, image_based/'s cataloged bugs are all fixed and test-verified,
text_based/'s code-level bugs are mostly fixed and test-verified, and
geometry_based/ is hibernated per the maintainer; a dataset-leakage/regeneration
fix shared across all three phases has been decided but not yet executed -- see
TODO.md).
One other top-level folder sits alongside src/:
publications/holds conference/journal submission archives, presentation sources, and supporting material for the papers and talks listed under Publications/Talks below, including prior related research (e.g. the author's Midsurface PhD work) and the prompt templates/research notes used while developing this project (publications/prompts/).
Instructions to Run
New workflow (per-track run.py)
The working environment is the conda env genai (the midcurvenn env from environment.yml is not
currently built; a buildable environment.yml is a planned item). Launch with conda run:
# Image track
cd src/image_based
conda run -n genai python run.py prepare
conda run -n genai python run.py train --model unet --split pose --tag h1 --epochs 30 --steps 100
conda run -n genai python run.py eval  --model unet --split pose --tag h1 --tta

# Graph track
cd src/geometry_based
conda run -n genai python run.py prepare
conda run -n genai python run.py baseline --model classical --split iid --tag t1
conda run -n genai python run.py train --model set_transformer --split iid --tag e100 --epochs 100 --threads 2

# Text track (NOT RUN, no results yet)
cd src/text_based
conda run -n genai python run.py prepare

# Tests, per track
cd src
conda run -n genai python run_all_tests.py   # one pytest process per approach
Run one heavy training job at a time. See each track's README.md and TODO.md.
Legacy workflow
Do not run utils/prepare_data.py casually: it deletes images-combo/ and unet-splits/, and the
legacy numbers it feeds are leaked.
cd src
conda env create -f environment.yml
conda activate midcurvenn

# Generate training data for all approaches
# Outputs: image_based/data/image-pairs/, unet-splits/, images-combo/, text_based/data/sequences.json
python utils/prepare_data.py

# --- Image-based (Phase I) ---
python image_based/methods/simple_encoder_decoder/main_simple_encoderdecoder.py

# Best image model (UNet)
cd image_based/methods/unet && python train.py && python test.py
# Each approach saves a results/results_grid.png (3 rows × 7 cols: Input | GT | Predicted)

# --- Geometry-based (Phase III) ---
cd geometry_based/methods/graph_transformer
python main_graph_transformer.py

# Fine-tune pretrained Graphormer (Phase III-b)
cd geometry_based/methods/finetuned_graph_transformer
pip install transformers>=4.35
python train.py

# --- Text-based / LLM (Phase II) ---
cd text_based/common/utils
python create_brep_csvs.py          # regenerate CSV dataset from base shapes

cd ../finetuning
python data_validator.py            # validate CSV data
python train.py                     # QLoRA fine-tune Qwen/Gemma/Mistral
python run_pipeline.py --full       # full pipeline in one command
python model_server.py --port 8000  # serve via FastAPI

# --- Nemotron-Mini-4B (Phase II, nemotron3) ---
cd text_based/methods/nemotron_qlora
python hf_sft_trainer.py            # Approach 1: HuggingFace SFTTrainer QLoRA
python unsloth_trainer.py           # Approach 2: Unsloth-accelerated QLoRA (PEFT fallback)
python fewshot_prompter.py          # Approach 3: few-shot base-model inference (no fine-tuning)

# --- Tests & Benchmark ---
cd src
python run_all_tests.py                                       # all 3 approach suites, one process each
cd src/image_based && python -m pytest -q   # Phase I only
cd src/geometry_based && python -m pytest -q   # Phase III only
cd src/text_based && python -m pytest -q   # Phase II only
python benchmark.py                                   # cross-approach benchmark
Thoughts
What is it?
Graph Summarization/Dimension-Reduction/Compression: Reducing a large graph to a smaller graph preserving its underlying structure, similar to text summarization, which attempts to keep the essence.
Representation Issue
- Shapes can not be modeled as sequences. Although polygon shape L may appear as sequence of points, it is not.
- All shapes can not be drawn without lifting a pencil, which is possible for sequences. Say, Shapes like Y or concentric O, cannot be modeled as sequences. So, Midcurve transformation cannot be modeled as Sequence 2 Sequence network.
- How to represent a geometric figure to feed to any Machine/Deep Learning problem, as they need numeric data in vector form?
- How to convert geometric shapes (even after restricting the domain to 2D linear profile shapes) to vectors?
- Closest data structure is graph, but thats predominantly topological and not geometrical. Meaning, graphs represent only connectivity and not spatial positions. Here, nodes would have coordinates and arcs would have curved-linear shape. So, even Graph Neural Networks, which convolute neighbors around a node and pool the output to generate vectors, are not suitable.
- Need RnD to come up with a way to generate geometric-graph embedding that will convolute at nodes (having coordinates) around arcs (having geometry, say, a set of point coordinates), then pool them to form a meaningful representation. Real crux would be how to formulate pooling to aggregate all incident curves info plus node coordinates info into a single number!!
Variable Lengths Issue
- This is a dimension-reduction problem wherein, in 2D, the input constitutes the sketch profile (parametrically 2D), while the output represents the midcurve (parametrically 1D). Input points are ordered, mostly forming a closed loop known as a manifold. Conversely, output points may lack a defined order and can exhibit branches, referred to as non-manifold structures.
- It poses a variable input and variable output challenge, given that the number of points and lines differs in the input and output.
- This presents a network 2 network problem (not Sequence to Sequence) with variable-sized inputs and outputs.
- For Encoder-Decoder networks like those in Tensorflow, fixed-length inputs are necessary. Introducing variable lengths poses a significant hurdle as padding with a distinct unused value, such as 0,0, is not feasible, considering it could represent a valid point.
- The limitation with Seq2Seq models is notable; the input polygons and output branched midcurves are not linearly connected. They may exhibit loops or branches, necessitating further consideration for a more suitable solution. (More details on limitations below)
- Instead of adopting a point list as input/output, let's consider the well-worked format of images. These images are standardized to a constant size, say 64x64 pixels. The sketch profile is represented as a color profile in a bitmap (black and white only), and similarly, the midcurve appears in the output bitmap. This image-based format allows for the application of LSTM encoder-decoder Seq2Seq models. To diversify training data, one can introduce variations by shifting, rotating, and scaling both input and output. The current focus is on 2D sketch profiles, limited to linear segments within a single, simple polygon without holes.
- The vectorization process involves representing each point as 2 floats/ints. Consequently, the total input vector for a polygon with 'm' points is 2m floats/ints. For closed polygons, the first point is repeated as the last one. The output is a vector of 2n points, repeating the last point in the case of a closed figure. Preparing training data involves using data files from MIDAS. For scalability, input and output can be scaled with different factors, and entries can be randomly shuffled. Determining the maximum number of points in a profile establishes a fixed length for both input and output.
- Resources and further exploration for Seq2Seq models can be found at Tensorflow Seq2Seq Tutorial, Seq2Seq Video Tutorial, A Neural Representation of Sketch Drawings, and Sketch RNN GitHub Repository.
- Additionally, consider incorporating plotting capabilities to visualize polygons and their midcurves, facilitating easy debugging and testing of unseen figures.
Dilution to Images
Images of geometric shapes address both, representation as well as variable-size issue. Big dilution is that, true geometric shapes are like Vector images, whereas images used here would be of Raster type. Approximation has crept in.
Even after modeling, the predicted output needs to be post-processed to bring to geometric form. Challenging again.
Thus, this project is divided into three phases:
- Phase I: Image to Image transformation learning
- Img2Img: i/o fixed size 100x100 bitmaps
- Populate many by scaling/rotating/translating both io shapes within the fixed size
- Use Encoder Decoder like Semantic Segmentation or Pix2Pix of IMages to learn dimension reduction
- Phase III: Geometry to Geometry transformation learning
- Build both, input and output polyline graphs with (x,y) coordinates as node features and edges with node id pairs mentioned. For poly-lines, edges being lines, no need to store geometric intermediate points as features, else for curves, store say, sampled fixed 'n' points.
- Build Image-Segmentation like Encoder-Decoder network, given Graph Convolution Layers from DGL in place of usual Image-based 2D convolution layer, in the usual pytorch encoder-decoder model.
- Generate variety of input-output polyline pairs, by using geometric transformations (and not image transformations as done in Phase I).
- See if Variational Graph Auto-Encoders https://github.com/dmlc/dgl/tree/master/examples/pytorch/vgae can help.
- Phase II: Using Large Language Models (LLMs)
- Phase I: Image to Image transformation learning
Phase I is fully implemented with 7 encoder-decoder variants. Four are the primary focus: Simple AE, Dense AE, CNN AE (CoordConv, stride-2 skip connections), and Denoising AE (2-stage training). UNet (2-stage, CoordConv, weighted BCE) is the strongest but an extended variant.
Phase II is implemented (
text_based/): QLoRA fine-tuning of Qwen2.5-7B was reported at MAE=0.78, PSR=98%, Hausdorff=2.1, and Nemotron-Mini-4B 2-shot at PSR=85.7%, topology accuracy=0.83. These legacy figures were measured under train/test leakage and the "best performer" claim is withdrawn until the new text track is run (status: NOT RUN). BRep JSON with explicitLines/Segmentstopology addresses the branching serialization problem.Phase III is implemented as a non-auto-regressive Graph Transformer trained from scratch (
geometry_based/methods/graph_transformer/), and a second variant fine-tunes a pretrained Graphormer HuggingFace model (geometry_based/methods/finetuned_graph_transformer/). Comprehensive evaluation is ongoing (preliminary status).
Paper: "Talk like a graph: encoding graphs for large language models" surveys graph-to-text representations. We leverage a geometry representation similar to 3D B-rep (Boundary representation), in 2D:
{
	'ShapeName': 'I',
	'Profile': [(5.0, 5.0), (10.0, 5.0), (10.0, 20.0), (5.0, 20.0)],
	'Midcurve': [(7.5, 5.0), (7.5, 20.0)],
	'Profile_brep': {
				'Points': [(5.0, 5.0), (10.0, 5.0), (10.0, 20.0),(5.0, 20.0)], # list of (x,y) coordinates
				'Lines': [[0, 1], [1, 2], [2, 3], [3, 0]], # list of point ids (ie index in the Points list)
                'Segments': [[0, 1, 2, 3]] # list of line ids (ie index in Lines list)
				},
	'Midcurve_brep': {
				'Points': [(7.5, 5.0), (7.5, 20.0)],
				'Lines': [[0, 1]],
                'Segments': [[0]]
				},
}
Column information is as below:
- ShapeName (text): name of the shape. Just for visualization/reports.
- Profile(text): List of Points coordinates (x,y) representing outer profile shape, typically closed.
- Midcurve(text): List of Points coordinates (x,y) representing inner midcurve shape, typically open.
- Profile_brep(text): Dictionary in Brep format representing outer profile shape, typically closed.
- Midcurve_brep(text): Dictionary in Brep format representing inner midcurve shape, typically open.
Each Segment is a continuous list of lines. In case of, say Midcurve-T, as there is a intersection, we can treat each line in a separate segment. In case of 'Profile O', there will be two segments, one for outer lines and another for inner lines. Each line is list of points, for now, linear. Points is list of coordinates (x,y), later can be (x,y,z).
Once we have this brep representations of both, profile and the corresponding midcurve, in the text form, then we can try various machine translation approaches or LLM based fine tuning or few-shots prompt engineering.
One major advantage of text based method over image based method is that image output still has stray pixels, cleaning which will be a complex task. But text method has exact points. It may just give odd lines, which can be removed easily.
Citations
Regarding the state of the art, the closest work related to this paper is   from   Kulkarni[28].
Kulkarni   proposed MidcurveNN, an encoder-decoder neural network to extract mid-curves from
polygonal 2D shapes. The principle is to train the network with both a pixel image of the
polygonal shape and of the final desired mid-curves. Although in an early  stage  of  research,
the  network  is  able  to  produce reasonably  well  the mid-curves  of  simple  L-shaped polygons.
The  limitations  of  this  work  remain  in  the noisiness of the produced results.
It has not been tested on a large diversity of shapes and is performed on the full shape
globally potentially requiring a high-resolution pixel grid for large models.

[28]Y.H. Kulkarni, MIDCURVENN: Encoder-decoder neural network for computing midcurve of a thin polygon,
in: Open Data Sci. Conf.,2019
Disclaimer:
Author gives no guarantee of the results of the program. It is just a fun script. Lot of improvements are still to be made. So, don’t depend on it at all. For questions or issues, please use the GitHub Issues page.
Explore related projects
tensorflow/tensorflow
An Open Source Machine Learning Framework for Everyone
201,427 starshuggingface/transformers
🤗 Transformers: the model-definition framework for state-of-the-art machine learning models in text, vision, audio, and multimodal models, for both inference and training.
168,711 starsAUTOMATIC1111/stable-diffusion-webui
Stable Diffusion web UI
165,274 starsComfy-Org/ComfyUI
The most powerful and modular diffusion model GUI, api and backend with a graph/nodes interface. The fastest local inference engine in the world.
146,024 stars