
vizzuhq/vizzu-lib
vizzuhq/vizzu-lib has 2,048 GitHub stars and 87 forks. GitHot measured +1 stars in 24 hours. Last checked 2026-11-06 02:13 UTC. Last push 2026-04-20.
Library for animated data visualizations and data stories.
Measured star growth
- in 24h
- +1
- in 7 days
- Update delayed
- in 15 days
- Update delayed
- in 1 month
- Update delayed
Net star changes over overlapping periods, not daily totals. Missing measurements are left blank. Stars measure attention, not software quality.
README.md
Original

Vizzu - Library for animated data visualizations and data stories.
Documentation · Examples · Code reference · Repository · Blog


Vizzu
About The Project
Vizzu is a free, open-source Javascript/C++ library utilizing a generic dataviz engine that generates many types of charts and seamlessly animates between them. It can be used to create static charts but more importantly, it is designed for building animated data stories and interactive explorers as Vizzu enables showing different perspectives of the data that the viewers can easily follow due to the animation.
Main features:
- Designed with animation in focus;
- Defaults based on data visualization guidelines;
- Automatic data aggregation & data filtering;
- HTML5 canvas rendering;
- Written in C++ compiled to WebAssembly;
- Dependency-free.
Installation
Install via npm:
npm install vizzu
Or use it from CDN:
<html>
 <head>
  <script type="module">
   import Vizzu from 'https://cdn.jsdelivr.net/npm/vizzu@latest/dist/vizzu.min.js';
  </script>
 </head>
</html>
Usage
Create a placeholder element that will contain the rendered chart:
<html>
 <body>
  <div id="myVizzu" style="width:800px; height:480px;">
  </div>
 </body>
</html>
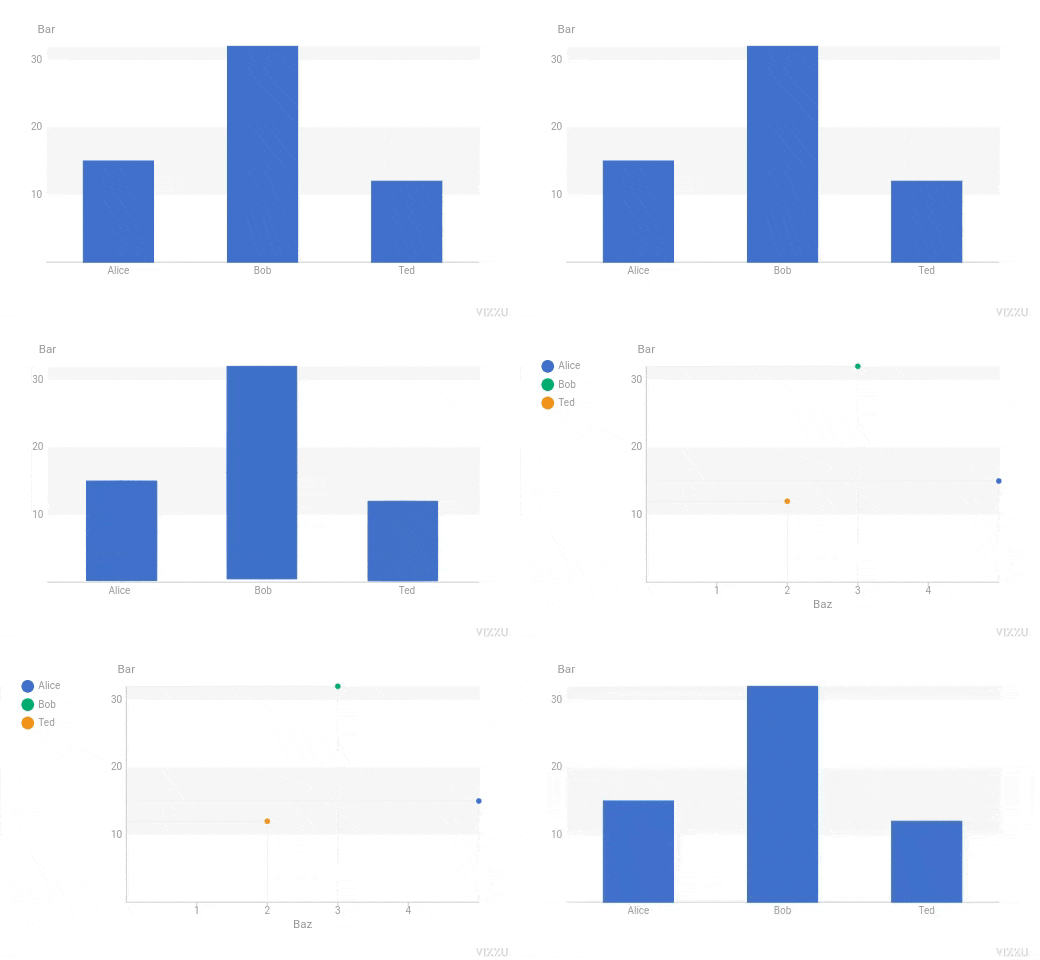
Create a simple bar chart:
import Vizzu from 'https://cdn.jsdelivr.net/npm/vizzu@latest/dist/vizzu.min.js';

let data = {
    series: [{
        name: 'Foo',
        values: ['Alice', 'Bob', 'Ted']
    }, {
        name: 'Bar',
        values: [15, 32, 12]
    }, {
        name: 'Baz',
        values: [5, 3, 2]
    }]
};

let chart = new Vizzu('myVizzu', {
    data
});
chart.animate({
    x: 'Foo',
    y: 'Bar'
});
Then turn it into a scatter plot:
chart.animate({
    color: 'Foo',
    x: 'Baz',
    geometry: 'circle'
});
FAQ
You can find answers to the most frequently asked questions about using the library in our FAQ.
Projects
List of external projects (extensions, bindings, templates, etc) for Vizzu: Projects.
Roadmap
We have a comprehensive list of features we plan to implement, on our Roadmap.
Contributing
We welcome contributions to the project, visit our contributing guide for further info.
Contact
Join our Slack: vizzu-community.slack.com
Drop us a line at [email protected]
Follow us on Twitter: https://twitter.com/VizzuHQ
License
Copyright © 2021-2025 Vizzu Inc.
Released under the Apache 2.0 License.
Explore related projects
ytdl-org/youtube-dl
Command-line program to download videos from YouTube.com and other video sites
141,474 starsexcalidraw/excalidraw
Virtual whiteboard for sketching hand-drawn like diagrams
135,243 starsgodotengine/godot
Godot Engine – Multi-platform 2D and 3D game engine
119,656 starsmrdoob/three.js
JavaScript 3D Library.
117,669 stars