
visjs/vis-graph3d
visjs/vis-graph3d has 356 GitHub stars and 45 forks. GitHot measured 0 stars in 24 hours and 0 in 7 days. Last checked 2026-11-09 07:29 UTC. Last push 2026-11-01.
📊 Create interactive, animated 3d graphs. Surfaces, lines, dots and block styling out of the box.
Measured star growth
- in 24h
- 0
- in 7 days
- 0
- in 15 days
- Update delayed
- in 1 month
- Update delayed
Net star changes over overlapping periods, not daily totals. Missing measurements are left blank. Stars measure attention, not software quality.
README.md
Originalvis-graph3d
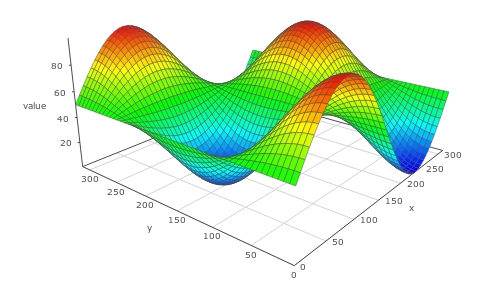
Graph3d is an interactive visualization chart to draw data in a three dimensional graph. You can freely move and zoom in the graph by dragging and scrolling in the window. Graph3d also supports animation of a graph.
Graph3d uses HTML canvas to render graphs, and can render up to a few thousands of data points smoothly.
Badges


Install
Install via npm:
$ npm install vis-graph3d
Example
A basic example on loading a Timeline is shown below. More examples can be found in the examples directory of the project.
<!DOCTYPE html>
<html>
  <head>
    <title>Graph 3D demo</title>
    <script
      type="text/javascript"
      src="https://unpkg.com/vis-graph3d@latest/dist/vis-graph3d.min.js"
    ></script>
    <script type="text/javascript">
      var data = null;
      var graph = null;

      function custom(x, y) {
        return Math.sin(x / 50) * Math.cos(y / 50) * 50 + 50;
      }

      // Called when the Visualization API is loaded.
      function drawVisualization() {
        // Create and populate a data table.
        data = new vis.DataSet();
        // create some nice looking data with sin/cos
        var counter = 0;
        var steps = 50; // number of datapoints will be steps*steps
        var axisMax = 314;
        var axisStep = axisMax / steps;
        for (var x = 0; x < axisMax; x += axisStep) {
          for (var y = 0; y < axisMax; y += axisStep) {
            var value = custom(x, y);
            data.add({ id: counter++, x: x, y: y, z: value, style: value });
          }
        }

        // specify options
        var options = {
          width: "600px",
          height: "600px",
          style: "surface",
          showPerspective: true,
          showGrid: true,
          showShadow: false,
          keepAspectRatio: true,
          verticalRatio: 0.5,
        };

        // Instantiate our graph object.
        var container = document.getElementById("mygraph");
        graph = new vis.Graph3d(container, data, options);
      }
    </script>
  </head>
  <body onload="drawVisualization();">
    <div id="mygraph"></div>
  </body>
</html>
Build
To build the library from source, clone the project from github
$ git clone git://github.com/visjs/vis-graph3d.git
The source code uses the module style of node (require and module.exports) to
organize dependencies. To install all dependencies and build the library,
run npm install in the root of the project.
$ cd vis-graph3d
$ npm install
Then, the project can be build running:
$ npm run build
Test
To test the library, install the project dependencies once:
$ npm install
Then run the tests:
$ npm run test
Contribute
Contributions to the vis.js library are very welcome! We can't do this alone!
Backers
Thank you to all our backers! 🙏

Sponsors
Support this project by becoming a sponsor. Your logo will show up here with a link to your website.


License
Copyright (C) 2010-2018 Almende B.V. and Contributors
Vis.js is dual licensed under both
- The Apache 2.0 License http://www.apache.org/licenses/LICENSE-2.0
and
- The MIT License http://opensource.org/licenses/MIT
Vis.js may be distributed under either license.
Explore related projects
ytdl-org/youtube-dl
Command-line program to download videos from YouTube.com and other video sites
141,500 starsexcalidraw/excalidraw
Virtual whiteboard for sketching hand-drawn like diagrams
135,396 starsgodotengine/godot
Godot Engine – Multi-platform 2D and 3D game engine
119,840 starsmrdoob/three.js
JavaScript 3D Library.
117,905 stars