
tirthajyoti/Stats-Maths-with-Python
tirthajyoti/Stats-Maths-with-Python has 1,043 GitHub stars and 379 forks. GitHot measured 0 stars in 24 hours, +1 in 7 days, and +2 in 15 days. Last checked 2026-11-09 08:28 UTC. Last push 2022-09-18.
General statistics, mathematical programming, and numerical/scientific computing scripts and notebooks in Python
Measured star growth
- in 24h
- 0
- in 7 days
- +1
- in 15 days
- +2
- in 1 month
- Update delayed
Net star changes over overlapping periods, not daily totals. Missing measurements are left blank. Stars measure attention, not software quality.
README.md
OriginalStatistics/ Mathematical Computing Notebooks
Jupyter Notebooks on the topics of statistical analysis, mathematics, and numerical/sceintific computing (in Python).
Please feel free to connect with me on LinkedIn if you are interested in data science and like to connect.
Requirements
- Python 3.6+
- NumPy (
$ pip install numpy) - Pandas (
$ pip install pandas) - Scikit-learn (
$ pip install scikit-learn) - SciPy (
$ pip install scipy) - Statsmodels (
$ pip install statsmodels) - MatplotLib (
$ pip install matplotlib) - Seaborn (
$ pip install seaborn)
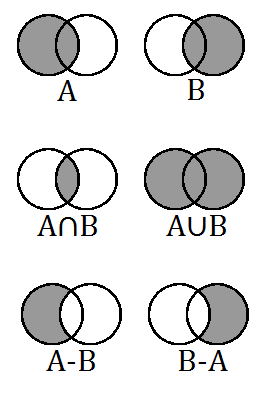
Set Algebra basics
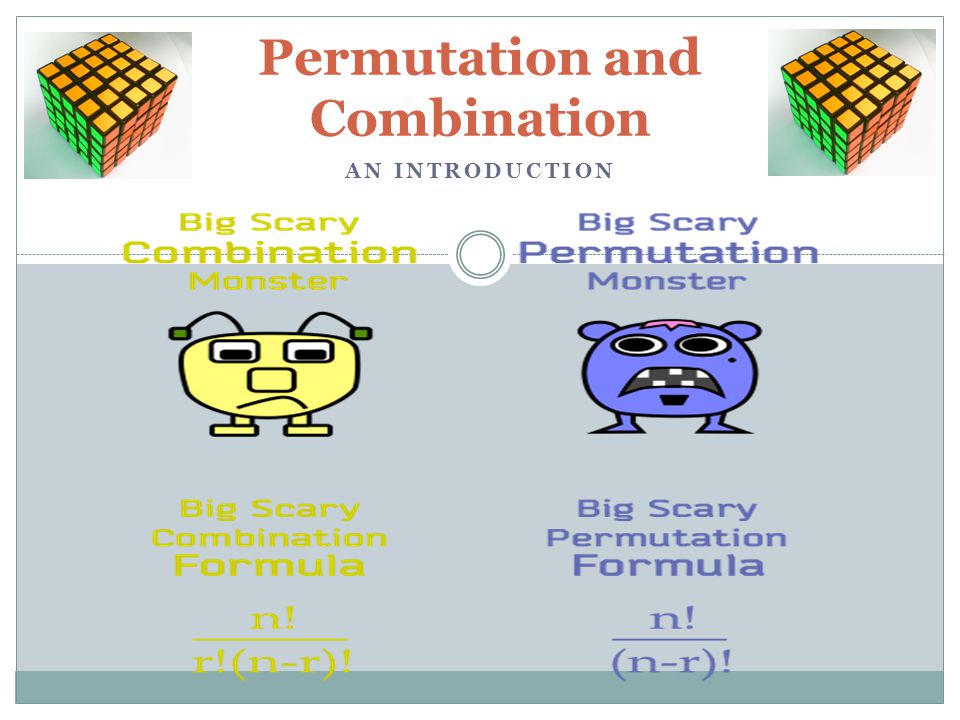
Permutations and Combinations
Probability distributions (Discrete)

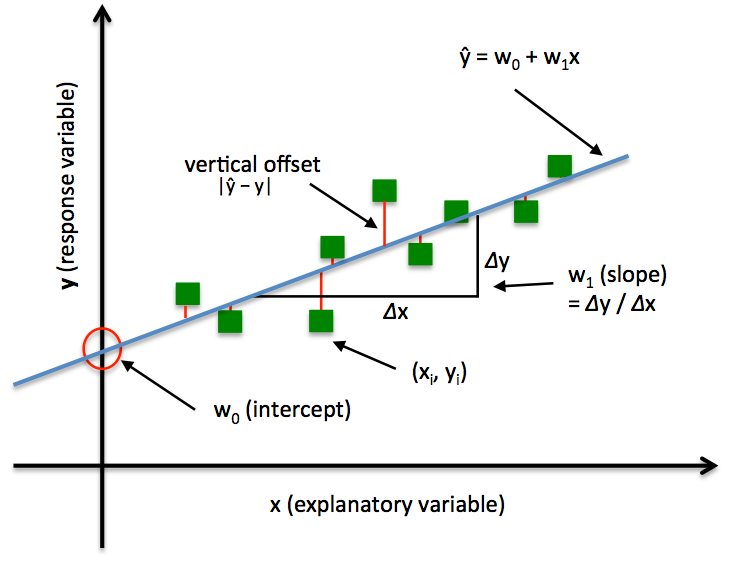
Linear Regression Methods
R-style Statistical functions written using Python
Diagnostics of a linear regression problem
Introduction to hypothesis testing
Articles
Check out this article I wrote on Medium: Essential Math for Data Science.
Check out this article I wrote on Medium about "How to write your favorite R functions — in Python?"
Check out this article I wrote on Medium about "Mathematical programming — a key habit to build up for advancing in data science?"
Check out this article I wrote on Medium about "Bayes’ rule with a simple and practical example"
Check out this article I wrote on Medium about "Statistical modeling with “Pomegranate” — fast and intuitive"
Explore related projects
Asabeneh/30-Days-Of-Python
The 30 Days of Python programming challenge is a step-by-step guide to learn the Python programming language in 30 days. This challenge may take more than 100 days. Follow your own pace. These videos may help too: https://www.youtube.com/channel/UC7PNRuno1rzYPb1xLa4yktw
78,423 starsgrafana/grafana
The open and composable observability and data visualization platform. Visualize metrics, logs, and traces from multiple sources like Prometheus, Loki, Elasticsearch, InfluxDB, Postgres and many more.
77,790 starsredis/redis
For developers, who are building real-time data-driven applications, Redis is the preferred, fastest, and most feature-rich cache, data structure server, and document and vector query engine.
77,309 starsapache/superset
Apache Superset is a Data Visualization and Data Exploration Platform
75,455 stars