
simonw/datasette-vega
simonw/datasette-vega has 65 GitHub stars and 8 forks. GitHot measured 0 stars in 24 hours. Last checked 2026-11-15 09:56 UTC. Last push 2026-11-13.
Measured star growth
- in 24h
- 0
- in 7 days
- Collecting history
- in 15 days
- Collecting history
- in 1 month
- Collecting history
Net star changes over overlapping periods, not daily totals. Missing measurements are left blank. Stars measure attention, not software quality.
About
Datasette plugin for visualizing data using Vega
Web & AppsREADME.md
Originaldatasette-vega


A Datasette plugin that provides tools for generating charts using Vega.
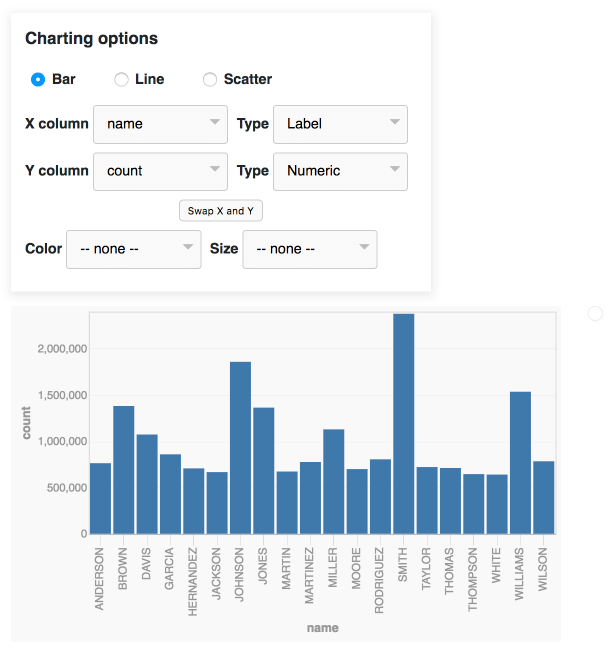
The latest release is installed on datasette.io. Try it out with this scatter chart of power plant locations, colored by fuel type.
To add this to your Datasette installation, install the plugin like so:
pip install datasette-vega
The plugin will then add a "Show charting options" button to every Datasette table and SQL query page.
If you are publishing data using the datasette publish command, you can
include this plugin like so:
datasette publish cloudrun mydatabase.db --service=my-service --install=datasette-vega
Development
The JavaScript is bundled using esbuild. Install the dependencies and build the plugin's static assets into datasette_vega/static/ like this:
npm install
npm run build
This needs to run before building the Python package, since the bundled assets are not checked into the repository.
To work on the charting interface against the demo page in public/index.html, with automatic rebuilds:
npm run dev
Then open http://localhost:3000/.
To run the Python tests (after npm run build):
uv run pytest