
simonro/Trading-Journal-AI
simonro/Trading-Journal-AI has 125 GitHub stars and 48 forks. GitHot measured +1 stars in 24 hours and +6 in 7 days. Last checked 2026-11-17 02:19 UTC. Last push 2026-11-12.
Measured star growth
- in 24h
- +1
- in 7 days
- +6
- in 15 days
- Collecting history
- in 1 month
- Collecting history
Net star changes over overlapping periods, not daily totals. Missing measurements are left blank. Stars measure attention, not software quality.
About
Local-first AI trading journal. Import your broker CSV, get round-trip trades, KPIs and Claude-powered diary analysis. Runs on your own machine. No account, no telemetry, MIT.
Self-hostedREADME.md
OriginalTrading Journal AI



A trading journal that runs on your own machine. Import your broker's CSV and it rebuilds your round-trip trades, tracks the numbers that matter (win rate, profit factor, expectancy, drawdown, MFE/MAE, exit efficiency), and, if you want it to, uses Claude to read your trading diary and grade your days on process.
- Your data stays on your computer. One SQLite file, no account, no telemetry.
- The numbers are not AI. Trade grouping, P&L, fees and statistics are plain code with tests. AI is an optional coaching layer on top.
- Stocks, options and futures, with partial fills, scale-ins and shorts grouped automatically.
- Thinkorswim and Interactive Brokers importers, plus a template for any other broker.
- Free and MIT licensed. No paid tier.
Quick start · Watch the walkthrough · Releases · Privacy
What this is not: Not financial advice. Not a signal service. Every screenshot below is the synthetic demo seed, not anyone's real trades.
Watch the walkthrough

A tour of the current version: the Dashboard, Trade View, Day Review, Leaks and Exit Lab, on a demo account with synthetic trades. The install and update prompts for Claude Code or Codex are in the video description, ready to paste.
Exit Lab
Exit Lab replays your completed stock trades on historical one-minute prices and shows what other exits would have done with the same entry, size and stop. It describes your history; it does not predict future results and it places no orders.
- Exits tab on every trade. A replay chart with your actual fills and each rule's exits, and an outcome table in R and in dollars: Actual, 1R target, 2R target, Hold to close, Breakeven after +1R, and any rule you saved.
- Exit Lab page. The same rules compared across all your trades, filtered by date, symbol, setup and side, each against your own exits on the same trades. Rules can be assigned to the setups they are meant for.
- Advanced rule builder. R targets, a VWAP touch target, exits after N minutes, at a clock time or at the session close, up to 3 scale-out tranches, R-step and ATR trailing stops, and VWAP, EMA 9/20 and 5-minute RS/RW indicator exits.
The rules it plays by:
- The stop is the trade's Stop Loss in the journal. A trade without one asks you to enter it, and that writes the same journal field.
- When a one-minute candle touches the stop and a target, the stop fills first. A gap through the stop fills at the worse open.
- Modeled commissions and slippage are zero. Your actual dollars keep the journal's net P&L.
- Trades without complete regular-hours prices are left out with the reason, never filled in.
Prices. Exit Lab needs historical minute bars from Alpaca. Add APCA_API_KEY_ID and
APCA_API_SECRET_KEY to backend/.env (a free Alpaca account works: it serves SIP history
older than 15 minutes), then press Load missing prices in Exit Lab. One background job
fetches every session and warm-up window your trades are missing, with a progress bar and a
plain list of any that failed. Opening a trade's Exits tab also loads that trade's missing
prices once; its Load prices link is the retry. Prices are cached in your database; a
calculation never downloads anything by itself.
Try it on synthetic trades. The demo builds its own database,
backend/exitlab_demo.db, labeled Synthetic trades, historical market prices: generated
trades on real historical minute prices for SPY, QQQ and NVDA. Your journal database is
not opened. After setup.bat and your Alpaca keys, double-click
scripts\launch_exitlab_demo.bat, then open http://localhost:3020 and choose the
"Exit Lab demo" account. The first run takes about two minutes to download the prices.
By hand on any OS, with the virtualenv active:
# from the repo root
python scripts/seed_exitlab_demo.py --fetch   # downloads prices into backend/exitlab_local.db
python scripts/reset_exitlab_demo.py          # builds backend/exitlab_demo.db (--replace to rebuild)

# terminal 1, from backend/
DATABASE_PATH=exitlab_demo.db python -m uvicorn main:app --port 8020

# terminal 2, from frontend/
PORT=3020 REACT_APP_API_URL=http://localhost:8020 npm start
On Windows cmd, set the variables first: set DATABASE_PATH=exitlab_demo.db in terminal 1,
and set PORT=3020 plus set REACT_APP_API_URL=http://localhost:8020 in terminal 2.
The Exit Lab guide and the engine notes
cover eligibility, fill order and the API.
Leak Finder
Reports > Leaks ranks the groups of your trades that cost you money, using only what you knew when you entered, so every leak is something you could have skipped. It describes your history; it does not predict future results.
- A leak is a group of at least 20 trades sharing one thing known at entry (entry window, trade number of the day, losses just before, minutes since the last loss, how the day stood, size against your usual for that account and ticker, instrument, side, weekday, playbook setup, and the diary fields: strategy, source, emotion) whose net is below zero. Size is the first entry only, so a later add does not count. Sequence features count every entry of the day, breakeven and open trades included, and only trades fully closed before this one was entered.
- Up to three leaks, picked greedily: worst first, its trades removed, the rest recomputed. The headline total never counts a trade twice, and sits beside your net without the leaks.
- Confidence is a Welch t against the rest of the same dimension: 2+ solid, 1-2 likely, under 1 could be noise.
- New in the last 30 days: groups of 10+ trades losing over the last 30 days of the range but not over the whole range. What is working: the two groups that beat the rest by the most, one per dimension.
- Trade management and costs. Hold time, scaling out and mistake tags (logged after the trade, mostly about what happened in it) are shown beside the leaks and never ranked as one. Hold time runs from the first entry to the last exit across days. Commissions and fees are broken down by instrument.
- Show N trades lists the trades behind a finding; a row opens the trade and Back returns to Leaks.
The rules are plain code in backend/leaks.py (pure functions, tested in
backend/tests/test_leaks.py), and /api/leaks loads the same trades as /api/reports (net P&L not
zero, same account and date filters), so the two reconcile. With an Anthropic key,
/api/leaks/explain asks Claude for one sentence per finding from the numbers only, cached in the
leak_explanations table under a hash of those numbers, so it reruns only when they change. Without
a key the tab keeps its plain template sentences.
Privacy and your data
Trading Journal AI is designed as a local-first application.
Your trading journal database, imported broker data, notes, and uploaded files are stored locally on your computer. Trading Journal AI does not require an account and does not include telemetry or analytics that send your usage data back to the project. The backend listens on localhost only.
What stays local
- Your trading database
- Imported broker CSV files
- Trade history and performance data
- Journal entries and notes
- Uploaded diary files and images
- Application settings
Optional external services
Some features use third-party APIs and are completely optional.
Claude / Anthropic
When you use AI analysis or the Brain assistant, the information required to answer your request may be sent to Anthropic's API. This can include trade information, journal context, or images you explicitly ask the AI to analyze.
With a key set, opening Reports > Leaks sends each finding's group name and totals (trade count, net, per-trade average, win rate) to write its one-sentence explanation. Individual trades and trade ids are not sent.
The core journal, trade reconstruction, P&L calculations, reports, and statistics do not require Claude.
Market data (Alpaca)
If you add Alpaca keys, the trade chart and Exit Lab's Load missing prices and Load prices ask Alpaca for price bars: the ticker (plus SPY for Exit Lab) and the date range, nothing about your trades or account.
Update check (GitHub)
When the backend starts, it asks GitHub's public releases page whether a newer version exists, at
most once a day (the answer is cached in backend/update_check.json). That is one anonymous request
to api.github.com: GitHub sees your IP address and the app version, nothing about your trades,
keys or settings. If a newer release exists you get a notice in the app and a line in the backend
window; nothing is ever downloaded or installed for you. Offline, it stays silent. Turn it off with
UPDATE_CHECK=0 in backend/.env.
API keys
API keys are configured locally and should never be committed to GitHub.
Do not share or commit:
.envfiles- API keys or secrets
- Local database files
- Raw broker statements containing personal information
- Screenshots containing account numbers or other sensitive financial information
The repository's .gitignore is configured to exclude common local data and credential files.
Deterministic calculations
AI is not used to calculate your trading results.
Trade reconstruction, P&L, commissions, statistics, and other core trading calculations are handled by deterministic application code. AI features are an optional analysis and coaching layer on top of those calculations.
What's inside
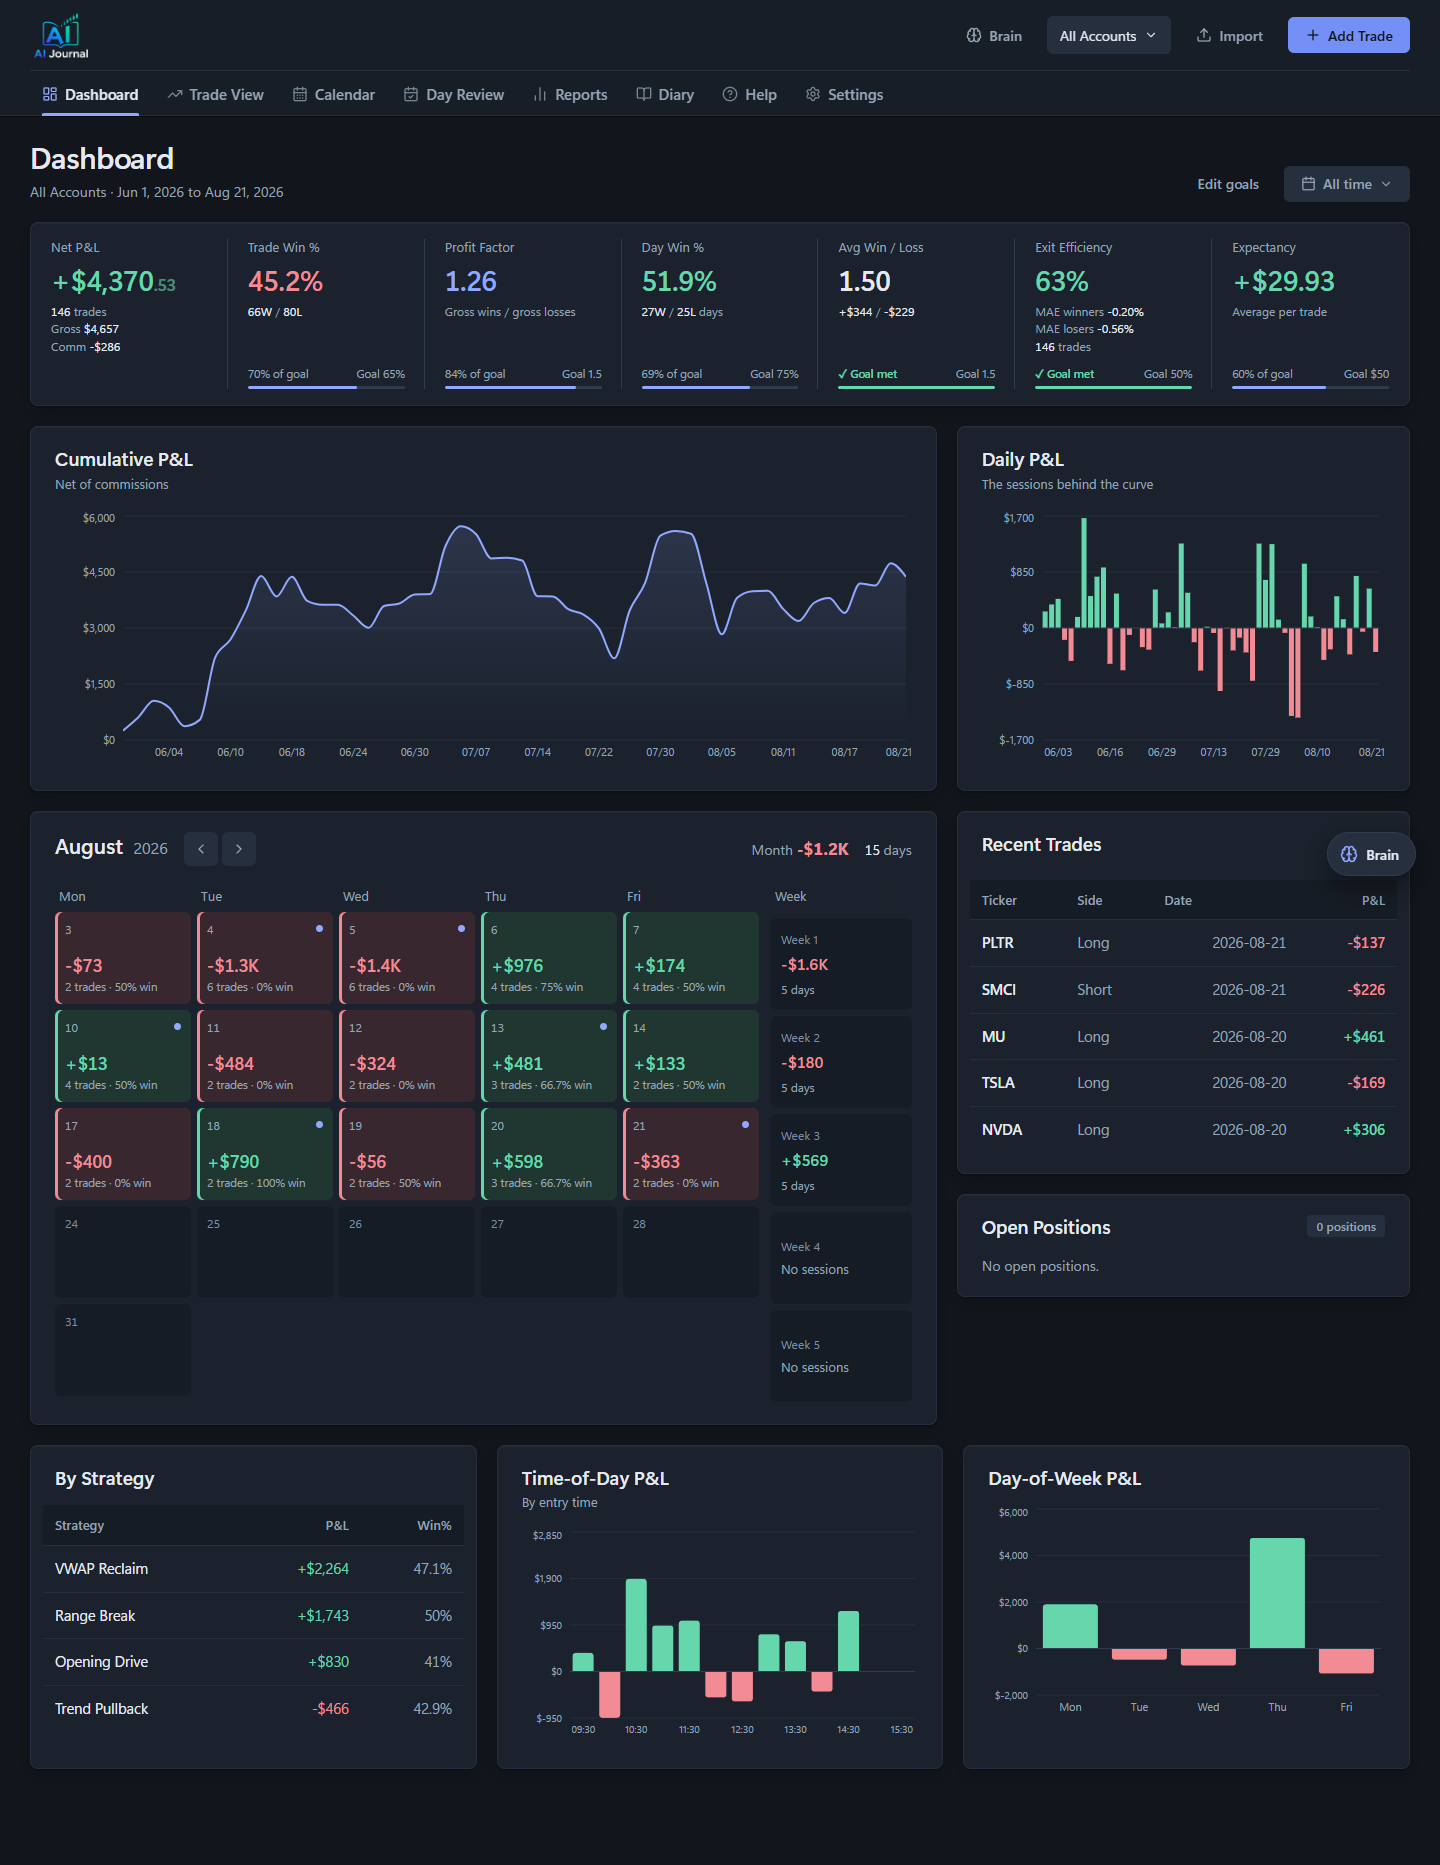
- Dashboard: your net P&L over a live equity curve (hover it for any day's running balance), every session in the period as a single strip you can scrub, measures against your own goals, the month beside your recent trades and open positions, and a tabbed breakdown by time of day, day of week and strategy
- Exit Lab: replays your stock trades on minute prices to compare alternative exits in R and dollars, per trade and across all trades
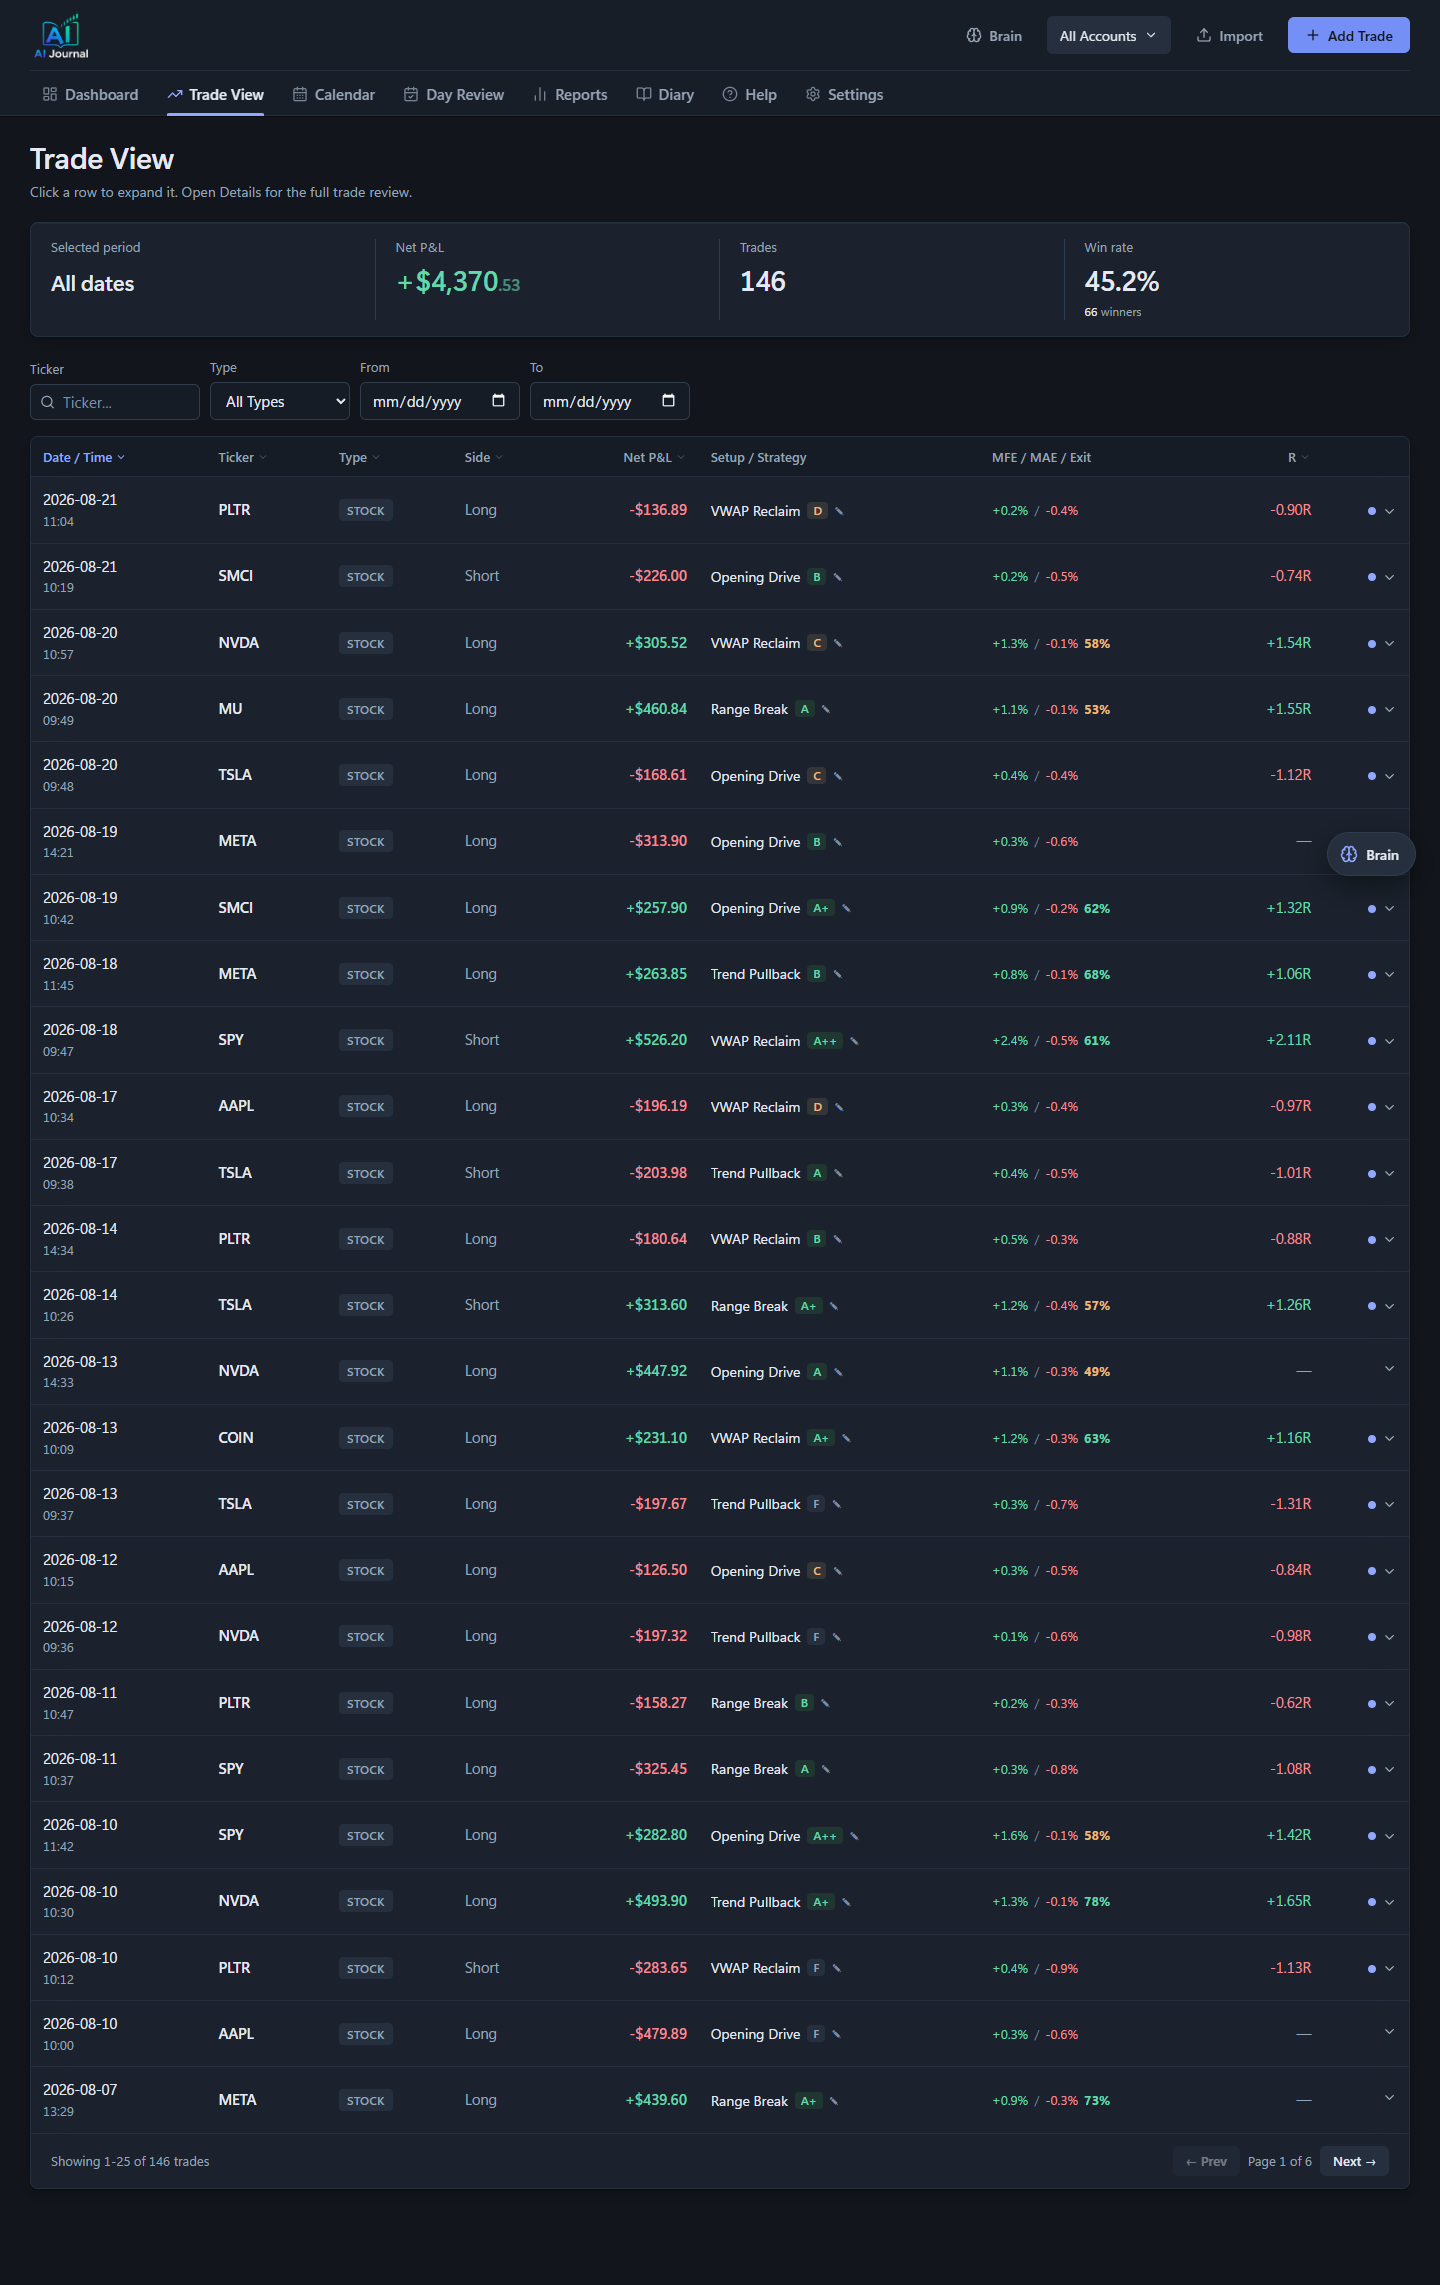
- Trade View: every trade with executions, playbook setup tags, MFE/MAE and exit efficiency, its AI analysis and an intraday chart with your fills on it
- Reports: breakdowns by day of week, time of day, hold time, setup, grade, symbol, side, emotion, plus a Sources & Tags tab that scores where your ideas come from. One switch flips the whole page between bars and full numeric tables, and rows under ten trades are marked thin so a one-trade strategy at 100% cannot sit at the top. A Leaks tab ranks what costs you money (see Leak Finder)
- Diary: upload handwritten notes, screenshots, or typed text; Claude extracts strategy, stops, R-multiples, emotional state, and mistakes, and matches them to your actual trades
- Day Review: the session drawn as one picture, running P&L from the open to the close with every trade marked where you entered it, plus an AI coaching report graded on process rather than P&L. Each trade's grade carries the reason it was given
- Brain: a chat that answers questions against your full trading history
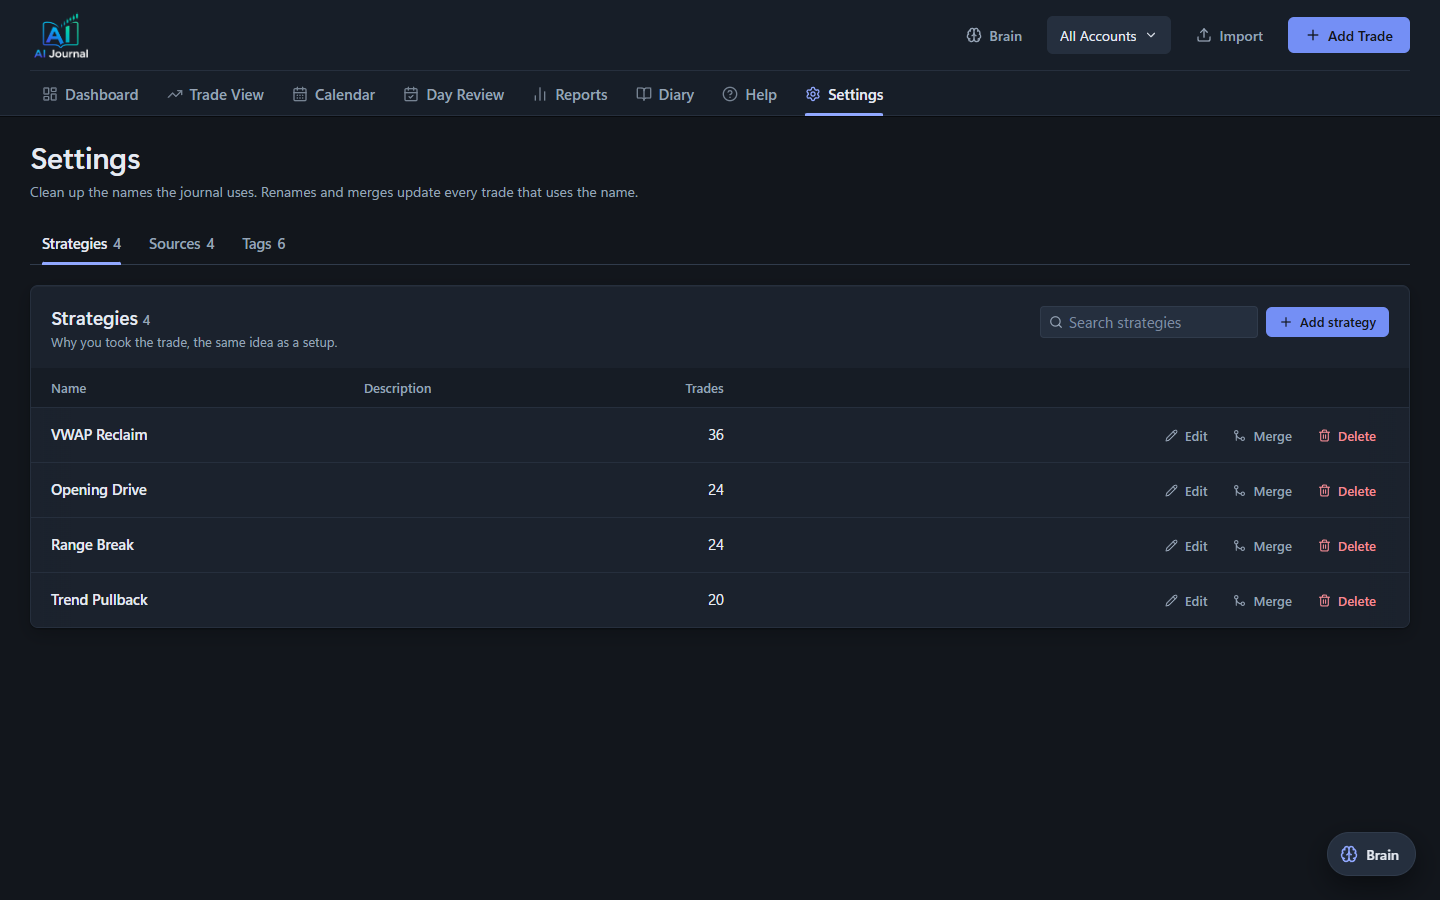
- Settings: the name library. Strategies, sources and tags in one place, with rename, merge and delete. Merging rewrites every trade that used the old name and remembers it, so the next diary analysis that produces the duplicate saves it under the name you kept
- Import: Thinkorswim account statement CSV and Interactive Brokers (IBKR) Activity Statement CSV, with a broker dropdown (auto-detect by default). Any other broker imports through a generic CSV template, one row per fill. Thinkorswim option spreads: a vertical is one trade at its net price, while calendar, diagonal and custom orders keep every leg
Screenshots
Trade View. Every trade with its executions, MFE/MAE and exit efficiency, the realized R, and the setup you tagged. Click any row to open the full trade.
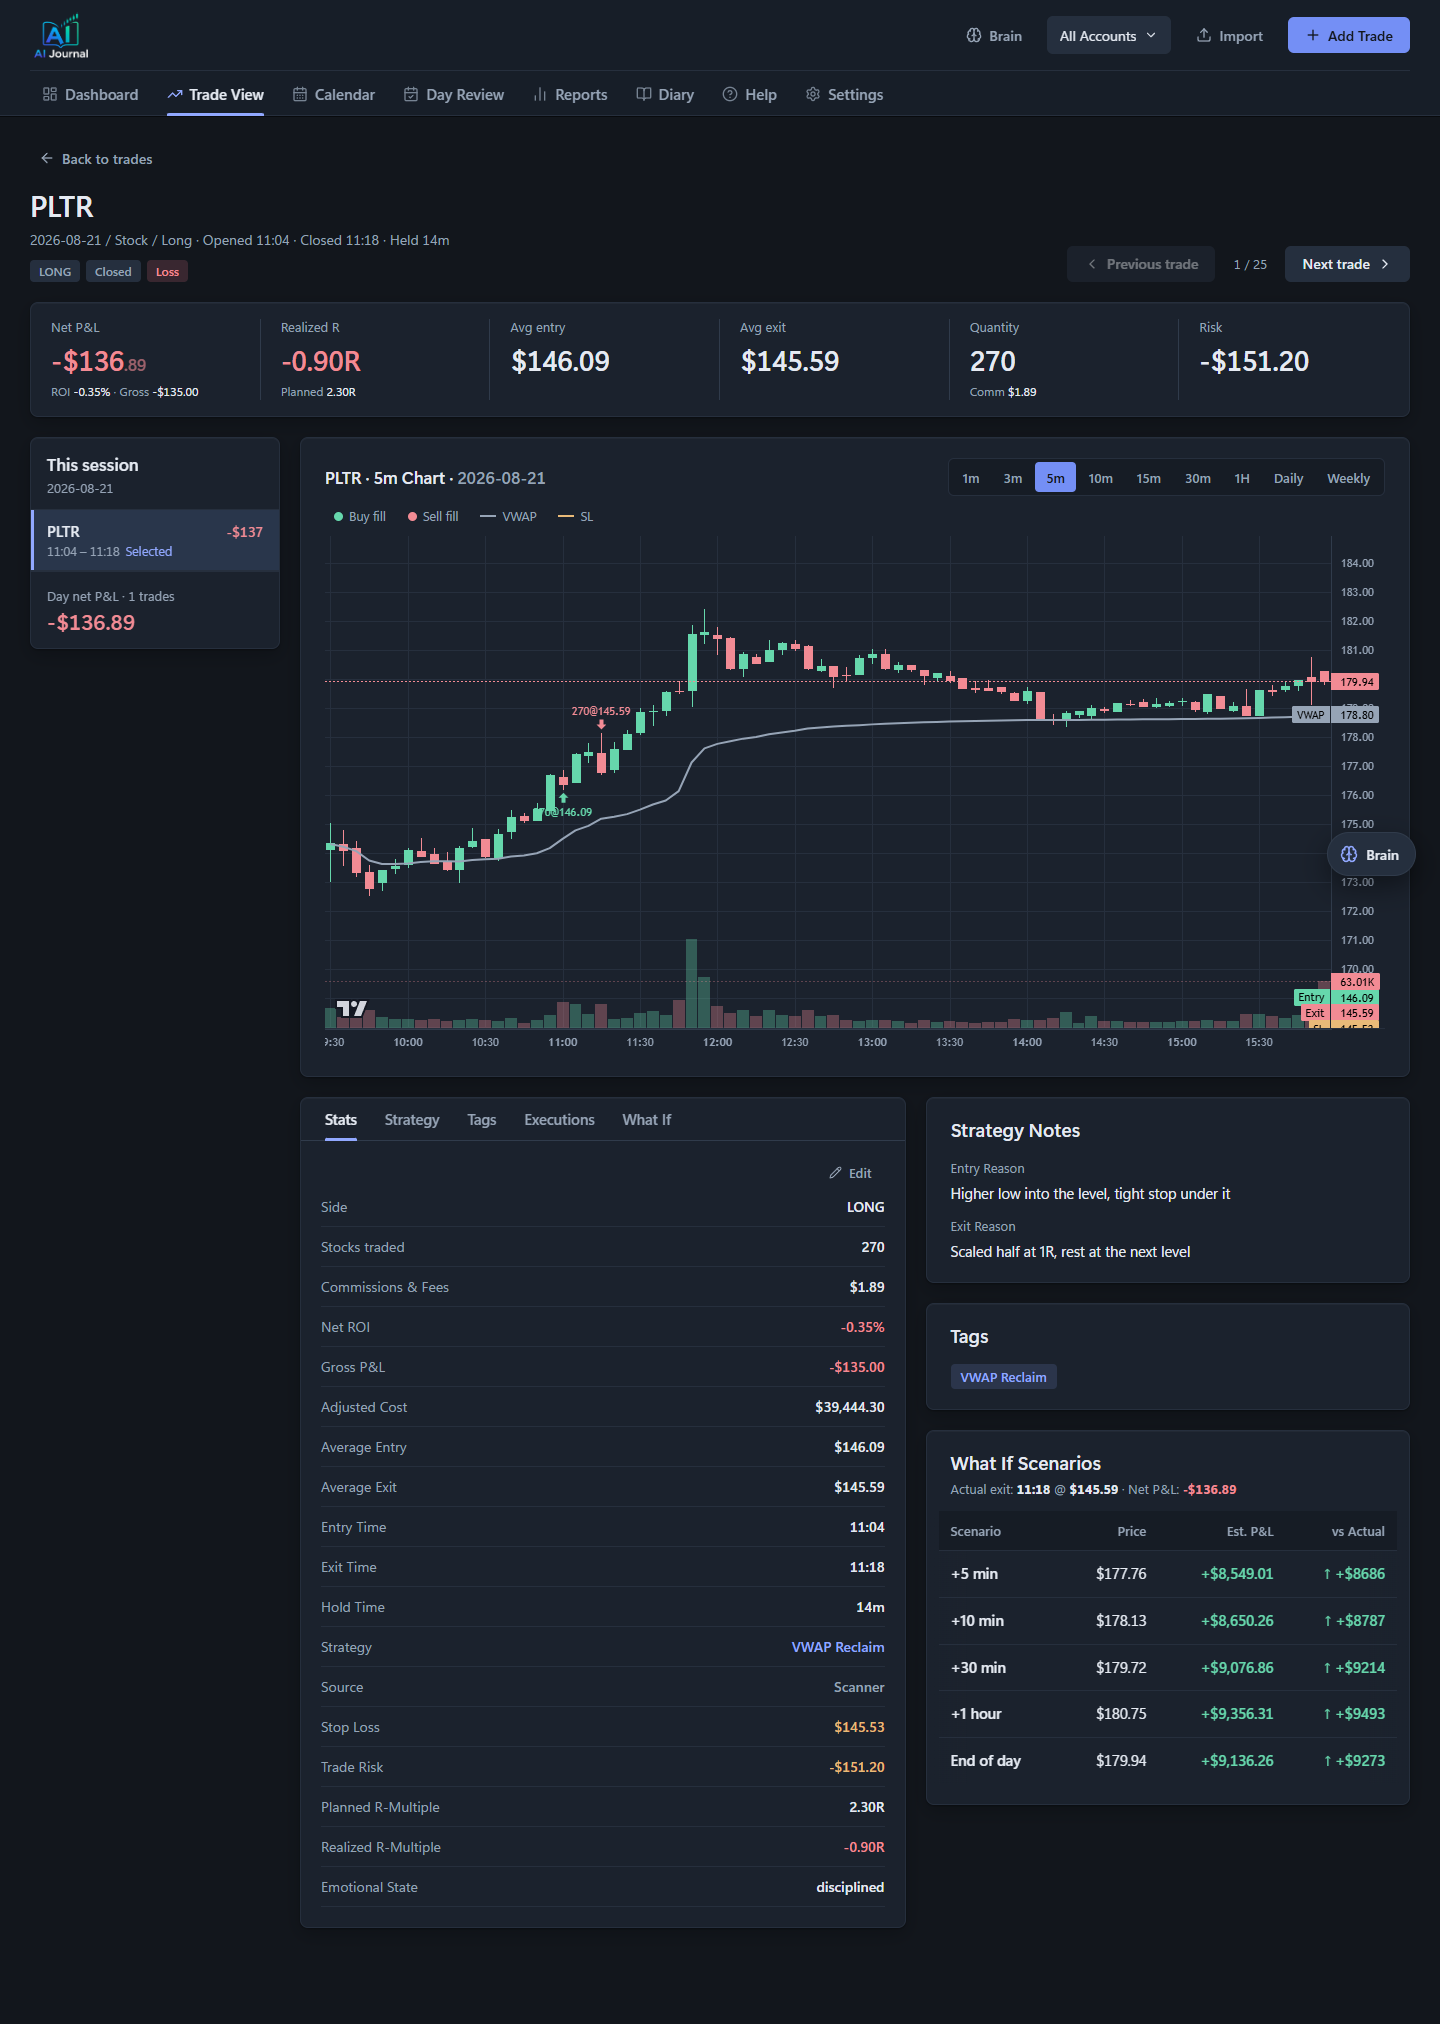
Trade Details. The executions on one trade, the planned and realized R, the stop and target you wrote before entry, and an intraday chart with your fills marked on it. Charts open on the trade day's session; the legend entries switch layers on and off.
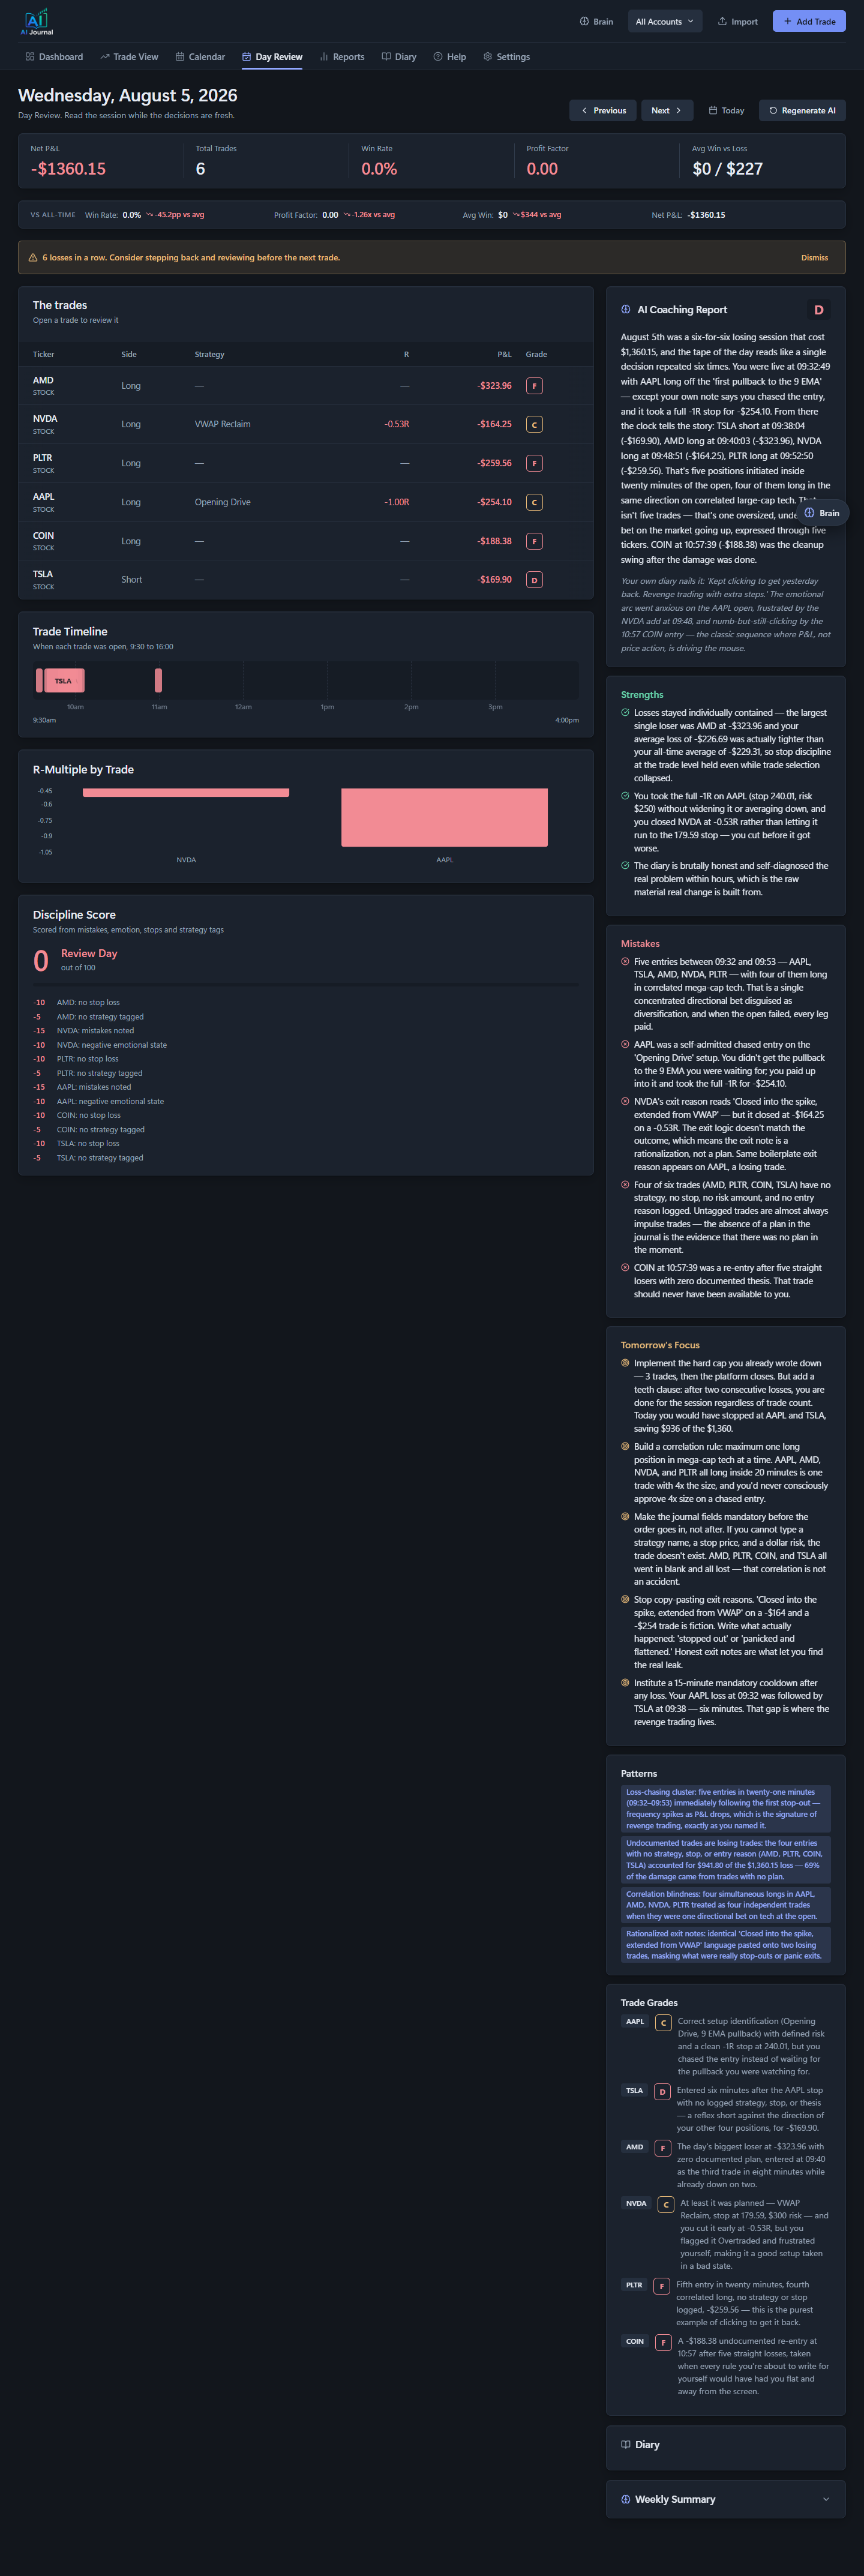
Day Review. The session as one picture: running P&L from the open to the close with every trade marked where you entered it. The day's measures sit under it, each set against your all-time figure: win rate, profit factor, average win, average per trade against your expectancy, exit efficiency, and how much was given back from the session high. Underneath, an AI coaching report graded on process rather than P&L, which reads your trades and your diary together and is willing to tell you a profitable day was badly run.
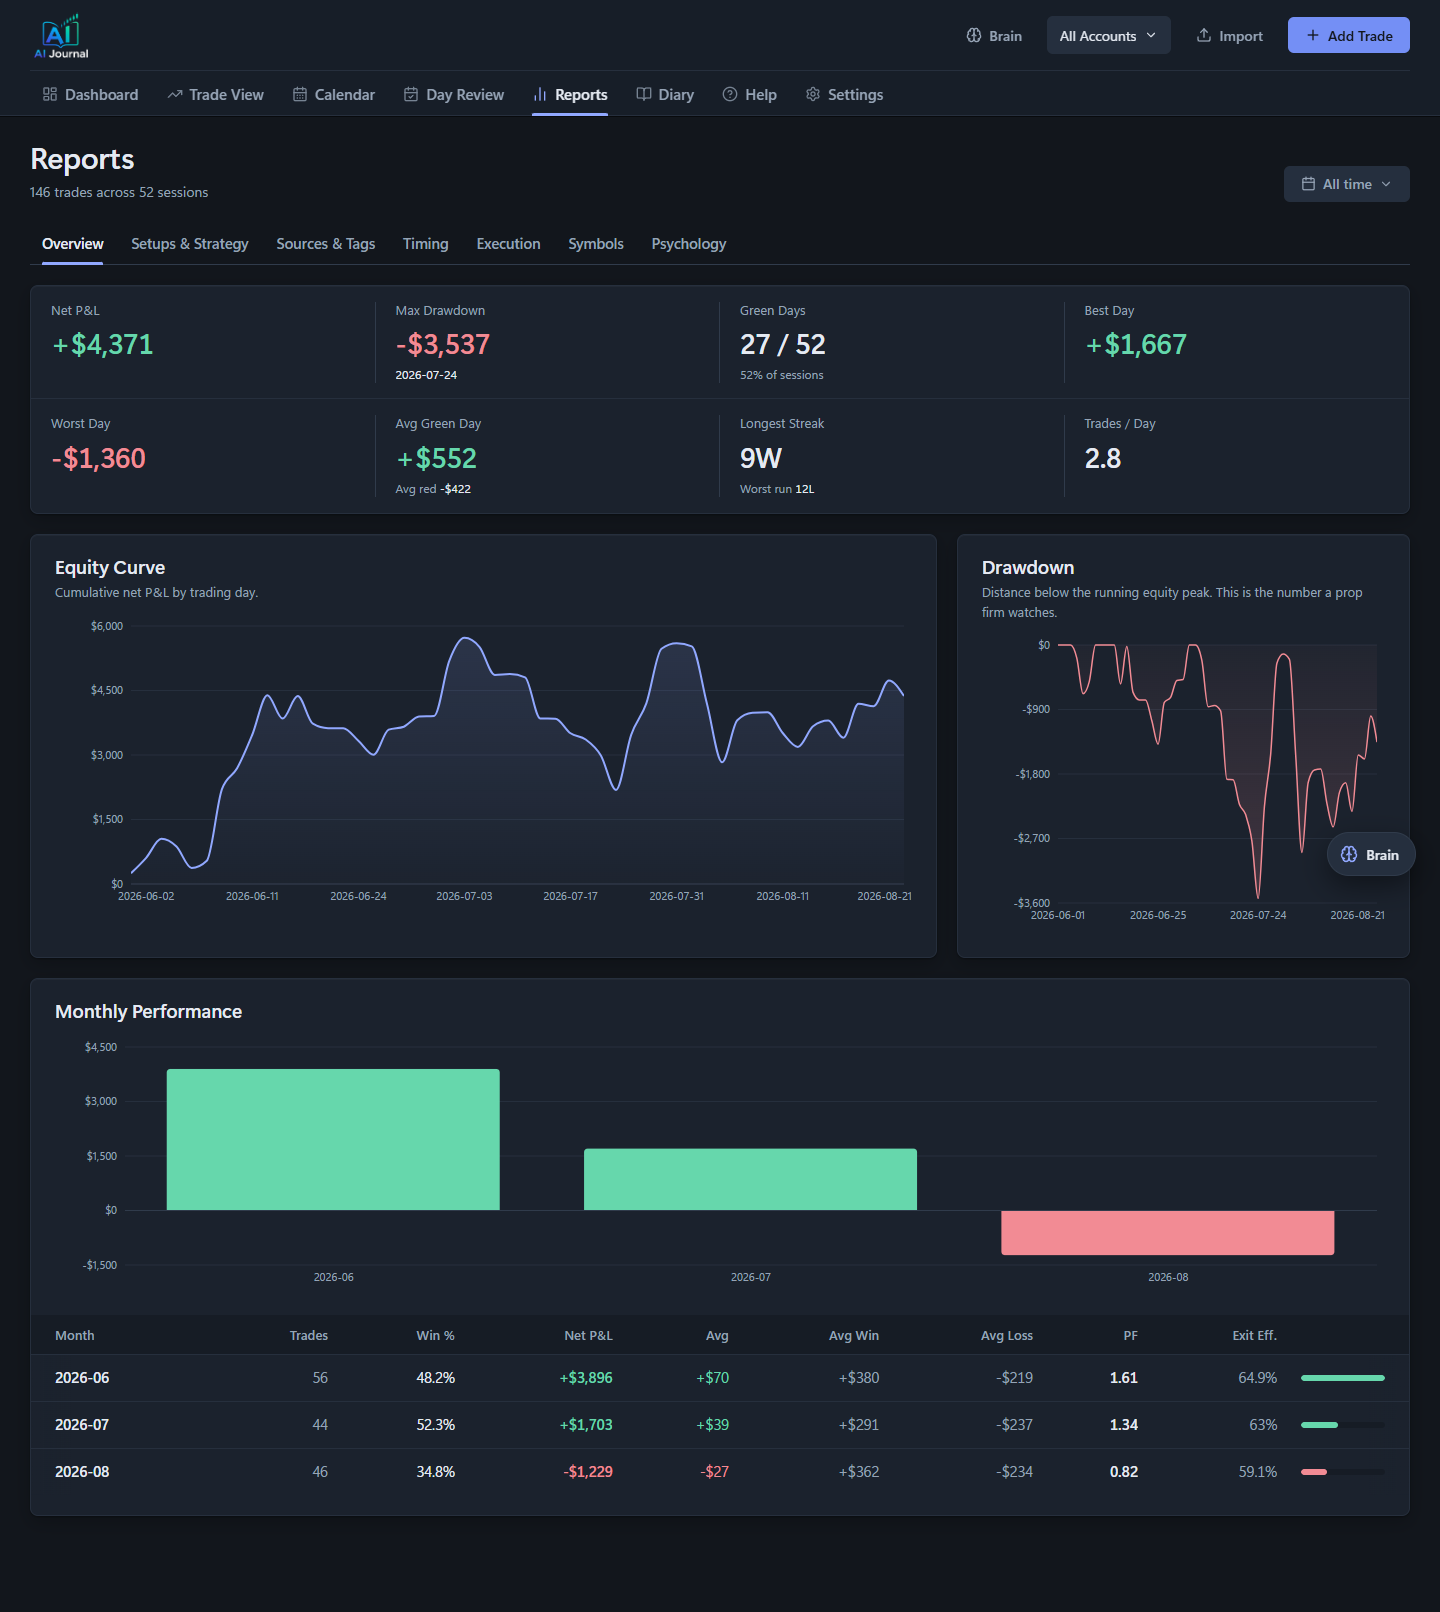
Reports. Equity curve, drawdown against the running peak, and breakdowns by setup, timing, execution, symbol, source, tag and psychology.
Settings. The vocabulary the journal uses. Rename a strategy, merge two that mean the same thing, or delete one and reassign its trades.
Quick start
Requirements: Python 3.11+ and Node.js 18+ (the current LTS is recommended).
Windows, two steps: download or clone the repo, then double-click
setup.bat, once. It creates the Python environment, installs everything and createsbackend\.envfor your optional keys.launch.bat, every time. Then open http://localhost:3010
Manual setup (Mac, Linux, or if you prefer):
# 1. Python environment + backend dependencies
python -m venv .venv
.venv\Scripts\activate         # Windows (source .venv/bin/activate on Mac/Linux)
pip install -r backend/requirements.txt

# 2. Frontend dependencies
cd frontend
npm ci
cd ..

# 3. Run both (Windows; launch.bat picks up .venv automatically)
launch.bat
launch.bat starts the FastAPI backend on http://localhost:8010 and the React frontend on http://localhost:3010. On Mac/Linux run them manually: python -m uvicorn main:app --reload --port 8010 from backend/, and PORT=3010 npm start from frontend/.
To run them on other ports, tell each side about the other: REACT_APP_API_URL for the frontend,
and, only if the frontend is not on localhost, FRONTEND_ORIGINS (comma separated) for the
backend's CORS allow list. Any localhost port is accepted without configuration.
Every install starts empty: no accounts, no trades, no demo data. Add your first account in the app, then import your broker's statement on the Import page.
Updating to a new release
When a newer release is out, the app shows a notice at the top of the page with a link to the release notes (how the check works is under Privacy). It never updates itself; you choose when, with the steps below.
Your trades live in backend/trading_journal.db and your keys in backend/.env. Neither is part of
a release, so an update never touches them. New tables are created on the first start and nothing
existing is rewritten.
If you cloned with git:
git pull
pip install -r backend/requirements.txt   # only if requirements changed
cd frontend && npm install && cd ..       # only if package.json changed
launch.bat
If you downloaded the ZIP: unzip the new version into a new folder, then copy your two files
across before starting it, plus the uploads folder if you have uploaded diary images:
copy old-folder\backend\.env               new-folder\backend\.env
copy old-folder\backend\trading_journal.db new-folder\backend\trading_journal.db
xcopy /e /i old-folder\backend\uploads     new-folder\backend\uploads
Then run npm install in frontend/ once and start it with launch.bat.
Back up trading_journal.db first if you have trades you care about. It is a single SQLite file, so
copying it somewhere safe is the whole backup.
To check what changed, see the releases page.
Re-importing a day after an import fix. An import skips fills that are already stored, so a plain re-import leaves old rows as they were. Open the day, delete the affected trades with the delete button on each trade row (notes and tags on them go too), then import that day's statement again. v1.5.2 needs this for Thinkorswim days with option spreads, which earlier versions overstated.
Importing from a broker that is not listed
Thinkorswim and Interactive Brokers have dedicated importers. For anything else, use the generic template: one row per fill, which the journal groups into round-trip trades exactly like a broker import. On the Import page, open Broker not listed? to download it.
- Blank template:
frontend/public/templates/generic_trades_template.csv - Worked example:
frontend/public/templates/generic_trades_example.csv(a long with a partial exit, a short, an option and a micro future)
| Column | Needed | What goes in it |
|---|---|---|
date |
Required | YYYY-MM-DD, or MM/DD/YYYY. Day-first dates are refused because 03/04 is ambiguous |
time |
Required | 24 hour HH:MM or HH:MM:SS, or 1:05 PM |
symbol |
Required | AAPL. Futures start with a slash: /MESU26 |
side |
Required | BUY or SELL. BUY TO COVER, SELL SHORT, BOT and SOLD work too |
quantity |
Required | Shares or contracts, always positive |
price |
Required | Fill price per share or per contract |
commission |
Optional | Fees for that fill. Blank means 0 |
asset_type |
Optional | STOCK (the default), OPTION or FUTURE |
expiry, strike, put_call |
Options | 2026-08-28, 765, CALL or PUT. Options use a 100 multiplier |
multiplier |
Optional | Point value for a future the app does not know, for example 50 for /ES |
Columns can be in any order, common names such as Ticker, Qty and Fees are recognised, and
extra columns are ignored, so an export that already uses these headers imports without editing.
If any row cannot be read, nothing is imported and the error names the line and the problem. A silently skipped fill would change every P&L figure after it, so the importer refuses instead.
Adding a dedicated parser for your broker is welcome: open an issue with a sample export that has
the account numbers and personal details removed, or send a pull request against
backend/csv_parser.py. Every parser only has to produce execution rows; grouping, duplicate
detection and P&L are shared.
Environment variables
Copy .env.example to backend/.env and fill in the keys yourself, or ask Claude Code to do it:
Add your API keys:
Copy .env.example to backend/.env. Then ask me for my Anthropic API key, and after that my Alpaca key ID and secret key, one at a time. Write each one into the matching line in backend/.env exactly as I paste it. Do not print any of them back to me or log them anywhere else. When all three are in, tell me to restart launch.bat.
Everything is optional; the app runs without any keys and tells you exactly which feature each missing key disables.
| Variable | Enables |
|---|---|
ANTHROPIC_API_KEY |
Diary analysis, Day Review, Weekly Summary, Insights, and the Brain chat |
APCA_API_KEY_ID / APCA_API_SECRET_KEY |
Intraday price charts on each trade and Exit Lab's historical minute prices (free Alpaca account works) |
ALPACA_ENV_FILE |
Optional. Path to another .env file that holds the Alpaca keys for Exit Lab. When set, Exit Lab reads its keys only from that file. |
ALPACA_DATA_FEED |
Optional, defaults to iex (free-tier data). Set to sip only if your key has a paid market-data subscription. |
FRONTEND_ORIGINS |
Optional. Any localhost/127.0.0.1 port is already accepted; add comma-separated origins here only for a frontend served from another host. |
UPDATE_CHECK |
Optional. 0 turns off the once-a-day check for a newer release on GitHub. |
Make it yours with Claude Code
This whole app was built by describing problems to Claude Code, one session at a time: "my spreadsheet can't group partial fills", "I want my handwritten diary matched to my trades", "show me when in the day I lose money". No web framework expertise required to get here, and none required to make it yours.
This repo is meant to be adapted, and the fastest way is to point Claude Code at it. A ready-to-paste prompt:
Adapt the importer to your broker:
Read backend/csv_parser.py. It parses Thinkorswim account statement CSVs and Interactive Brokers Activity Statement CSVs: each broker parser reads execution rows (date, time, buy/sell, quantity, symbol, price, fees) into a common execution dict shape (action BOT/SOLD, qty, ticker, price, instrument_type, date, iso_date, time, amount, commission) and hands them to build_trades_from_executions, which groups them into round-trip trades by position open/close cycles and de-duplicates against the database. Here is a sample CSV export from my broker (pasted below / attached). Write a parse__csv function for my broker's format following parse_ibkr_csv as the template, register it in BROKER_PARSERS and BROKER_LABELS, teach detect_broker to recognise the file, and add the broker to the BROKERS dropdown in frontend/src/components/Import.js with its export instructions. Keep the duplicate-detection fingerprints working.
Contributing
Bug reports, broker samples and pull requests are welcome. CONTRIBUTING.md covers the setup, the tests to run and how to add a broker importer. Please report security problems privately, as described in SECURITY.md, not in a public issue.
More free tools from Tape to Edge
Same rules for each one: free, MIT, runs on your own machine, and the build is on the YouTube channel.
- Edge Scanner: a real-time intraday stock scanner with a browser dashboard you lay out yourself.
- Edge GEX Lab: a live gamma exposure (GEX) map for SPY, QQQ, SPX, NDX and stocks, with walls, gamma flip and regime.
- AI Research Desk: three AI research teams debate one stock into swing and long-term calls.
Who made this
Simon, a day trader. I built this because the journals I was paying for made me fill in forms hours after the trade, and I never kept it up. I am not a programmer; this was built by describing problems to Claude Code, and the prompts are in the video description.
- YouTube: @tapetoedge, where I show what I build and how
- X: @tapetoedge
I take no affiliate money from any broker or tool, and this app has no paid tier, no account and no telemetry. If it is useful, fork it.
Educational content, not financial advice. I have no affiliate relationship with anything I show or use, ever.
License
MIT. See LICENSE.