
sgreben/jp has 1,343 GitHub stars and 34 forks. GitHot measured 0 stars in 24 hours. Last checked 2026-11-07 07:29 UTC. Last push 2022-11-01.
dead simple terminal plots from JSON data. single binary, no dependencies. linux, osx, windows.
Measured star growth
- in 24h
- 0
- in 7 days
- Update delayed
- in 15 days
- Update delayed
- in 1 month
- Update delayed
Net star changes over overlapping periods, not daily totals. Missing measurements are left blank. Stars measure attention, not software quality.
README.md
Originaljp
Dead simple terminal plots from JSON (or CSV) data. Bar charts, line charts, scatter plots, histograms and heatmaps are supported.

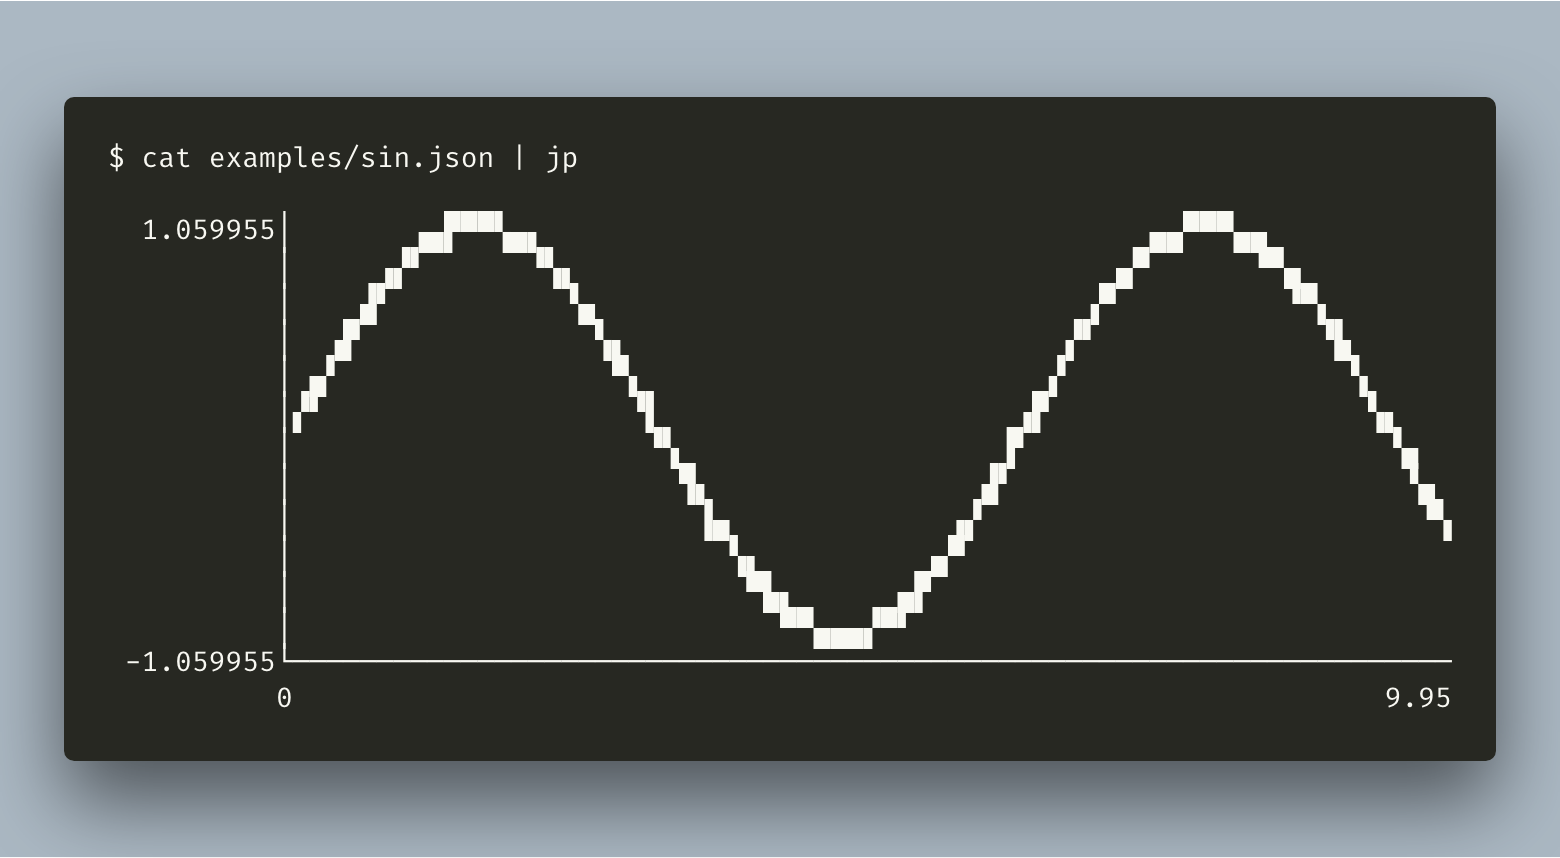
Get it
go get -u github.com/sgreben/jp/cmd/jp
Or download the binary from the releases page.
# Linux
curl -LO https://github.com/sgreben/jp/releases/download/1.1.12/jp_1.1.12_linux_x86_64.zip
unzip jp_1.1.12_linux_x86_64.zip

# OS X
curl -LO https://github.com/sgreben/jp/releases/download/1.1.12/jp_1.1.12_osx_x86_64.zip
unzip jp_1.1.12_osx_x86_64.zip

# Windows
curl -LO https://github.com/sgreben/jp/releases/download/1.1.12/jp_1.1.12_windows_x86_64.zip
unzip jp_1.1.12_windows_x86_64.zip
Use it
jp reads JSON (or CSV) on stdin and prints plots to stdout.
Usage of jp:
  -type value
    	Plot type. One of [line bar scatter hist hist2d] (default line)
  -x string
    	x values (JSONPath expression)
  -y string
    	y values (JSONPath expression)
  -xy string
    	x,y value pairs (JSONPath expression). Overrides -x and -y if given.
  -bins uint
        Number of histogram bins (default 0 (auto))
  -input value
        Input type. One of [json csv] (default json)
  -height int
    	Plot height (default 0 (auto))
  -width int
    	Plot width (default 0 (auto))
  -canvas value
    	Canvas type. One of [full full-escape full-bw full-wb quarter braille auto] (default auto)
Examples
Bar chart
Separate X and Y values
$ < examples/tcp-time.json jp -x ..Label -y ..Count -type bar

         69
    █████████████
    █████████████
    █████████████
    █████████████
    █████████████
    █████████████      21
    █████████████ █████████████       7             2             1
    █████████████ █████████████ ▄▄▄▄▄▄▄▄▄▄▄▄▄ ▁▁▁▁▁▁▁▁▁▁▁▁▁ ▁▁▁▁▁▁▁▁▁▁▁▁▁

     46.85267ms    48.38578ms    49.91889ms     51.452ms     52.98511ms
XY pairs
$ < examples/tcp-time.json jp -xy "..[Label,Count]" -type bar

         69
    █████████████
    █████████████
    █████████████
    █████████████
    █████████████
    █████████████      21
    █████████████ █████████████       7             2             1
    █████████████ █████████████ ▄▄▄▄▄▄▄▄▄▄▄▄▄ ▁▁▁▁▁▁▁▁▁▁▁▁▁ ▁▁▁▁▁▁▁▁▁▁▁▁▁

     46.85267ms    48.38578ms    49.91889ms     51.452ms     52.98511ms
Y values only (X=index)
$ < examples/tcp-time.json jp -y ..Count -type bar

         69
    █████████████
    █████████████
    █████████████
    █████████████
    █████████████
    █████████████      21
    █████████████ █████████████       7             2             1
    █████████████ █████████████ ▄▄▄▄▄▄▄▄▄▄▄▄▄ ▁▁▁▁▁▁▁▁▁▁▁▁▁ ▁▁▁▁▁▁▁▁▁▁▁▁▁

          0             1             2             3             4
Array data
$ echo '[[-3, 5], [-2, 0], [-1, 0.1], [0, 1], [1, 2], [2, 3]]' | jp -xy '[*][0, 1]' -type bar

         5
    ███████████
    ███████████
    ███████████                                                      3
    ███████████                                                 ▄▄▄▄▄▄▄▄▄▄▄
    ███████████                                          2      ███████████
    ███████████                              1      ███████████ ███████████
    ███████████                 0.1     ▄▄▄▄▄▄▄▄▄▄▄ ███████████ ███████████
    ███████████      0      ▁▁▁▁▁▁▁▁▁▁▁ ███████████ ███████████ ███████████

        -3          -2          -1           0           1           2
Line chart
Array data, separate X and Y values
$ jq -n '[range(200)/20 | [., sin]]' | jp -x '[*][0]' -y '[*][1]'
  1.059955│         ▄▄▄▖                                       ▗▄▄▄▖
          │       ▄▀▘  ▝▜▖                                   ▗▞▘   ▝▚
          │      ▟       ▝▄                                 ▗▀       ▜
          │     ▟         ▝▄                               ▗▀         ▜
          │    ▐           ▝▖                             ▗▞           ▚▖
          │   ▗▘            ▝▖                            ▞             ▚
          │  ▗▘              ▚                           ▞               ▌
          │  ▌                ▌                         ▗▘               ▝▖
          │ ▞                 ▝▖                        ▌                 ▚
          │▗▘                  ▚                       ▞                   ▌
          │▌                    ▌                     ▗▘                   ▝▖
          │                     ▝▖                   ▗▘                     ▐
          │                      ▐                   ▞                       ▚
          │                       ▚                 ▐                        ▝▖
          │                       ▝▖               ▗▘                         ▐
          │                        ▐               ▞                           ▚
          │                         ▀▖            ▐
          │                          ▚           ▄▘
          │                           ▙         ▗▘
          │                            ▚       ▄▘
          │                             ▚▄   ▗▞▘
          │                              ▝▀▀▀▘
 -1.059955└─────────────────────────────────────────────────────────────────────
          0                                                                 9.95
Array data, XY pairs
$ jq -n '[range(200)/20 | [., sin]]' | jp -xy '[*][0, 1]'
  1.059955│         ▄▄▄▖                                       ▗▄▄▄▖
          │       ▄▀▘  ▝▜▖                                   ▗▞▘   ▝▚
          │      ▟       ▝▄                                 ▗▀       ▜
          │     ▟         ▝▄                               ▗▀         ▜
          │    ▐           ▝▖                             ▗▞           ▚▖
          │   ▗▘            ▝▖                            ▞             ▚
          │  ▗▘              ▚                           ▞               ▌
          │  ▌                ▌                         ▗▘               ▝▖
          │ ▞                 ▝▖                        ▌                 ▚
          │▗▘                  ▚                       ▞                   ▌
          │▌                    ▌                     ▗▘                   ▝▖
          │                     ▝▖                   ▗▘                     ▐
          │                      ▐                   ▞                       ▚
          │                       ▚                 ▐                        ▝▖
          │                       ▝▖               ▗▘                         ▐
          │                        ▐               ▞                           ▚
          │                         ▀▖            ▐
          │                          ▚           ▄▘
          │                           ▙         ▗▘
          │                            ▚       ▄▘
          │                             ▚▄   ▗▞▘
          │                              ▝▀▀▀▘
 -1.059955└─────────────────────────────────────────────────────────────────────
          0                                                                 9.95
Y values only (X=index)
$ < examples/tcp-time.json jp -y ..Duration
 5.726165e+07│
             │
             │
             │
             │ ▗
             │ ▟
             │ █
             │▐▝▖
             │▐ ▌                                   ▌
             │▐ ▌                                   ▌
             │▌ ▌                                  ▐▚
             │▌ ▌                ▗       ▗         ▐▐    ▌
             │▘ ▌              ▖ ▐      ▞▀▖        ▐▐    ▌
             │  ▚   ▐▚  ▗▀▖   ▗▚ ▌▌    ▗▘ ▌ ▖▗▀▌   ▌▐    █
             │  ▐  ▛▌ ▚▖▞ ▚▐▖ ▞▐ ▌▌ ▗  ▐  ▐▟▐▞ ▚ ▗ ▌▝▖  ▐▐                      ▐
             │  ▐ ▐    ▝  ▝▌▝▀ ▝▟ ▚▗▜  ▞     ▘ ▐▖█▗▘ ▌  ▐▐    ▗  ▄▖     ▄▖      ▌▌
             │  ▝▚▐        ▘    ▘ ▐▘▝▖▄▌        ▝▝▟  ▀▀▚▟ ▌ ▖▞▘▌▐ ▚ ▗▄ ▐ ▚▄▖ ▄ ▄▘▌▞▄▄▀▚   ▄ ▄▗▞▖▞▄▄▚
             │   ▝▌                  ▛            ▌     ▝ ▙▞▝  ▝▘ ▝▚▘ ▀▘   ▝▀ ▀  ▐▘    ▚▞▀ ▀ ▘ ▚▘
             │
             │
             │
             │
 4.446018e+07└──────────────────────────────────────────────────────────────────────────────────────
             0                                                                                    99
Scatter plot
$ < examples/mvrnorm.json jp -xy '..[x,y]' -type scatter

 3.535344│                                 ⠄             ⠄
         │                               ⠈⠂   ⠂       ⡀ ⠂
         │                          ⠐⡀⡀⡂   ⠁  ⢄  ⠁ ⠠
         │                            ⡀    ⠆     ⠈  ⠄⡀        ⠂
         │           ⡀       ⠠  ⡀ ⡀ ⠄  ⡀⠐⠄⠁⠐ ⠠⢆⠠⠂⠂⠄⣀⢈  ⡀⠈ ⡀
         │                     ⡀⠂⠂⠄ ⡀⠂⢔⠠ ⢤⢀⠌⣡⠁⠦⠄⠐⡐⠂⣀⠅⠁⠈ ⠂ ⠈⠁⠁      ⡀     ⠄
         │  ⡀         ⢀  ⠄     ⠈⠠ ⠡⠑⠈⠈⢢⡁⡄⢈⠂⢡⠈⡄⡀⠈⠰⢉⡠⠘⢄⢃⠉⢀⣄⠢⠠⠄ ⠠ ⡀⠁ ⡀ ⠂
         │                   ⠈ ⡂⠈⡁⠈⠄⢂⡹⡐⡡⡆⡥⣙⡶⡼⠱⣅⣅⣼⢗⡱⢐⣈⠑⢁⠂ ⢐⢁⠭⠘⡀  ⠈
         │                ⠁ ⢀⠄⢈⠈⡰⢀⡥⠋⣧⣓⣚⡛⢲⣽⣝⣭⢙⣟⢲⡽⣋⡠⣿⣜⣵⠙⡦⠗ ⣡⠁⠁⠁⠄⠠ ⠄⡂
         │                  ⠄⠌⠌⠡⠉⡐⢯⣵⡏⢵⡞⠂⢰⣽⣷⢛⣯⡣⣷⢭⣞⣏⠤⣾⢡⡻⠢⢊⢠⡠⠸⢄⣃⡀⢁⠐ ⠐⡀ ⠂    ⠄
         │              ⠨ ⡈⠂ ⢀⢑⠄⣜⡾⣴⢨⠶⣪⣧⢿⣷⣷⡱⣿⣞⣲⣮⣮⣯⢾⡷⡬⡷⣺⠤⢏⡼⣨⢌⡬⠠⢂⢠⠒⠱⠆⡈
         │          ⠈  ⠃ ⠄⡐⠂⠐⢀⢈⣂⡈⣳⣷⣜⢺⣿⣹⣷⣼⣯⡿⣃⣽⣿⢾⣟⣾⢵⣻⠯⡼⡃⣼⣗⢲⠪⠇⣉⠺ ⢱⠠⠙⡀⢐⠌
         │          ⠄   ⠈⠊⠐⠑⠨⠚⢁⡊⢾⡶⢩⢿⣏⣽⢞⣼⣇⣵⣿⣿⣽⣿⢽⣭⠺⣿⣽⣳⢚⣾⣻⣾⣜⠩⡒⣃⠈⢢⠕⢂⢰⡀  ⡔⢀⢀    ⡀
         │            ⢀⠂⠁⠂⠇ ⠂⠊⢀⠐⡘⡍⡇⣚⢸⢟⣯⢿⣳⡪⣫⣵⣿⣯⣿⢿⣷⣻⣖⣗⣻⣚⢥⡷⣕⣏⠶⠊⠄⣠⠰⠂⡄⠂ ⠄⠁
         │             ⠠⢂ ⠘⠐⣀ ⣀⢡⢐⠔⢫⠯⢕⠫⠿⣹⢶⣾⡻⣭⣽⢗⠿⣹⣛⣺⣿⠯⢲⡼⣵⢉⣭⢐⣟⡍⠄⠈⠥⠄   ⠁   ⠄
         │             ⠈⠂  ⠊⡀⡈⠢⡌⡠⠖⢤⠥⡑⣯⣾⣴⣯⡿⣯⣝⣯⣿⠧⣽⣒⢾⣼⣻⣛⣗⡹⡽⢪⠯⠒⡨⠈ ⠈⡐⢄ ⠂⠘⠠        ⠂
         │              ⠰  ⡀⠃⠁⠠ ⠉⡈⡨⡱⢍⠌⠷⣯⠫⠬⡙⣴⣯⡣⡟⡮⠩⣫⠿⢞⢵⡰⠞⡂⠴ ⠕⢀⡂⠁ ⢀ ⠤   ⠈
         │               ⢩⠂ ⠁⡄ ⢀⠲⢂⠑⢁⡘⠄⠵⣣⢑⢻⠨⡩⣌⠕⢮⣮⣋⢹⡁⣊⡃⠈⡕⡘⡠⠨⠄⡘⠨ ⠊⠁   ⠂
         │          ⠐     ⢀ ⠈⠐⠔⠈  ⠁⢀⣀⡃⣊⢁⡘⠁⠛⠨ ⠒⡑⡀⠵⢙⠄⠡⠢⠃⠄⠋⠅ ⠥⠁⠠⢀ ⠄
         │                  ⢀⢁ ⠆   ⠉⠁⠐ ⠄⠁⢑⡀⢀⠠⠑⢡⢊⠂⠑⠌⡅⠊⠄⠉⢈⡐  ⡀ ⠠   ⠂
         │                      ⢀   ⠑ ⠂  ⡁ ⠌⢠⠈⠂⠄⠉⡃⠈⠄   ⠂⠠⠁ ⠄  ⢀ ⠠
         │                             ⠐ ⠐ ⢁⠂⠂⠢⠠⠄⠔⠐       ⠁
         │                         ⠢  ⠁    ⠂⠐  ⠐       ⠐   ⠈
         │                           ⢀  ⠄⠈       ⠈
         │                                        ⠐
         │
         │
         │                                      ⠈
-4.271874└─────────────────────────────────────────────────────────────────────
          -4.08815                                                       3.79083
Histogram
Auto bin number
$ < examples/mvrnorm.json jp -x ..x -type hist
                                    684                                     1  [-3.27033,-2.69856)
                                   █████▌                                   2  [-2.69856,-2.12679)
                                   █████▌ 624                               3  [-2.12679,-1.55502)
                                   ███████████                              4  [-1.55502,-0.983254)
                               557 ███████████                              5  [-0.983254,-0.411485)
                             ▐████████████████                              6  [-0.411485,0.160285)
                             ▐████████████████                              7  [0.160285,0.732054)
                             ▐████████████████                              8  [0.732054,1.30382)
                             ▐████████████████                              9  [1.30382,1.87559)
                             ▐████████████████ 404                          10 [1.87559,2.44736)
                             ▐█████████████████████▌                        11 [2.44736,3.01913)
                         314 ▐█████████████████████▌                        12 [3.01913,3.5909]
                        ▄▄▄▄▄▟█████████████████████▌
                        ███████████████████████████▌
                        ███████████████████████████▌
                        ███████████████████████████▌
                        ███████████████████████████▌ 176
                        █████████████████████████████████
                    98  █████████████████████████████████
                  ▐██████████████████████████████████████ 79
    1     4   41  ▐███████████████████████████████████████████  14    4
  ▁▁▁▁▁▁▁▁▁▁▁█████████████████████████████████████████████████▁▁▁▁▁▁▁▁▁▁▁

    0     1    2     3    4     5    6     7    8     9   10    11   12
Fixed bin number
$ < examples/mvrnorm.json jp -x ..x -type hist -bins 5
                                         1652
                                    █████████████████
                                    █████████████████
                                    █████████████████
                                    █████████████████
                                    █████████████████
                                    █████████████████
                                    █████████████████
                                    █████████████████
                                    █████████████████
                                    █████████████████
                                    █████████████████
                                    █████████████████       728
                                    ██████████████████████████████████
                          541       ██████████████████████████████████
                   ▄▄▄▄▄▄▄▄▄▄▄▄▄▄▄▄▄██████████████████████████████████
                   ███████████████████████████████████████████████████
                   ███████████████████████████████████████████████████
                   ███████████████████████████████████████████████████
                   ███████████████████████████████████████████████████
         22        ███████████████████████████████████████████████████       57
  ▁▁▁▁▁▁▁▁▁▁▁▁▁▁▁▁▁███████████████████████████████████████████████████▄▄▄▄▄▄▄▄▄▄▄▄▄▄▄▄▄

  [-3.8421,-2.3555)[-2.3555,-0.8689)[-0.8689,0.6177)  [0.6177,2.1043)  [2.1043,3.5909]
2D Histogram (heatmap)
$ < examples/mvrnorm.json jp -xy '..[x,y]' -type hist2d

  3.3608│                   ····    ········    ····
        │                   ····    ········    ····
        │                   ····    ········    ····
        │                   ················    ····
        │                   ················    ····
        │           ································
        │           ································
        │       ················░░░░░░░░░░░░················
        │       ················░░░░░░░░░░░░················
        │       ············▒▒▒▒▓▓▓▓▒▒▒▒▒▒▒▒░░░░············
        │       ············▒▒▒▒▓▓▓▓▒▒▒▒▒▒▒▒░░░░············
        │···············▒▒▒▒▒▒▒▒▓▓▓▓▓▓▓▓▓▓▓▓▒▒▒▒············
        │···············▒▒▒▒▒▒▒▒▓▓▓▓▓▓▓▓▓▓▓▓▒▒▒▒············
        │       ········░░░░▓▓▓▓▓▓▓▓████▓▓▓▓▒▒▒▒············
        │       ········░░░░▓▓▓▓▓▓▓▓████▓▓▓▓▒▒▒▒············
        │       ········░░░░▓▓▓▓▓▓▓▓████▓▓▓▓▒▒▒▒············
        │   ············▒▒▒▒▒▒▒▒▓▓▓▓▓▓▓▓▒▒▒▒▒▒▒▒············
        │   ············▒▒▒▒▒▒▒▒▓▓▓▓▓▓▓▓▒▒▒▒▒▒▒▒············
        │       ············▒▒▒▒▒▒▒▒▒▒▒▒▒▒▒▒················
        │       ············▒▒▒▒▒▒▒▒▒▒▒▒▒▒▒▒················
        │           ····································
        │           ····································
        │               ····························
        │               ····························
        │               ····        ····        ····
        │               ····        ····        ····
        │                                   ····
        │                                   ····
 -4.0045└───────────────────────────────────────────────────
        -3.8421                                       3.5909
JSONLines input
If your data consists of whitespace-separated JSON values (known as JSONLines for newline separators), you can use the -s ("slurp") mode of jq to aggregate your data points into a single array before passing it to jp:
$ echo "[0,1]" "[1,2]" "[2,3]" | jq -s . | jp

 3.16│
     │                                                   ▄▄▀
     │                                               ▄▄▀▀
     │                                           ▄▄▀▀
     │                                      ▗▄▄▀▀
     │                                  ▗▄▞▀▘
     │                              ▗▄▞▀▘
     │                          ▗▄▞▀▘
     │                      ▗▄▞▀▘
     │                  ▗▄▞▀▘
     │              ▗▄▞▀▘
     │           ▄▄▀▘
     │       ▄▄▀▀
     │   ▄▄▀▀
     │▄▀▀
 0.94└──────────────────────────────────────────────────────
     0                                                     2
CSV input
$ < examples/sin.csv jp -input csv -xy '[*][0,1]'

  1.059955│       ▗▄▛▀▀▚▄▖                                    ▄▄▀▀▀▄▄
          │     ▗▞▘      ▝▚▖                                ▄▀      ▝▀▄
          │    ▟▘          ▝▄                             ▗▀          ▝▀▖
          │  ▗▛              ▚▖                          ▞▘             ▝▙
          │ ▄▘                ▀▖                        ▞                 ▚
          │▞▘                  ▝▌                     ▗▛                   ▚▖
          │                     ▝▚                   ▐▘                     ▝▄
          │                       ▜▖                ▟▘                       ▝▄
          │                        ▐▄             ▗▞                          ▝▚
          │                          ▚▖          ▄▀
          │                           ▀▙▖      ▄▛
          │                             ▀▀▄▄▄▞▀▘
 -1.059955└─────────────────────────────────────────────────────────────────────
          0                                                                 9.95
Screenshots
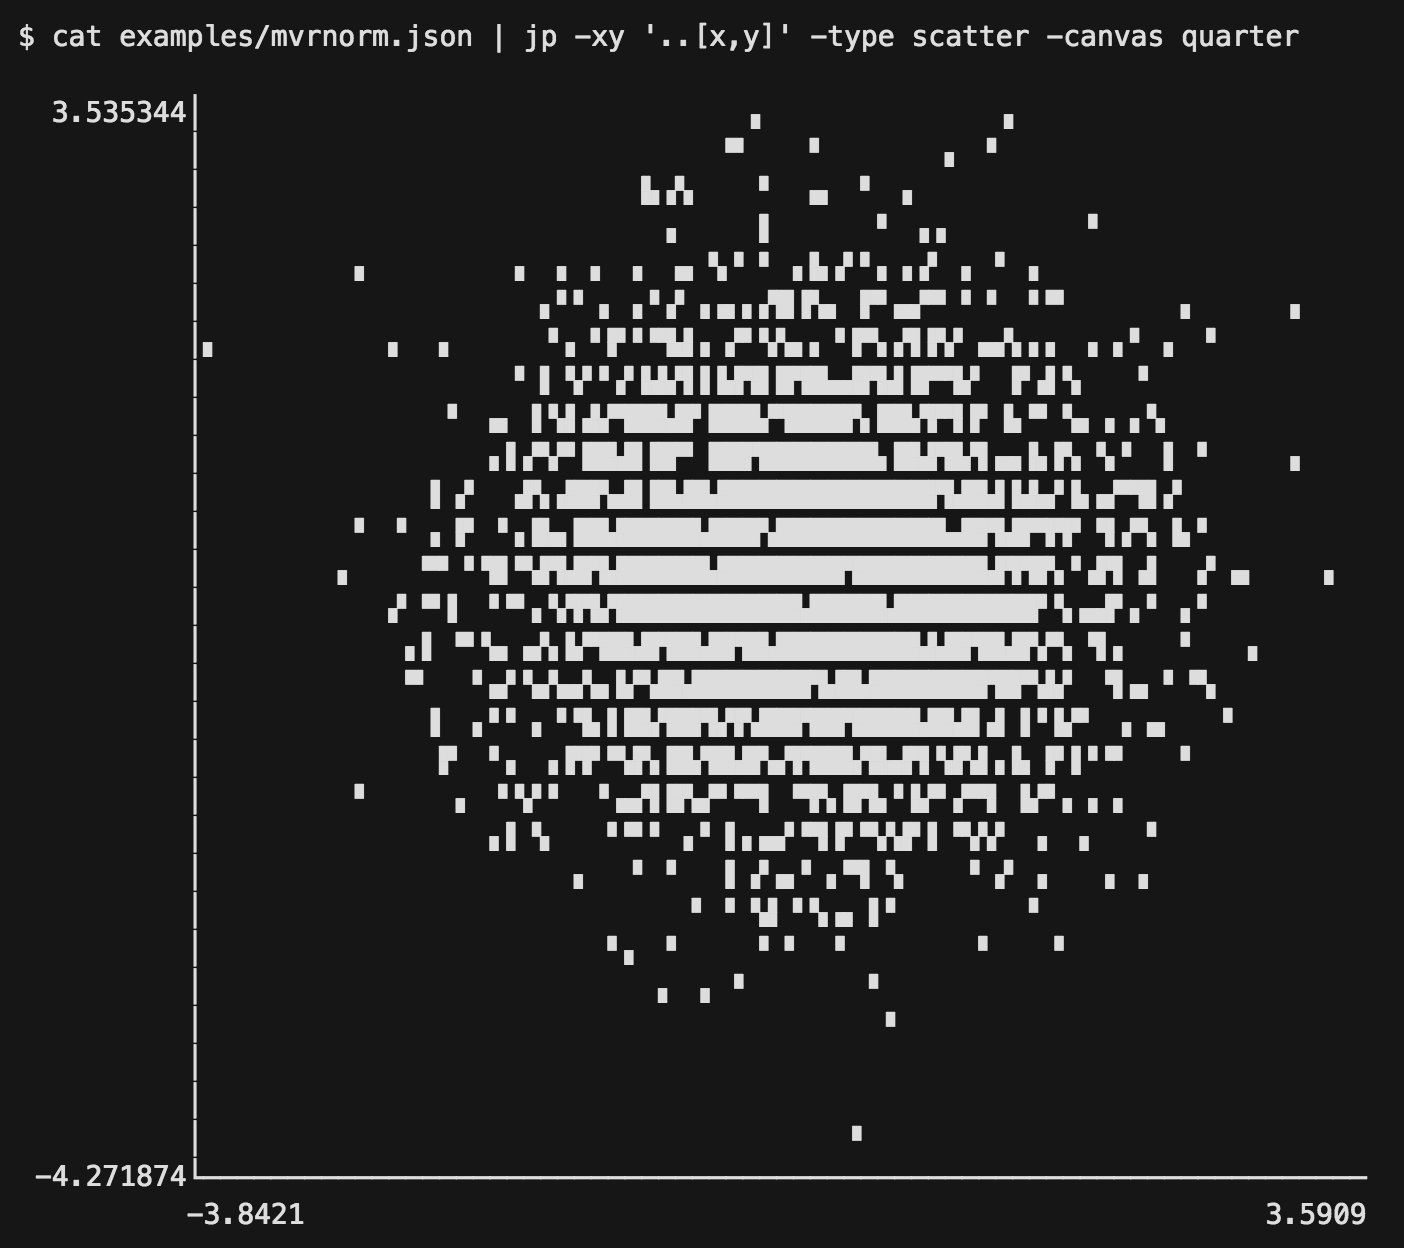
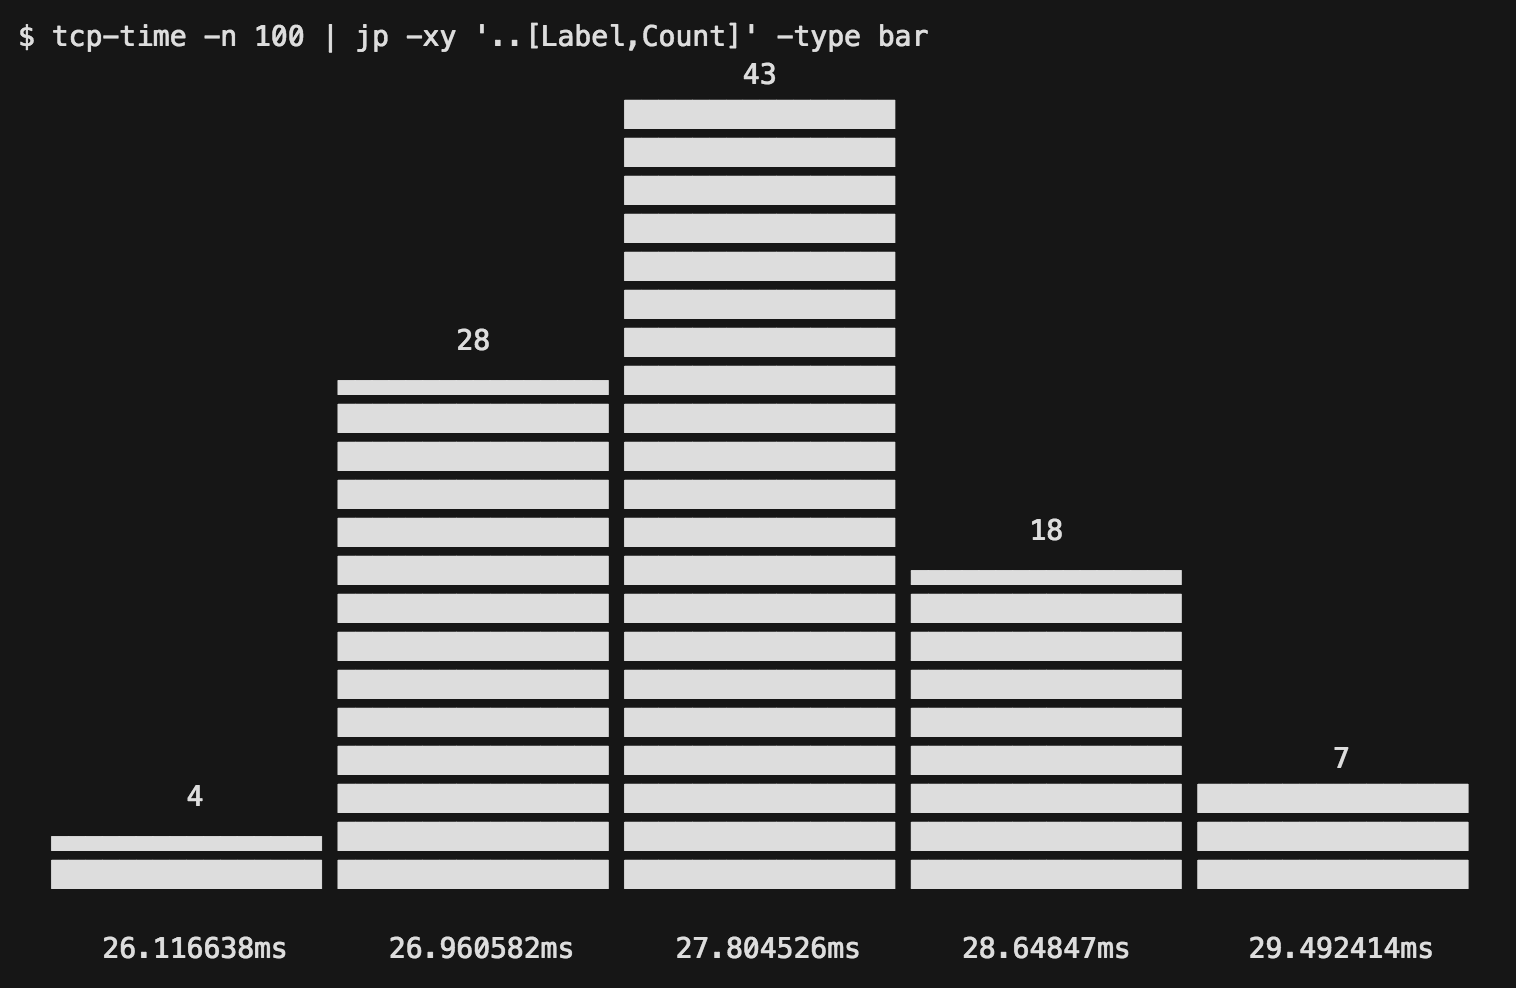
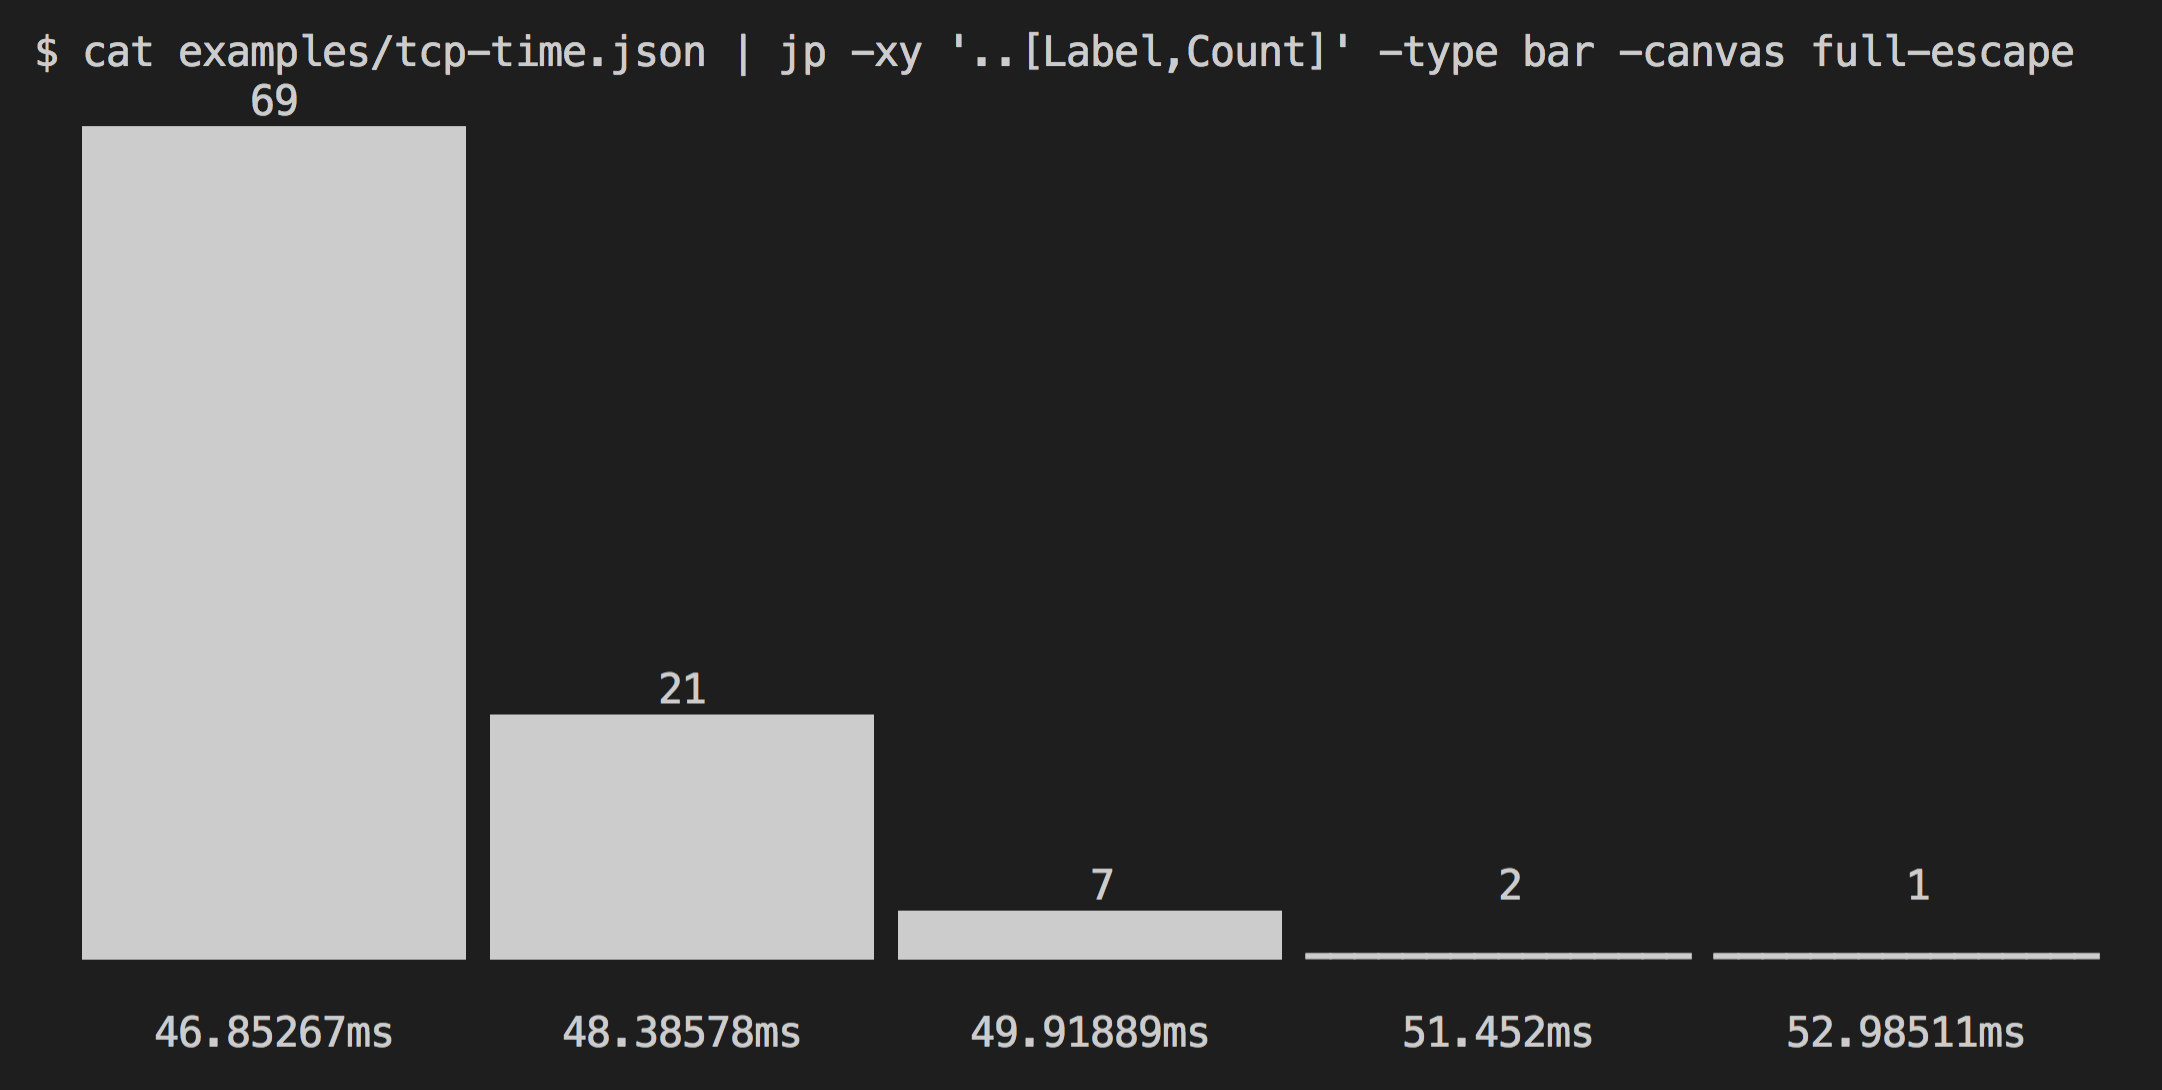
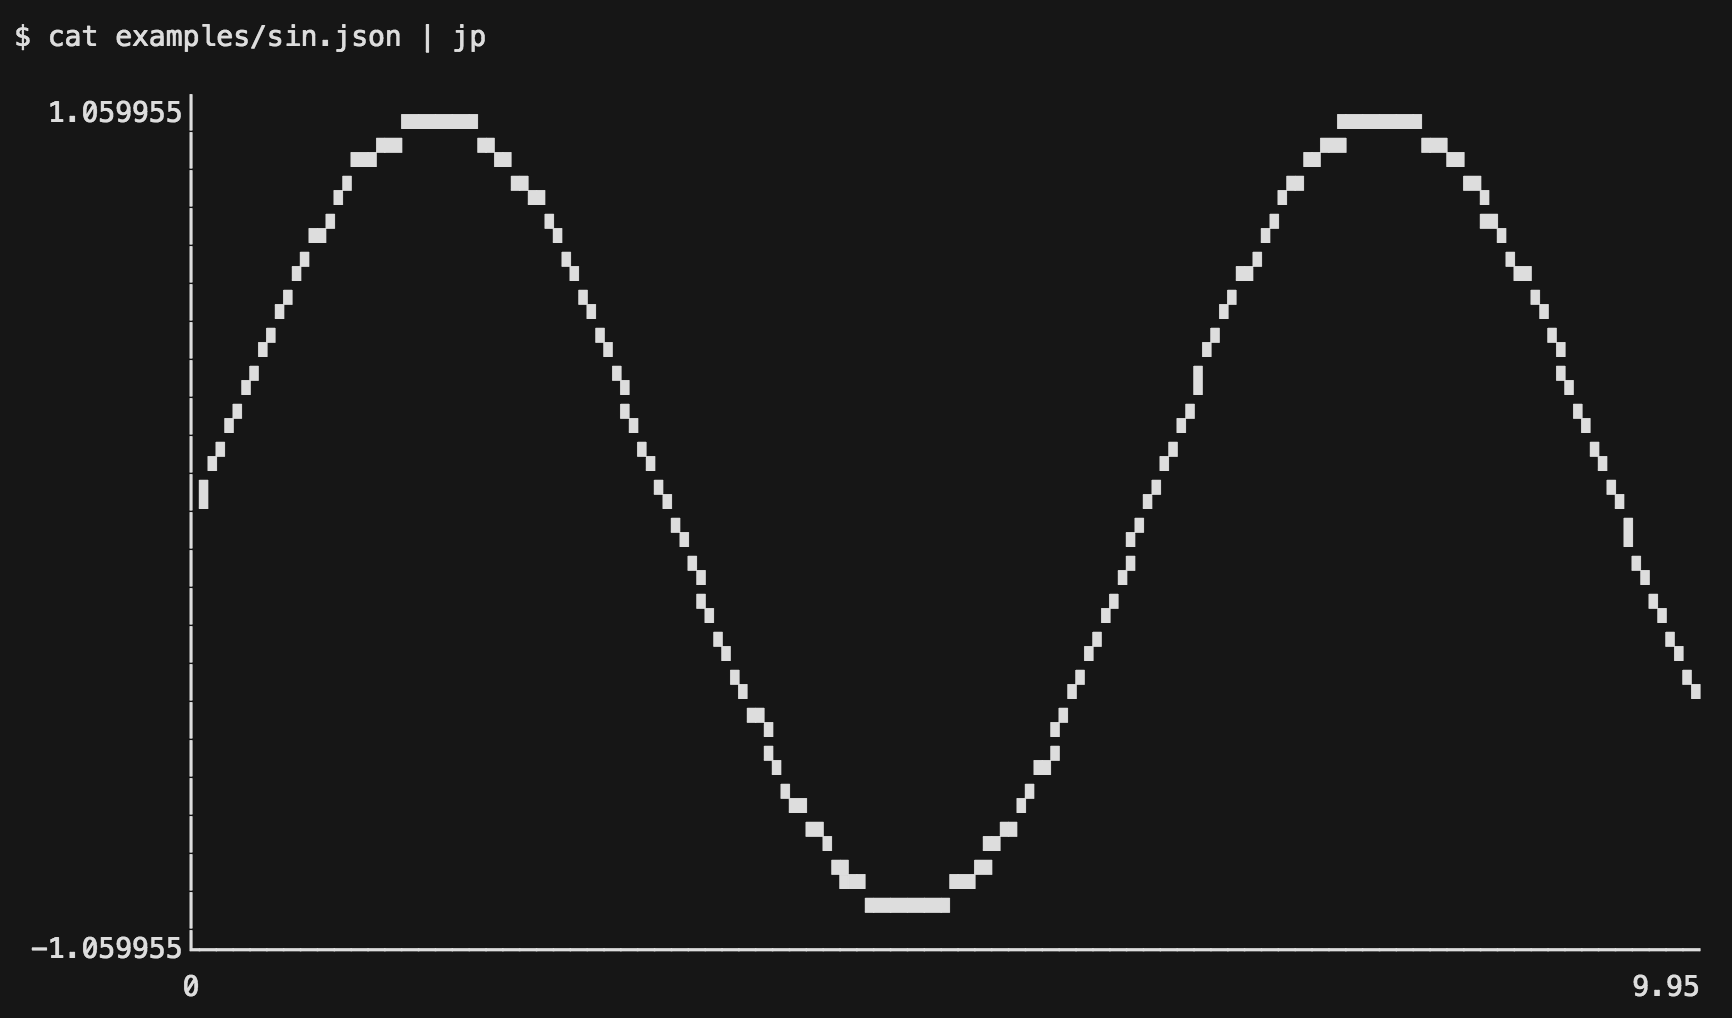
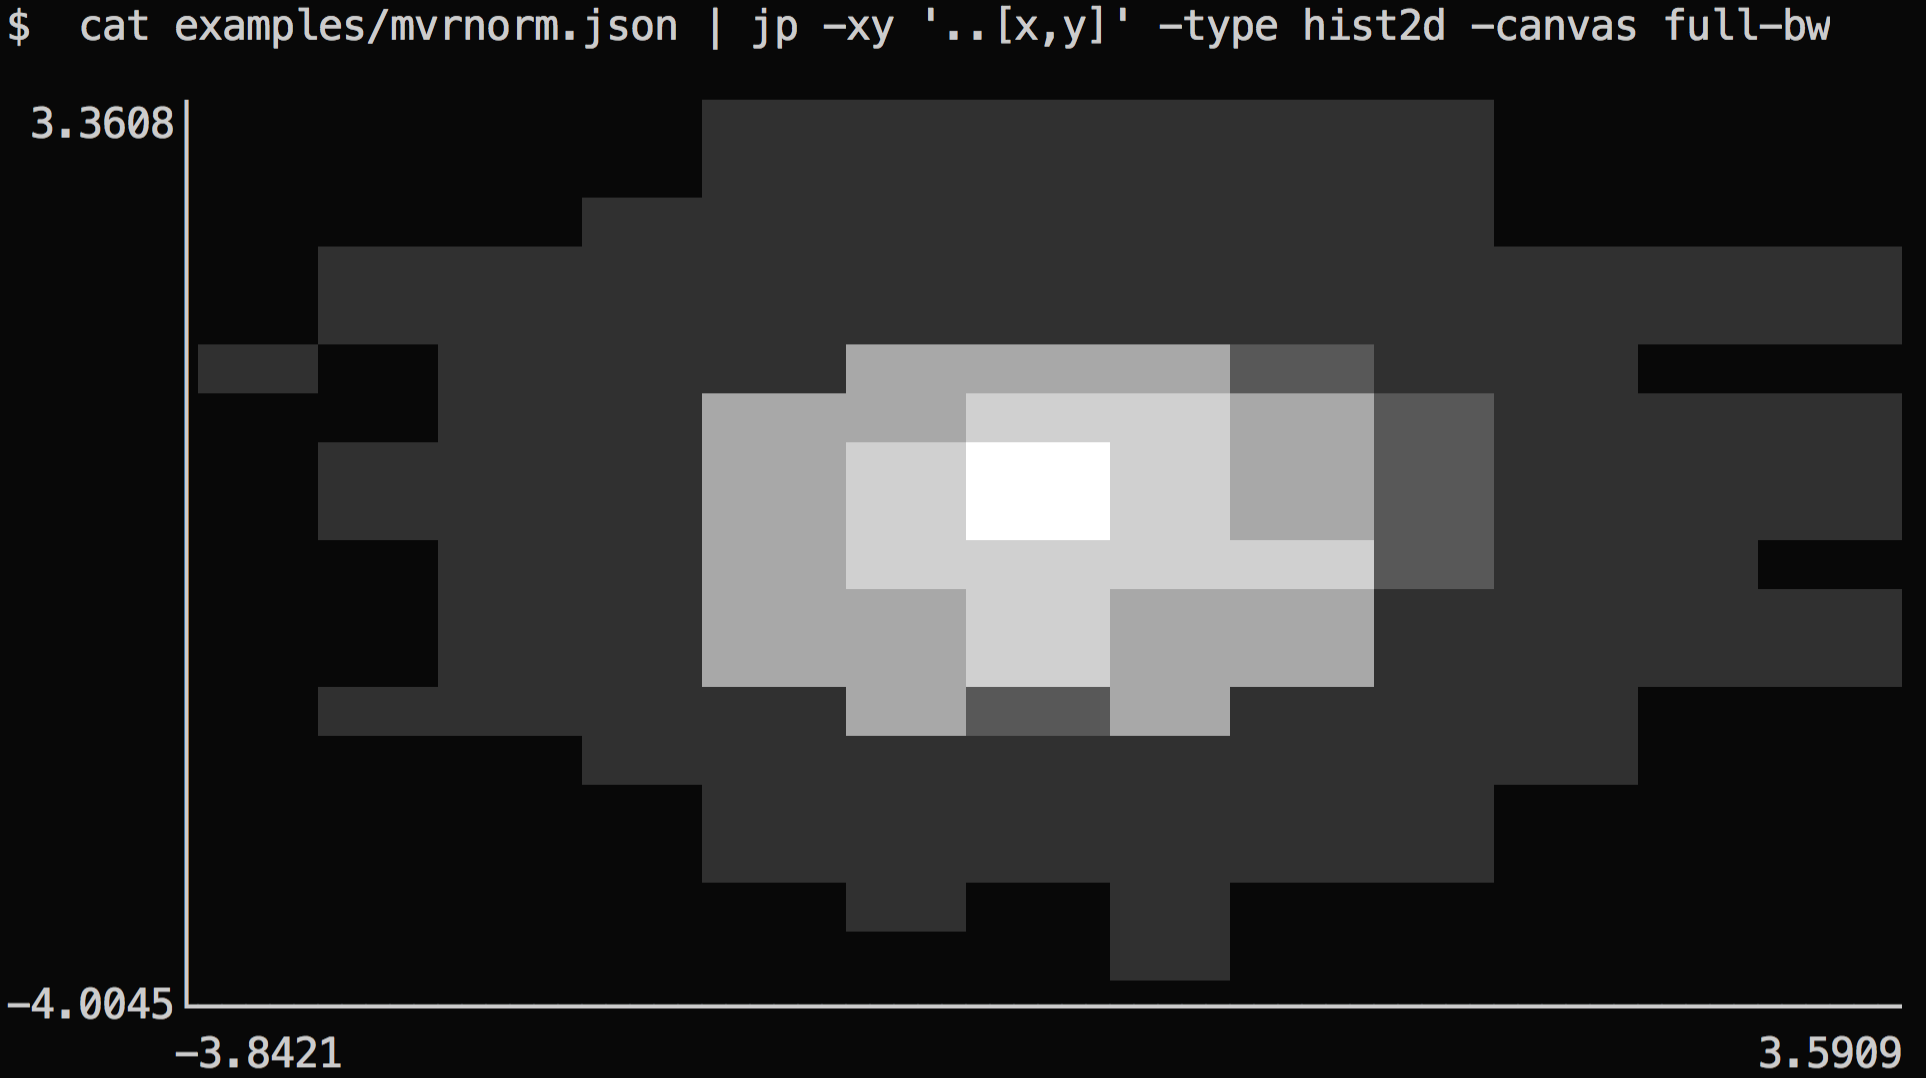
Licensing
- Any original code is licensed under the MIT License.
- Included portions of github.com/buger/goterm are licensed under the MIT License.
- Included portions of github.com/kubernetes/client-go are licensed under the Apache License 2.0.
Explore related projects
codecrafters-io/build-your-own-x
Master programming by recreating your favorite technologies from scratch.
560,836 starspublic-apis/public-apis
A collective list of free APIs
497,082 starsmorluto/rea
Reverse engineer anything with agents, from app behavior down to native binaries.
441,526 starsopenclaw/openclaw
The AI that really does things. Any OS. Any Platform. The lobster way. 🦞
394,157 stars