
selimfirat/pysad
selimfirat/pysad has 319 GitHub stars and 92 forks. Star changes are not measured yet. Last checked 2026-11-14 05:04 UTC. Last push 2026-11-13.
Measured star growth
- in 24h
- Collecting history
- in 7 days
- Collecting history
- in 15 days
- Collecting history
- in 1 month
- Collecting history
Net star changes over overlapping periods, not daily totals. Missing measurements are left blank. Stars measure attention, not software quality.
About
Streaming anomaly detection in Python: online detectors (xStream, LODA, RS-Hash, Half-Space Trees, RRCF…) plus calibration and prequential evaluation for real-time data.
Machine LearningREADME.md
OriginalEnglish · 简体中文

One pass. Every outlier.
Streaming anomaly detection in Python. PySAD scores each data point when it arrives,
with streaming detectors, calibrated alerts and streaming evaluation.










Documentation · Getting started · How-to guides · Benchmarks · Detectors · API · Live demo · Try it in Colab
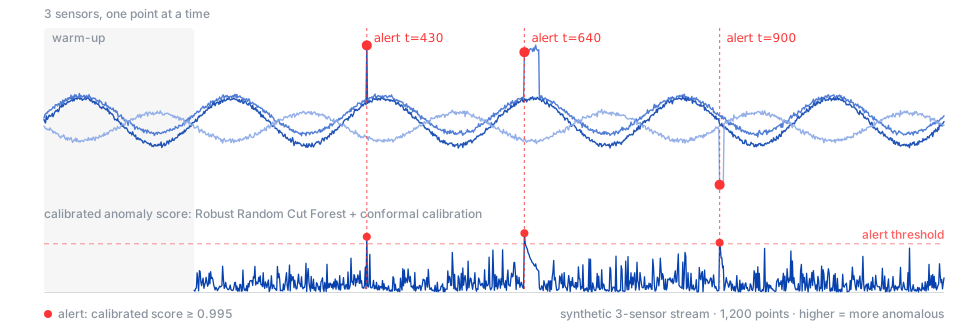
A Robust Random Cut Forest scores three synthetic sensors one point at a time. Conformal calibration converts each score into the fraction of recent scores that it exceeds, and raises an alert at 0.995.
Why PySAD
Batch detectors train on a fixed dataset. Streaming detectors update as points arrive, without waiting for a complete dataset. PySAD provides a common interface for scoring and learning from each point, including streams whose distribution changes over time (drift). More than 60 publications on Google Scholar cite it, and 30+ public repositories on GitHub use it.
Built for streamsEvery detector learns from and scores one point at a time with |
Detectors from published papersFrom robust statistics (MAD, Seasonal Hybrid ESD) to forests, sketches and projections (Half-Space Trees, Robust Random Cut Forest, RS-Hash, xStream, LODA). Each detector cites its paper, and the detector catalog lists its input and memory. |
From scores to alertsThe conformal calibrator converts a raw score into the fraction of recent scores that it exceeds. A threshold such as |
Evaluate on the streamStreamers replay data one point at a time, and 17 labeled benchmark datasets download on first use. Metrics such as AUROC, AUPR, precision and recall update after every point. |
Your batch models on a streamWrap any PyOD detector to train it again on a sliding window of recent points. |
A complete pipelinePreprocessors, random projections, score postprocessors, ensemblers and running statistics work with every detector. |
Batch outlier detectors such as PyOD can score new points after training, but need retraining to update what they have learned. PySAD detectors learn from every point, and PySAD can still run PyOD models on a stream with ReferenceWindowModel. General online learning frameworks such as River treat anomaly detection as one module among many. PySAD is only about streaming anomaly detection: its detectors come with calibration, postprocessing, ensembling and evaluation.
Installation
pip install pysad
Or with Conda / Mamba / Pixi:
conda install -c conda-forge pysad
PySAD supports Python 3.10 to 3.14 on Linux, macOS and Windows. Every detector works after installation, with no optional extras.
To install the latest development version from master:
pip install git+https://github.com/selimfirat/pysad.git
For an editable installation with development dependencies, follow the contributing guide.
Quick start


Score a stream point by point, and measure the detector while it runs:
import numpy as np
from pysad.evaluation import AUROCMetric
from pysad.models import LODA
from pysad.utils import ArrayStreamer

# A stream of 2,000 points with 4 features. Every 50th point is an anomaly.
rng = np.random.default_rng(42)
X = rng.normal(size=(2000, 4))
y = np.zeros(2000, dtype=int)
y[::50] = 1
X[y == 1, :2] += 3  # the code shifts the anomalies in two of the four features

model = LODA(random_state=0)
metric = AUROCMetric()

for x, label in ArrayStreamer().iter(X, y):
    score = model.fit_score_partial(x)  # score x, then learn from it
    metric.update(label, score)

print(f"AUROC: {metric.get():.3f}")  # prints AUROC: 0.960
Turn scores into alerts
A higher score means a more anomalous point, but raw scores have no fixed scale. The conformal calibrator converts each score into the fraction of recent scores that it exceeds. Continuing the example above, raise an alert when this value is close to 1:
from pysad.transform.probability_calibration import ConformalProbabilityCalibrator

model = LODA(random_state=0)
calibrator = ConformalProbabilityCalibrator(window_size=500)

alerts = []
for t, x in enumerate(ArrayStreamer().iter(X)):
    calibrated = calibrator.fit_transform_partial(model.fit_score_partial(x))
    if t >= 200 and calibrated >= 0.99:  # skip a short warm-up
        alerts.append(t)

# Prints: 20 alerts, 15 of them true anomalies
print(f"{len(alerts)} alerts, {y[alerts].sum()} of them true anomalies")
Stream your own data
A detector takes one NumPy array per point, so any loop works: a CSV reader, a socket or a message queue consumer.
import json

for message in consumer:  # for example, a Kafka consumer
    x = np.asarray(json.loads(message.value)["features"], dtype=float)
    score = model.fit_score_partial(x)
ArrayStreamer, PandasStreamer and PolarsStreamer replay arrays and pandas or Polars DataFrames as streams for experiments.
Use a PyOD model on a stream
Install PyOD first with pip install pyod.
from pyod.models.iforest import IForest
from pysad.integrations import ReferenceWindowModel

# Train a batch Isolation Forest on the last 200 points, again every 50 points.
model = ReferenceWindowModel(IForest, window_size=200, sliding_size=50, initial_window_X=X[:100])
for x in ArrayStreamer().iter(X[100:]):
    score = model.fit_score_partial(x)
Follow the getting started tutorial for a complete first workflow. Read concepts for the reasoning behind scoring, learning and calibration. Use the how-to guides for specific tasks and the API reference for classes, methods and parameters.
Detectors
Which detector to start with
| Your data | Start with | Why |
|---|---|---|
| One series of values with daily or weekly cycles | SeasonalHybridESD |
Removes the cycle. Earlier anomalies in the window have little effect on it |
| One series of values without a strong cycle | MedianAbsoluteDeviation |
Anomalies in the window have little effect on it. It uses only recent values, so it follows drift |
| Several features, first try | LODA |
Fast, has few parameters and learns from every point |
| Features with known value ranges | HalfSpaceTrees |
Constant time per point, scored against the previous window |
| Many features | xStream |
Projects the points to fewer features with hashing |
| Network traffic | KitNet |
Built for network intrusion detection. Gives 0 for the first 100 points by default |
| A PyOD model that you already use | ReferenceWindowModel |
Trains it again on a sliding window |
These starting points come from the design of each method. They are not benchmark rankings. The benchmark gives the results of each multivariate detector on 17 datasets. Compare two or three detectors on your own data, as the guide to choosing a detector shows.
All detectors
Multivariate
| Class | Method |
|---|---|
xStream |
xStream (Manzoor et al., KDD 2018) |
LODA |
Lightweight on-line detector of anomalies (Pevný, Machine Learning 2016) |
HalfSpaceTrees |
Half-Space Trees (Tan et al., IJCAI 2011) |
RobustRandomCutForest |
Robust Random Cut Forest (Guha et al., ICML 2016) |
RSForest |
RS-Forest random space tree density (Wu et al., ICDM 2014) |
RSHash |
RS-Hash subspace outlier detection (Sathe & Aggarwal, ICDM 2016) |
MStream |
MStream multi-aspect stream counts (Bhatia et al., WWW 2021) |
MemStream |
MemStream denoising autoencoder with FIFO memory (Bhatia et al., WWW 2022) |
MIDAS |
MIDAS edge counts of a graph stream (Bhatia et al., AAAI 2020) |
IForestASD |
Isolation Forest on sliding windows (Ding & Fei, IFAC 2013) |
OnlineIsolationForest |
Online Isolation Forest (Leveni et al., ICML 2024) |
PCBIsolationForest |
PCB-iForest isolation forest with performance counters and drift-triggered tree replacement (Heigl et al., Electronics 2021) |
KitNet |
KitNET ensemble of autoencoders (Mirsky et al., NDSS 2018) |
ExactStorm |
Exact-STORM distance-based outliers (Angiulli & Fassetti, CIKM 2007) |
ApproxStorm |
Approx-STORM distance-based outliers from a sample of the window (Angiulli & Fassetti, CIKM 2007) |
MCOD |
Micro-cluster-based distance-based outliers (Kontaki et al., ICDE 2011) |
NETS |
Set-based distance-based outliers on a cell grid (Yoon et al., PVLDB 2019) |
CPOD |
Core point-based distance-based outliers (Tran et al., PVLDB 2020) |
D3 |
Distance-based outliers from a kernel density over a chain sample of a window (Subramaniam et al., VLDB 2006) |
ThreshLEAP |
Distance-based outliers with minimal, newest-first probing (Cao et al., ICDE 2014) |
IncrementalLOF |
Incremental local outlier factor (Pokrajac et al., CIDM 2007) |
OnlineOneClassSVM |
Online one-class SVM, NORMA (Kivinen et al., IEEE TSP 2004) |
DILOF |
Density summarizing incremental LOF (Na et al., KDD 2018) |
KELOS |
Kernel density local outliers over micro-clusters of a window (Qin et al., EDBT 2019) |
AnyOut |
Anytime outliers by distance to the closest cluster of a ClusTree (Assent et al., DASFAA 2012) |
SDOstream |
Sparse data observers with exponential fading, a low-density stream model (Hartl et al., ESANN 2020) |
ADeMS |
Frequent Directions matrix sketch (Huang & Kasiviswanathan, VLDB 2015) |
LocalOutlierProbability |
Local Outlier Probabilities (Kriegel et al., CIKM 2009) |
Inqmad |
InQMAD quantum measurement density (Gallego-Mejia et al., ICDMW 2022) |
SmartSifter |
Finite mixtures with discounting learning (Yamanishi et al., KDD 2000) |
TEDA |
Typicality and eccentricity data analytics (Angelov, EALS 2014) |
EXPoSE |
Expected similarity to the kernel mean embedding (Schneider et al., Machine Learning 2016) |
Univariate
| Class | Method |
|---|---|
SeasonalHybridESD |
Seasonal Hybrid ESD (Hochenbaum et al., 2017) |
SeasonalESD |
Seasonal ESD (Hochenbaum et al., 2017) |
HTM |
Hierarchical Temporal Memory, the numenta detector of NAB, on timestamped values (Ahmad et al., Neurocomputing 2017) |
KNNCAD |
Conformalized k-NN anomaly detection (Burnaev & Ishimtsev, 2016) |
HoltWinters |
Holt-Winters forecasting with a seasonal confidence band and a failure window (Brutlag, USENIX LISA 2000) |
ChangeFinder |
Outlier and change point detection with discounting AR models (Takeuchi & Yamanishi, TKDE 2006) |
MatrixProfile |
Matrix profile discords with STAMPI (Yeh et al., ICDM 2016) |
DAMP |
Left matrix profile discords with a backward search that stops early (Lu et al., KDD 2022) |
SpectralResidual |
Spectral residual saliency over a sliding window (Ren et al., KDD 2019) |
RelativeEntropy |
Relative entropy over windows (Wang et al., IM 2011) |
SAND |
Streaming subsequence anomaly detection with k-Shape clusters (Boniol et al., PVLDB 2021) |
MedianAbsoluteDeviation |
Median absolute deviation over a sliding window (Hochenbaum et al., 2017) |
StandardAbsoluteDeviation |
Running 3-sigma rule (Hochenbaum et al., 2017) |
OeSNNUAD |
Online evolving spiking neural network for unsupervised anomaly detection (Maciąg et al., Neural Networks 2021) |
PEWMA |
Probabilistic exponentially weighted moving average (Carter & Streilein, SSP 2012) |
ReferenceWindowModel and OneFitModel run any PyOD detector on a stream. The detector catalog lists the input, setup and memory of each detector, and the API reference lists every parameter.
Benchmarks
PySAD benchmarks its detectors on labeled data. The multivariate detectors run on 17 datasets from the ODDS repository and on 8 real streams with drift. The univariate detectors run on the series of the Numenta Anomaly Benchmark (NAB) and of the UCR archive. Each detector runs once on each dataset, with its default parameters, and scores each point before it learns from it (fit_score_partial).
The benchmark results page shows all the results. The evaluation methodology explains the steps, the metrics and the limits of the results, and the datasets page describes the data. To run the benchmark, use python benchmarks/benchmark.py, as Run the benchmark shows. On each pull request that changes a detector, CI runs a short form of the benchmark and lists the results that moved.
Beyond detectors
| Stage | What PySAD provides |
|---|---|
| Preprocessing | InstanceStandardScaler, InstanceUnitNormScaler, SeasonalTrendDecomposer, ModifiedSTLResidualTransformer, OneShotSTL |
| Projection | StreamhashProjector, GaussianRandomProjector, SparseRandomProjector |
| Postprocessing | Running and windowed average, max, median and z-score of scores, and QuantileFilter for 0/1 labels |
| Calibration | AnomalyLikelihoodProbabilityCalibrator, ConformalProbabilityCalibrator, GaussianTailProbabilityCalibrator, SPOTProbabilityCalibrator |
| Ensembling | Average, maximum, median, average-of-maximum and maximum-of-average score ensemblers |
| Evaluation | AUROCMetric, AUPRMetric, PrecisionMetric, RecallMetric, WindowedMetric |
| Streaming data | ArrayStreamer, PandasStreamer, PolarsStreamer, and Data for 17 labeled ODDS benchmark datasets, downloaded on first use |
| Statistics | Running mean, variance, median, min, max, sum and count |
Contributing
We welcome issues and pull requests, and we aim to reply within a few days. Ask questions and share your projects in Discussions. For a first contribution, choose a good first issue. The contributing guide lists the steps from the first clone to an open pull request.
PySAD follows semantic versioning and trunk-based development. Each change reaches master through a short-lived branch and a pull request that CI checks, and CI runs every example.
Thanks to everyone who has reported a bug, fixed one, or improved the docs.
Citing PySAD
If you use PySAD in a scientific publication, cite the paper:
@article{pysad,
  title={PySAD: A Streaming Anomaly Detection Framework in Python},
  author={Yilmaz, Selim F and Kozat, Suleyman S},
  journal={arXiv preprint arXiv:2009.02572},
  year={2020}
}
To cite a specific version of the software, use its Zenodo DOI. The DOI 10.5281/zenodo.22983312 always points to the latest release. That page also lists a separate DOI for each release.
License
PySAD is free software under the BSD 3-Clause License.

If PySAD is useful to you, a star helps other people find it.
To hear about new detectors and releases, choose Watch → Custom → Releases.
Explore related projects
tensorflow/tensorflow
An Open Source Machine Learning Framework for Everyone
201,591 starshuggingface/transformers
🤗 Transformers: the model-definition framework for state-of-the-art machine learning models in text, vision, audio, and multimodal models, for both inference and training.
168,957 starsAUTOMATIC1111/stable-diffusion-webui
Stable Diffusion web UI
165,308 starsComfy-Org/ComfyUI
The most powerful and modular diffusion model GUI, api and backend with a graph/nodes interface. The fastest local inference engine in the world.
146,734 stars