
productdevbook/nabiz has 39 GitHub stars and 3 forks. GitHot measured 0 stars in 24 hours, 0 in 7 days, and 0 in 15 days. Last checked 2026-11-09 22:04 UTC. Last push 2026-08-20.
A status page that keeps beating when your server does not — one Cloudflare Worker, or one container you own. Astro, a probe a minute, D1 or SQLite.
What you can do
- One probe per monitor per minute: method, expected status, timeout, optional body match.
- Anti-flap: a watched monitor is called down after fail_threshold consecutive failures (default 2); recovery is immediate, and a monitor that is already down when first seen is believed at once.
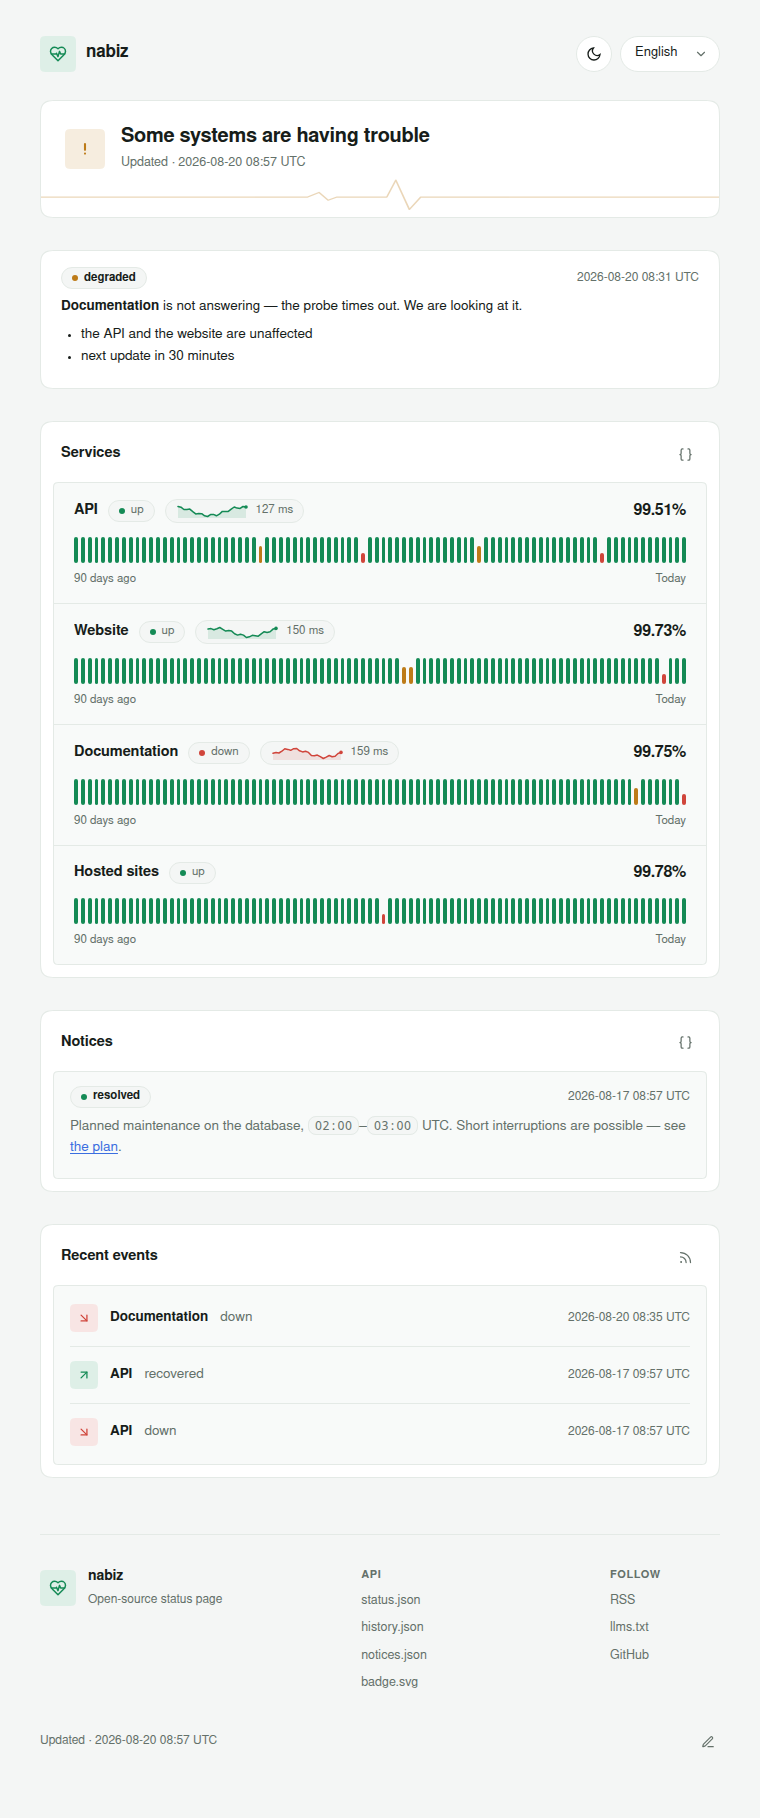
- 90-day uptime bars, and a latency sparkline once there are probes in two different hours — it averages by the hour, so a fresh deployment has no waveform until the clock crosses one.
- Grouped monitors: one row saying how the group is, never how many it speaks for and never their names.
Measured star growth
- in 24h
- 0
- in 7 days
- 0
- in 15 days
- 0
- in 1 month
- Collecting history
Net star changes over overlapping periods, not daily totals. Missing measurements are left blank. Stars measure attention, not software quality.
README.md
Original
nabiz
A status page that keeps beating when your server does not —
one Cloudflare Worker, or one container on a machine you own.




What it is
Astro renders the page, a probe checks every monitor once a minute, and
the history lives in a database next to it. On Cloudflare that is one
Worker with a cron trigger and D1, inside the free tier. On your own
hardware it is one container with an interval and a SQLite file — same
source, same schema. nabız is Turkish for "pulse"; the ASCII spelling
nabiz is used throughout.
Documentation
| Cloudflare | deploying the Worker, custom hostname, limits |
| Self-hosting | Docker, compose, from a checkout |
| Kubernetes | manifests, one replica, seeding in-cluster |
| Monitors | the rows that say what is watched |
| Configuration | every variable, on both runtimes |
| API | JSON, RSS, badge, notices, machine access |
| Upgrading | schema additions, moving between runtimes |
| Installing with an agent | a runbook: commands, checks, and what each error means |
Features
- One probe per monitor per minute: method, expected status, timeout, optional body match.
- Anti-flap: a watched monitor is called down after
fail_thresholdconsecutive failures (default 2); recovery is immediate, and a monitor that is already down when first seen is believed at once. - 90-day uptime bars, and a latency sparkline once there are probes in two different hours — it averages by the hour, so a fresh deployment has no waveform until the clock crosses one.
- Grouped monitors: one row saying how the group is, never how many it speaks for and never their names.
- Operator notices in markdown, with severity and per-language targeting.
- Alerts to Telegram and a webhook on state changes.
- Six languages (en, tr, de, es, fr, zh-CN), light and dark, auto-refresh.
- JSON API, RSS feed, SVG badge,
llms.txt.
Not included: incident timelines, subscriber emails, multi-region probes.
Quick start
On your own machine
docker run -d --name nabiz -p 8080:8080 -v nabiz:/data \
  -e NABIZ_TITLE="status" -e ADMIN_TOKEN="$(openssl rand -hex 32)" \
  ghcr.io/productdevbook/nabiz:latest
On Cloudflare
git clone https://github.com/productdevbook/nabiz && cd nabiz && bun install
bunx wrangler d1 create nabiz                        # id goes into wrangler.toml
bunx wrangler d1 execute nabiz --remote --file schema.sql
bun run deploy
Either way the page comes up empty and working — a heading with nothing
under it is the correct first sight. Monitors are rows you add next, and
the first bar appears within one probe interval: see
Monitors. Keep the token you generated above; it is what lets you write notices.
Nothing on the page prints it again — docker inspect nabiz will, which
is also a reason not to leave it on a machine other people can reach.
Development
bun install
bunx wrangler d1 execute nabiz --local --file schema.sql   # once
bun run dev                                                # :4321, local D1
bun run check                                              # what CI runs
Everything under src/lib/ is plain TypeScript against a narrow database
interface (src/lib/db.ts) that D1 already satisfies and SQLite is made to
(src/lib/sqlite.ts). That seam is the whole difference between the two
runtimes: the page, the probes and the state machine are one copy.
License
MIT. Icons from Lucide (ISC).
Explore related projects
awesome-selfhosted/awesome-selfhosted
A list of Free Software network services and web applications which can be hosted on your own servers
335,506 starsimmich-app/immich
High performance self-hosted photo and video management solution.
118,568 starsStirling-Tools/Stirling-PDF
#1 PDF Application on GitHub that lets you edit PDFs on any device anywhere
96,149 starslouislam/uptime-kuma
A fancy self-hosted monitoring tool
93,389 stars