
ossianericson/netsentinel
ossianericson/netsentinel has 31 GitHub stars and 3 forks. GitHot measured 0 stars in 24 hours, +1 in 7 days, and +3 in 15 days. Last checked 2026-11-13 20:04 UTC. Last push 2026-10-11.
Measured star growth
- in 24h
- 0
- in 7 days
- +1
- in 15 days
- +3
- in 1 month
- Collecting history
Net star changes over overlapping periods, not daily totals. Missing measurements are left blank. Stars measure attention, not software quality.
About
Find every device on your network, catch the faults that cause dropouts, and prove an outage to your ISP — all in one local desktop app. Rogue bridge & broadcast storm detection, ARP spoof watch, port scanning, CVE lookup, stability logging. 100% local, no telemetry.
Self-hostedREADME.md
Original






NetSentinel
Find every device on your network, catch the faults that cause dropouts, and prove an outage to your ISP — all in one local app.
Rogue bridge and broadcast storm detection, ARP spoof monitoring, port scanning and CVE lookup, and continuous stability logging. Free, open-source, and 100% local — no account, no telemetry, no cloud.
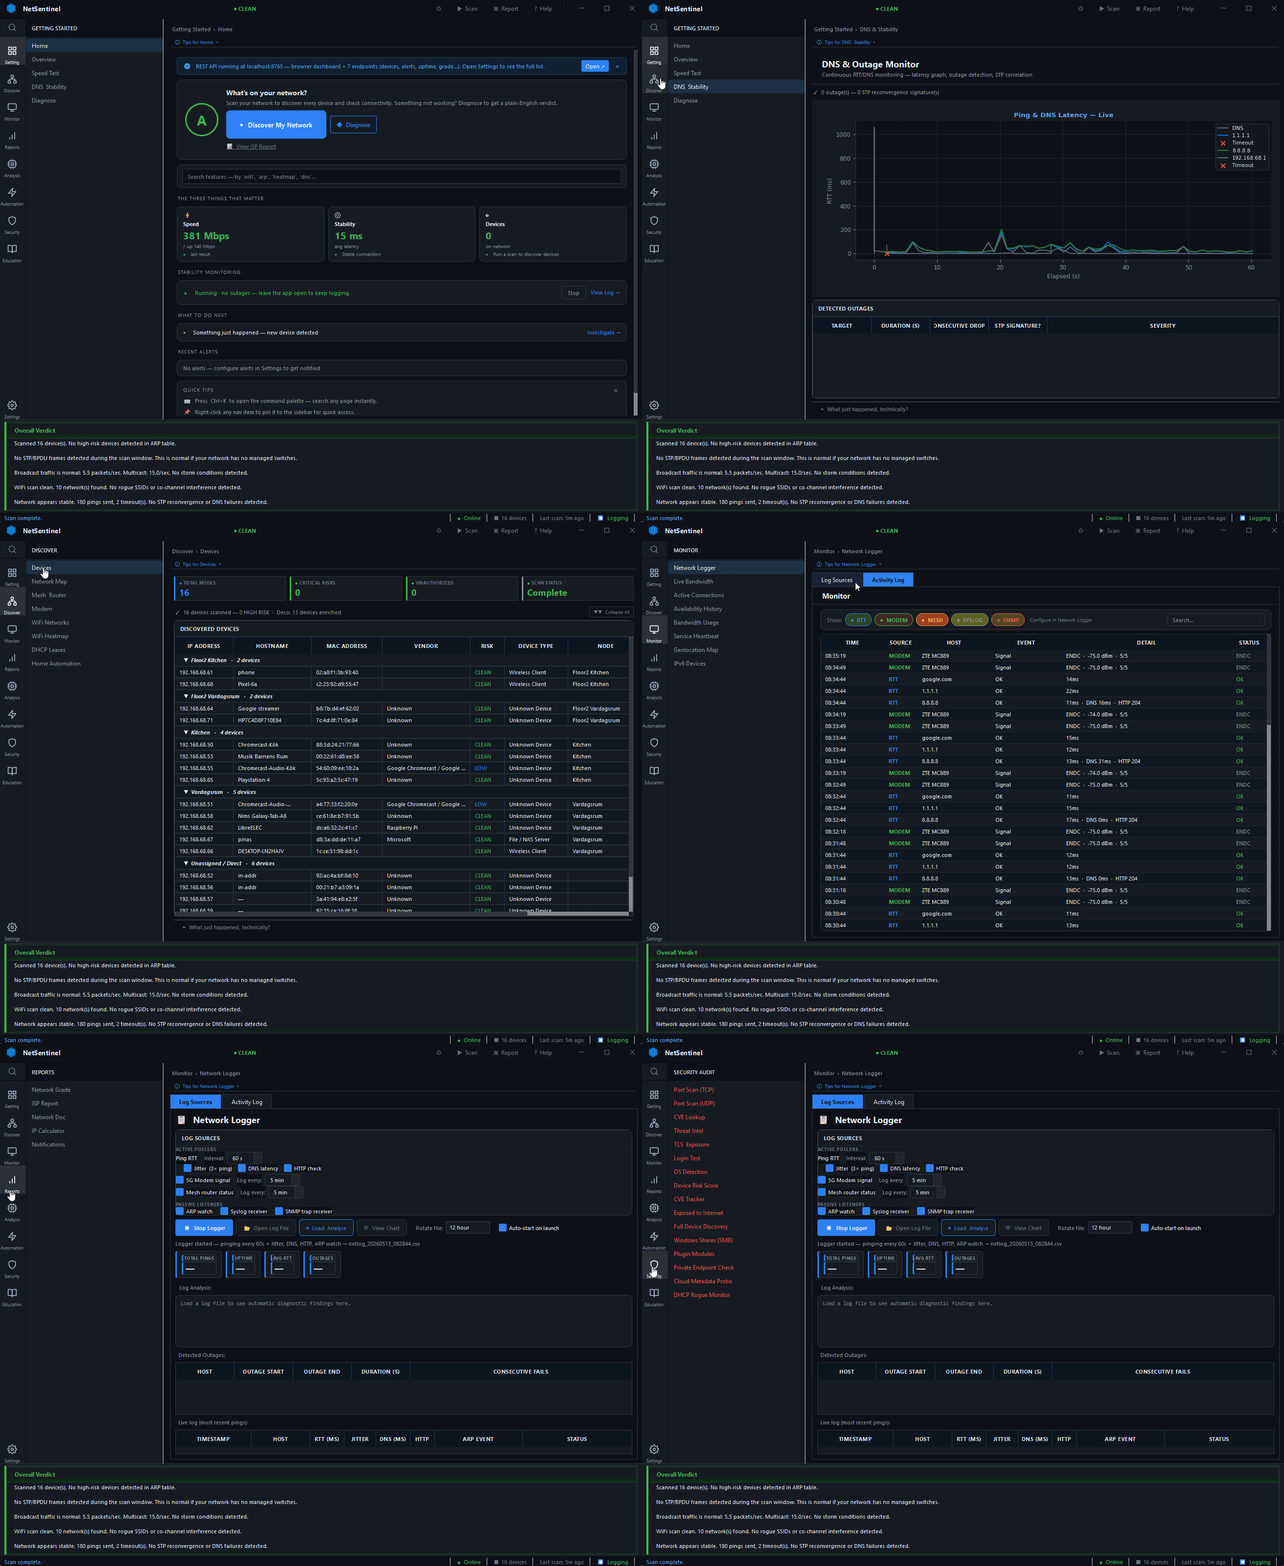
68 tools in one app · ~150,000 lines of Python — discovery, monitoring, diagnostics, security audit, automation, and education, in a single local desktop app.
8,306 tests · 15-hour chaos-tested · 100% local · MIT License
At a glance
| Discover | Device inventory with vendor/model ID, topology map, Wi-Fi scan, DHCP/DNS-zone mapping |
| Monitor | Live bandwidth, availability history, background stability logger, syslog + SNMP traps |
| Diagnose | One-click "What's Wrong?" triage, Root Cause Correlator, Service Diagnostics |
| Report | Network grade A–F, ISP Accountability Report, one-click network documentation export |
| Audit | Port scan, CVE lookup, TLS monitor, credential testing, OS detection (admin + Npcap) |
| Automate | Read-only REST API, MQTT / Home Assistant, shell hooks, scheduled scans |
| Learn | Interactive protocol visualizer + guided Lab Mode, mapped to CompTIA Network+ / CCNA |
What it answers
| Your question | Where NetSentinel answers it |
|---|---|
| "What is that unknown device on my Wi-Fi?" | Devices — full inventory with IP, MAC, hostname, vendor, model and risk level for everything on the LAN |
| "Why does my internet drop every 30–45 seconds?" | Rogue Bridge (STP) — captures BPDUs and names the device that stole the root bridge role, a classic cause of repeating short outages |
| "Is it my ISP or my router?" | Root Cause Correlator — a hop-by-hop ping chain isolates where the loss actually starts, then states a plain-English verdict |
| "How do I prove this outage to support?" | ISP Accountability Report — traceroute table, packet-loss percentages, DNS latency and a timestamped outage log as one exportable HTML file |
| "Something is slow and I don't know what" | What's Wrong? — one click sequences DNS, storm, STP and ISP checks, then ranks the findings by likely cause |
| "Is anything of mine exposed?" | Security Overview — port scan, OS fingerprint, CVE lookup, TLS expiry and credential testing, with a letter grade summarising your posture |
| "Which app is eating my bandwidth?" | App Traffic and Active Connections — per-application breakdown plus a process-to-socket map with one-click firewall block |
| "Is someone spoofing my gateway?" | ARP Spoof Watch — real-time detection of the IP–MAC conflicts that indicate an active man-in-the-middle |
| "Why won't this one service load?" | Service Diagnostics — DNS/TCP/HTTPS/traceroute probes against any host, classifying which layer failed (including "filtered" — blocked despite a healthy ping) |
Why this exists
A Google Nest speaker connected via Ethernet was winning the STP root bridge election on a local network. Every 30–45 seconds it forced the router to block its own uplink port and reconverge — producing exactly the intermittent drops and DNS failures ISP helpdesks dismiss as "Wi-Fi interference." Tracking it down required five separate tools and produced no shareable evidence.
NetSentinel handles discovery, Layer 2 detection, long-term logging, and report generation in one place — and exports everything in a format a support technician can actually read.
Replaces: Nmap (device discovery, port scanning), Wireshark (broadcast storm and ARP monitoring), PingPlotter/MTR (stability logging, outage evidence), Wi-Fi analyzer apps, and the manual grind of assembling ISP support documentation.
Install
Windows — three options:

winget install NetSentinel.NetSentinel
Or download the installer from the latest release.
macOS / Linux — download the binary from the latest release, or run from source:
git clone https://github.com/ossianericson/netsentinel
cd netsentinel
pip install -r requirements.txt
sudo python app.py
Layer 2 features (STP detection, ARP monitor, broadcast storm analysis) require Npcap on Windows or libpcap on macOS/Linux. See platform setup notes for full details.
Features
Entries marked † need Administrator plus Npcap on Windows or libpcap on macOS/Linux. Everything else runs unprivileged.
Discover
- Device discovery — every device's IP, MAC, hostname, vendor, model, and risk level; vendor lookup via a curated local table, scapy's bundled ~50,000-entry OUI database, and a live API fallback
- Network topology map — interactive Cytoscape.js diagram; upgrades to a mesh tree when Deco credentials are configured
- Wi-Fi scan — hidden SSIDs, rogue APs, WPS-enabled networks, co-channel interference, signal levels
- DHCP lease inventory — lists active leases from the OS lease table (for rogue-server detection, see DHCP Rogue Monitor under Audit)
- Full device discovery † — parallel ARP + ICMP + TCP SYN + mDNS sweep
Monitor
- Background stability logger — continuous ping/RTT/jitter/DNS logging; timestamped CSV evidence; unattended for hours or days
- Availability history — persistent UP/DEGRADED/DOWN charts per device with 1 h / 12 h / 24 h / 7 d zoom
- Live bandwidth chart — 60-second rolling upload/download per interface
- Active connections — process-to-socket map with one-click firewall block/unblock per process
- IoT behaviour baseline — learns normal traffic per IoT device; alerts on port scans, new destinations, and traffic rate spikes
- TLS certificate monitor — hourly expiry checks per host; 30-day pre-expiry alerts
- Per-device bandwidth † — exact rx/tx bps per device via live packet capture
- 802.11 monitor mode † — passive frame capture: probe requests, association frames, deauth frames
Diagnose
- Service diagnostics — DNS/TCP/HTTPS/ICMP/traceroute probes for streaming/gaming services or any custom hostname; failure-layer classification (device → local_network → dns → isp → routing → remote_outage → filtered)
- DNS benchmarking — compares your system resolver against Cloudflare, Google, and Quad9 simultaneously; includes DNS leak test
- Speed test — 3-tier engine: Ookla CLI → speedtest-cli → pure-Python fallback; always works, no forced dependencies
- STP root bridge detection † — captures BPDUs; identifies which device claims the root bridge election on your segment
- Broadcast storm detection † — measures flood levels; pinpoints the source device
- ARP spoofing detection † — watches for IP–MAC conflicts that indicate an active MITM attack
Report
- Network grade A–F — benchmark across uptime, latency, jitter, DNS speed, download speed, STP health, storm level, and device safety; compared to a "perfect home network" baseline
- ISP Accountability Report — traceroute hop table, DNS latency, and timestamped outage log as a standalone HTML file for support escalation
Audit
- CVE lookup — cross-references discovered OS and service versions against the NVD database on demand
- Threat intelligence and risk scoring — reputation lookups for the addresses your devices talk to, plus a per-device risk score
- Rogue DHCP detection and SMB share enumeration — flags unauthorised DHCP servers on the wire and exposed Windows shares
- SYN stealth port scanner † — half-open TCP scan; faster and quieter than a connect scan
- OS fingerprinting † — infers operating system and version from probe responses; reuses prior port-scan results rather than re-scanning
- Credential testing † — checks SSH, SMB, FTP and Telnet for default and weak logins on devices you own
Automate
- REST API — read-only local HTTP API at
http://127.0.0.1:8765; query devices, alerts, and uptime from Home Assistant or scripts - MQTT / Home Assistant — Discovery payloads, configurable broker, OS-keychain credentials
- Automation hooks — shell command triggers on device-down, high RTT, and new-device events
Hardware integrations
10 bundled plugins cover TP-Link Deco, Ubiquiti UniFi, AVM FRITZ!Box, ZTE 5G modem, MikroTik, OpenWrt, Netgear, ASUS, Synology, and Home Assistant. Any Python script that implements get_info() and get_status() becomes a first-class integration — with a Hub card, health tracking, circuit breaker, plugin log console, and sandboxed execution.
→ Hardware integrations reference
For educators and students
Every result maps directly to a protocol covered in CompTIA Network+ and CCNA curricula. Concepts visible in real time on your own network:
- ARP — ARP Spoof Watch shows every request and reply; the device table shows your current MAC-to-IP mapping
- STP — Rogue Bridge tab captures BPDUs; identifies root bridge, port roles, and reconvergence timing
- DNS — DNS & Connectivity graphs resolver latency live; DNS leak test shows which resolver handles your queries
- TCP — Port Scanner and Active Connections show handshake outcomes and live socket states per process
- DHCP — DHCP Lease Inventory parses the OS lease table; DHCP Rogue Monitor separately flags unauthorized DHCP servers on the wire
- ICMP — Stability Logger and Availability History plot RTT and packet loss across days or weeks
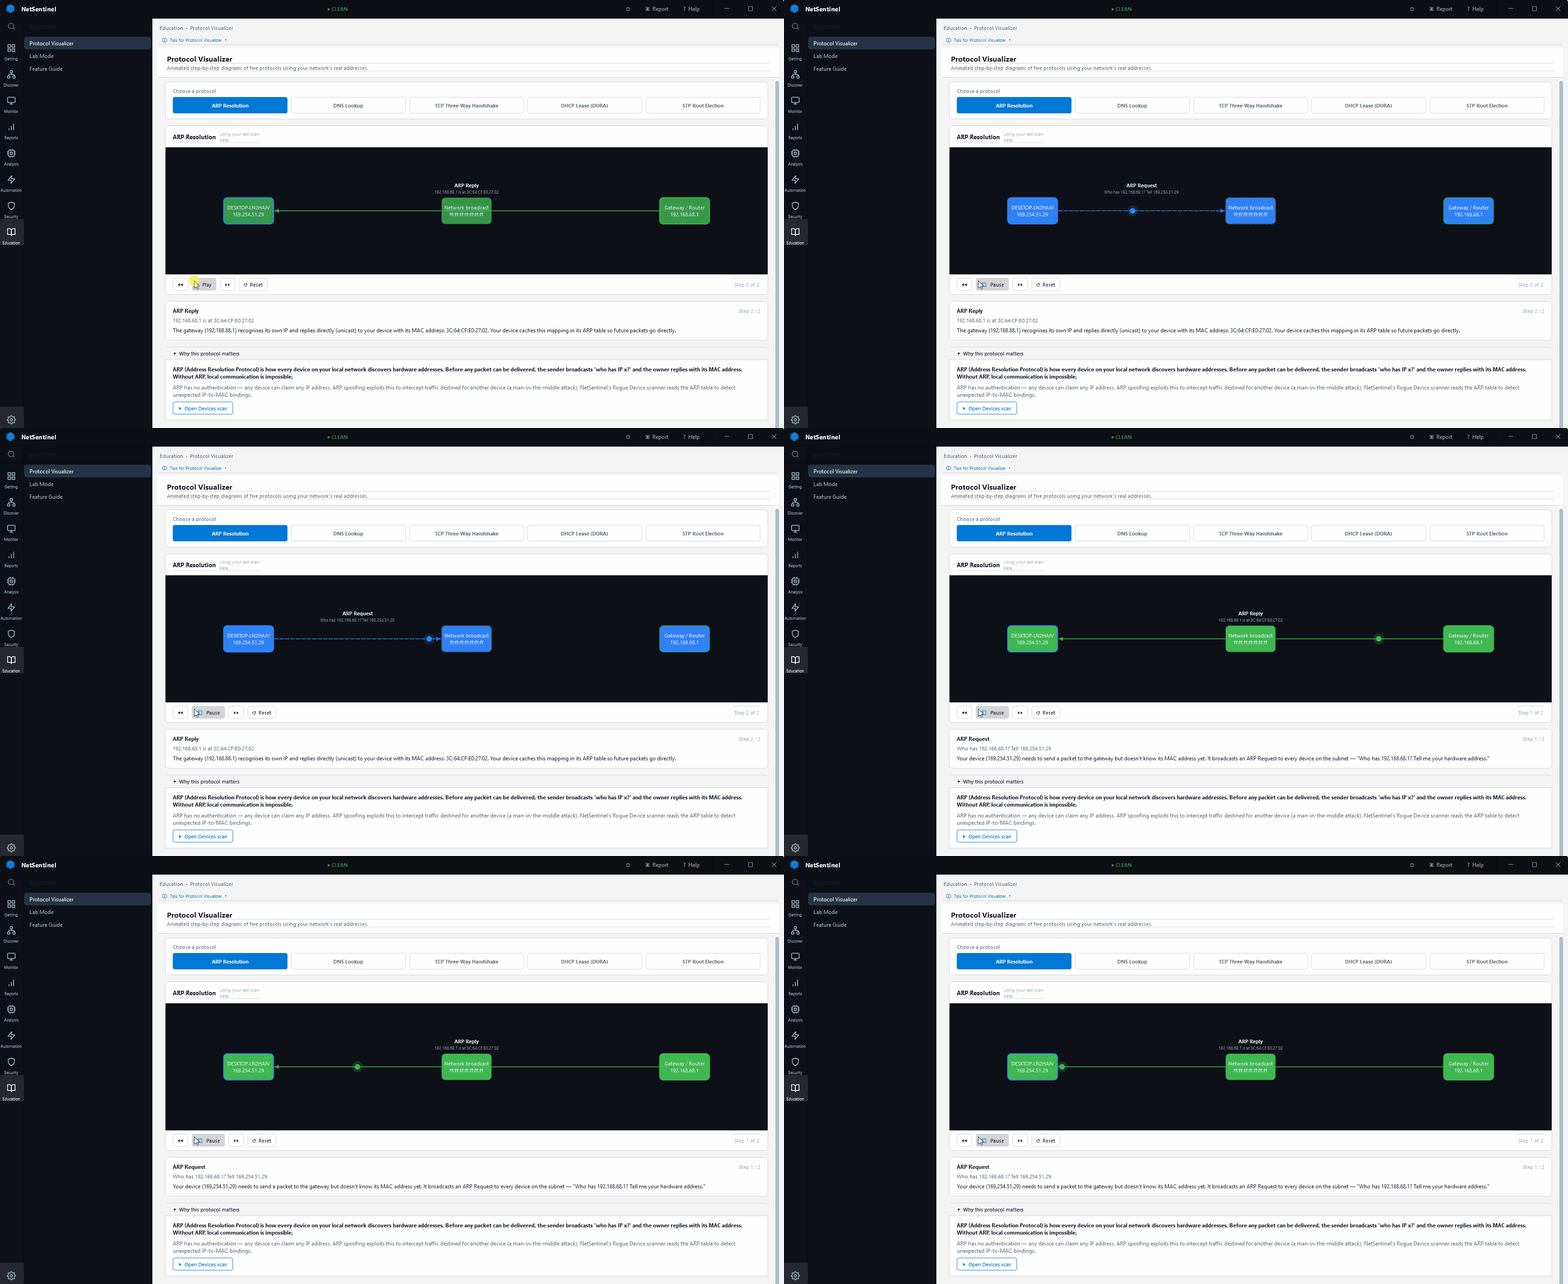
Built-in reference material:
- Protocol Visualizer — 10-protocol animated diagrams (ARP, DNS, TCP, DHCP, STP, OSPF, NAT, VLAN, TLS, ICMP) using real scan data from your own network (not placeholder addresses)
- Lab / Scenario Mode — ten guided exercises with progressive hints, solution reveal, and exportable HTML result reports; earned badges and per-certification objective coverage in the Achievements panel
- IP subnet calculator with CIDR reference and subnetting examples
- 35-term networking glossary accessible via the help button from any page
Quality
8,306 automated tests across 590 test files — detection logic, metric storage, version consistency, UI wiring, encoding hygiene, and CodeQL-prevention gates. All tests are offline; no real network traffic or live devices required.
python -m pytest tests/ -v --tb=short
15-hour chaos soak (July 2026): 31,372 automated UIA interactions across mild, moderate, and wild randomisation levels — a full coverage cycle plus two complete soak laps, bracketed by identical systematic sweeps confirming all 62 pages functional before and after. Zero crashes and zero unhandled exceptions. The single health-monitor restart during the run self-healed in 13 seconds.
Every commit gated by: ruff (unused imports/variables) · mypy (module type errors) · pip-audit (dependency CVEs) · debug_launch.py smoke test (catches PyQt6 runtime errors that only appear when the app actually starts) · CodeQL static analysis on every push.
Architecture
Three strict layers: modules/ holds all detection logic with zero PyQt imports; workers/ are QThread wrappers that emit signals and never touch UI state; ui/ reads from MetricStore and never writes to it directly. Every file write goes through get_app_data_dir() — the installed binary lives in a read-only Program Files directory.
dashboard.py is a thin shell that delegates to six inherited mixins and nine page-factory mixins, each responsible for a single concern. A CI-enforced 780-line budget per module keeps every file readable and independently testable.
→ Architecture reference — design decisions, module inventory, worker table, test architecture
Contributing
| Track | What it requires | Where to start |
|---|---|---|
| Add a rogue device signature | Edit one JSON file, no Python | offenders.json schema |
| Submit a hardware plugin | Python script, two functions | Hardware plugin guide |
| Code contribution | Full dev setup | Contributing guide |
Privacy and security
Zero telemetry. No cloud backend. Every outbound connection is user-initiated and documented.
→ Privacy policy · Security policy and threat model
Changelog
See CHANGELOG.md for the full release history.
v2.4.0 (current)
- NetSentinel now tells you when NetSentinel itself is the problem. A strip on the Home page and a dot in the tray show when a monitor, a listener, an alert channel or the password store has stopped working — what broke, why, what to do, and a button that opens the page that fixes it
- Fixed a large class of failures that used to look like success: a failed diagnosis turned its status dot green, a speed test that failed while you were on another page recorded nothing at all, and a watch that hit an error went back to looking like it had never run
- Fixed four places where a successful export or copy showed a failure dialog, because the code that confirmed the success was broken and its error was caught as though the work had failed
- Error messages across the app now say what failed, why it likely failed and what to try next, instead of showing a raw Windows error — which on non-English systems arrived in the system language
- Fixed the window freezing a few minutes after starting IoT anomaly monitoring, and spin boxes and error toasts cutting off their own contents
v2.3.0
- When NetSentinel closes unexpectedly, it now says so the next time you open it, and can package a redacted diagnostic report you can attach to a bug report — the app previously kept no record at all of a crash that produced no traceback
- Fixed the command-line and Windows-service builds crashing on accented text and keeping no crash record whatsoever; both carried defects the desktop app had already had fixed for it
- Fixed several checks that returned silently wrong results on non-English Windows — rogue IPv6 router detection always reported "clean", connectivity tests reported unreachable for hosts that answered, and WiFi channel readings were wrong for most access points
- Fixed the Windows service list in a credentialed scan always coming back empty, the shared-folder scan inventing user accounts that do not exist, and non-Latin device names being silently truncated
- Fixed PDF export producing a file containing a browser error page, and reporting it as a success
v2.2.8
- Fixed the app failing to write a crash report at all when the crash message contained non-English characters, such as an accented device name or path
- Fixed several background workers (bandwidth, app traffic, plugin polling, diagnosis, REST API) that could turn a contained error into a native crash or freeze
- Fixed commands like
ipconfig,arp,ping, andnetshraising an error when a WiFi network name or adapter name used accented characters - Fixed several features silently showing wrong or empty results on non-English Windows installs — connectivity checks reporting 100% packet loss on a healthy connection, and gateway, DHCP, WiFi, SMB, and IPv6 details failing to load
- Fixed the Network Logger's outage history and the Device Changes timeline showing events at the wrong time, or missing outage events entirely
v2.2.7
About
NetSentinel — Network Security Scanner & Connectivity Monitor
NetSentinel will always remain free and open source.
If you find this tool valuable, please consider supporting:
- Wikipedia — free knowledge for everyone
- Electronic Frontier Foundation — protecting digital rights
Built by Ossian Ericson · GitHub
Disclaimer: For use on networks you own or have explicit authorization to test.
License
MIT — see LICENSE.
Explore related projects
awesome-selfhosted/awesome-selfhosted
A list of Free Software network services and web applications which can be hosted on your own servers
336,747 starsimmich-app/immich
High performance self-hosted photo and video management solution.
119,110 starsStirling-Tools/Stirling-PDF
#1 PDF Application on GitHub that lets you edit PDFs on any device anywhere
96,520 starslouislam/uptime-kuma
A fancy self-hosted monitoring tool
93,848 stars