
opensearch-project/observability-stack
opensearch-project/observability-stack has 44 GitHub stars and 43 forks. GitHot measured 0 stars in 24 hours. Last checked 2026-11-10 04:38 UTC. Last push 2026-11-07.
Opensearch Observability Stack
Measured star growth
- in 24h
- 0
- in 7 days
- Update delayed
- in 15 days
- Update delayed
- in 1 month
- Update delayed
Net star changes over overlapping periods, not daily totals. Missing measurements are left blank. Stars measure attention, not software quality.
README.md
Original
🔭 OpenSearch Observability Stack

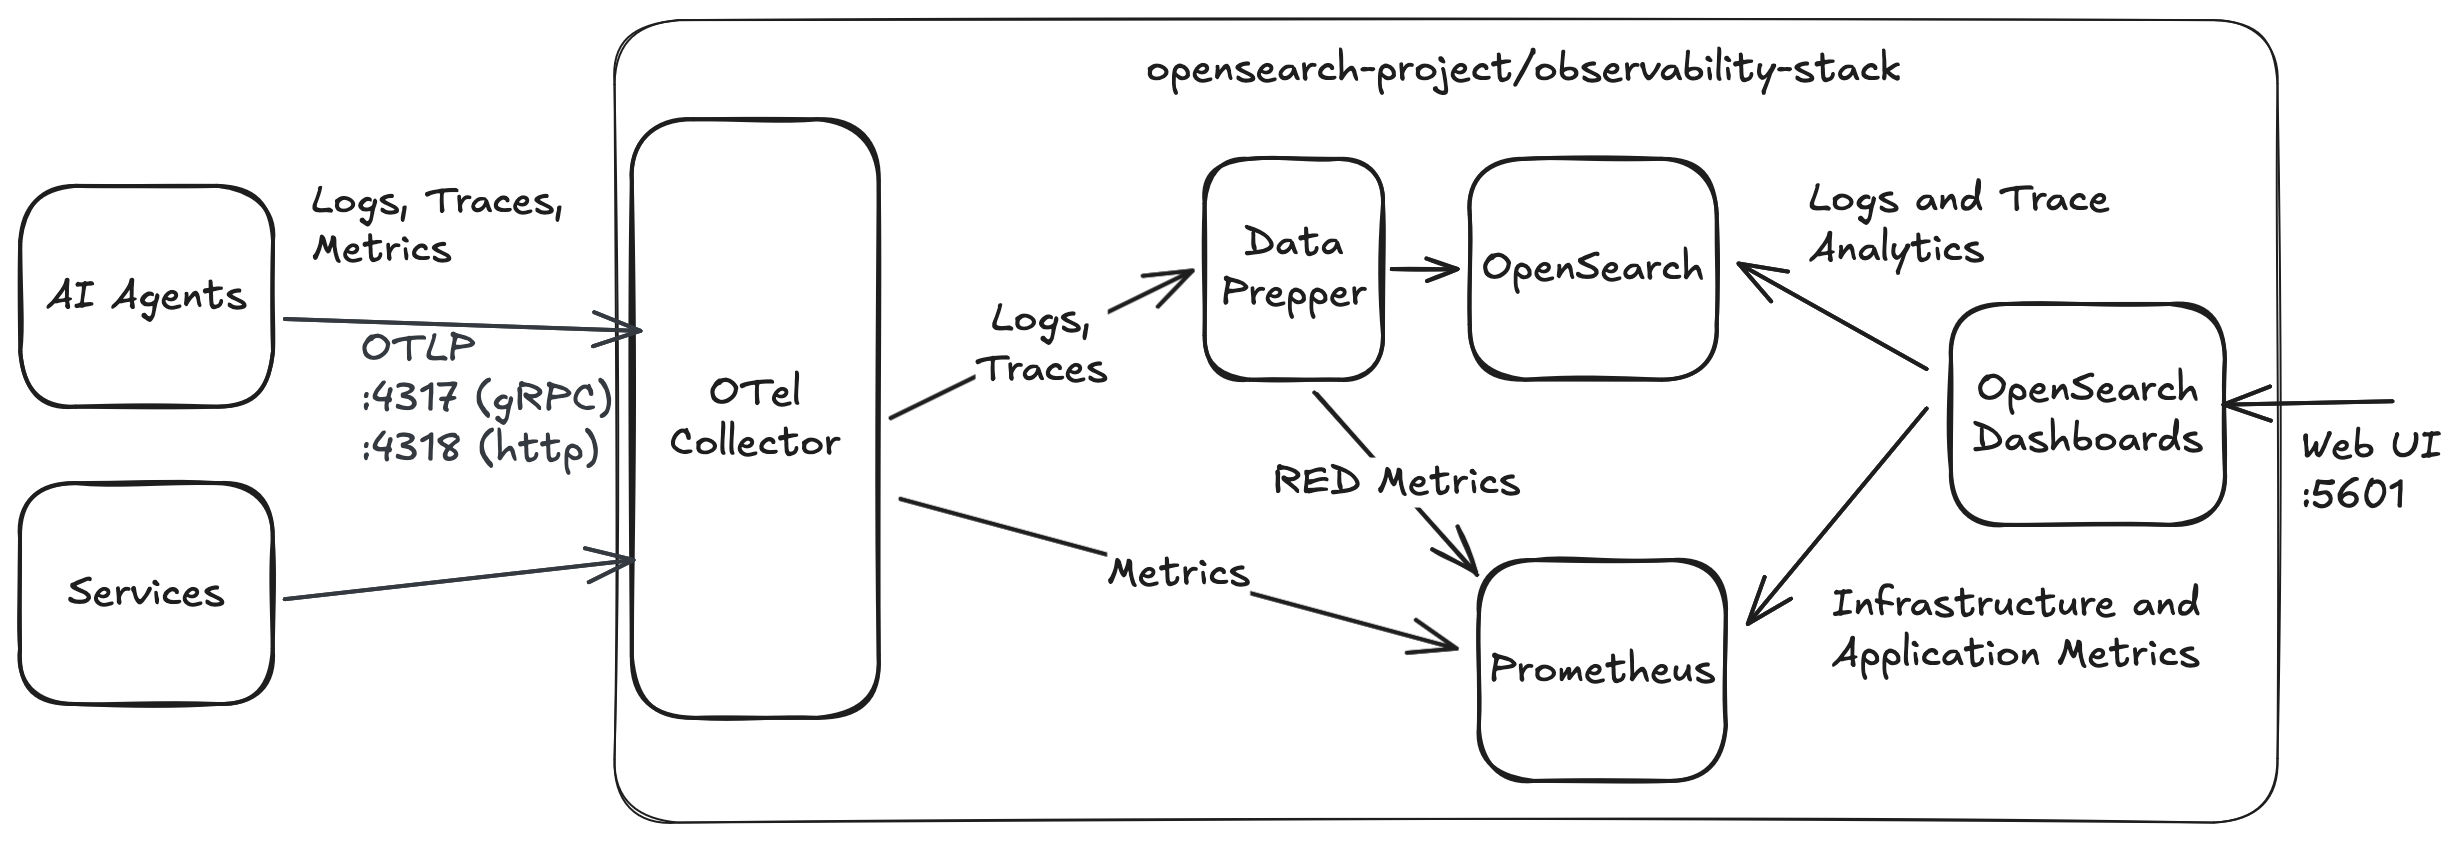
Observability Stack is an open-source stack designed for modern distributed systems. Built on OpenTelemetry, OpenSearch, and Prometheus, Observability Stack provides a complete, pre-configured infrastructure for monitoring microservices, web applications, and AI agents—with first-class support for agent observability through OpenTelemetry Gen-AI Semantic Conventions.
Components
- OpenTelemetry Collector: Receives OTLP data and routes it to appropriate backends
- Data Prepper: Transforms and enriches logs and traces before storage
- OpenSearch: Stores and indexes logs and traces for search and analysis
- Prometheus: Stores time-series metrics data — runs the Cortex engine under the service name
prometheus(same API surface, plus Ruler and Alertmanager endpoints) - Alertmanager: Routes alerts from Cortex-side PromQL rules to notification channels
- OpenSearch Dashboards: Provides web-based visualization and exploration — includes the Alert Manager UI for viewing both OpenSearch monitors and Cortex alerts in one place
- PPL (Piped Processing Language): Native query language for logs and traces — pipe-based, human-readable, 50+ commands
See it in action
https://github.com/user-attachments/assets/bef4c3ad-c64d-4db8-96f5-9ffd26bd0b03
🚀 Quickstart
Option 1: One-Command Install (Recommended)
Use our interactive installer for the best experience:
curl -fsSL https://raw.githubusercontent.com/opensearch-project/observability-stack/main/install.sh | bash
The installer will:
- ✅ Check system requirements (Docker/Finch, Git, memory)
- 🎨 Guide you through configuration with a beautiful TUI
- 📦 Pull and start all services automatically
- 🔐 Optionally set custom OpenSearch credentials
- 📊 Display credentials and access points
Installer flags:
| Flag | Description |
|---|---|
--simulate |
Preview the installer output without actually installing |
--skip-pull |
Skip pulling container images (uses cached images) |
--help |
Show help message |
To run the installer locally (e.g. after cloning):
./install.sh                # Full install
./install.sh --simulate     # Dry run
./install.sh --skip-pull    # Skip image pulls (useful for re-installs)
Installation takes 8-15 minutes. After completion, access:
| Service | URL | Credentials |
|---|---|---|
| OpenSearch Dashboards | http://localhost:5601 | admin / My_password_123!@# |
| Prometheus | http://localhost:9090 | (none) |
| OpenSearch API | https://localhost:9200 | admin / My_password_123!@# |
Option 2: Manual Setup
To get started manually with Docker Compose:
1️⃣ Clone the repository:
git clone https://github.com/opensearch-project/observability-stack.git
cd observability-stack
Optional: Configure stack
The .env file contains all configurable parameters:
- Example services: Included by default via
INCLUDE_COMPOSE_EXAMPLES=docker-compose.examples.yml. Comment out to run only the core stack. - OpenTelemetry Demo: Not enabled by default. Uncomment
INCLUDE_COMPOSE_OTEL_DEMO=docker-compose.otel-demo.ymlto add the full OpenTelemetry Demo microservices app for realistic e-commerce telemetry (~2GB additional memory required). - eBPF example: Not enabled by default. With the OpenTelemetry Demo enabled, uncomment
INCLUDE_COMPOSE_EBPF_DEMO=docker-compose.ebpf-demo.yml(and optionallyINSTALL_EBPF_EXAMPLE_DASHBOARD=truefor its dashboard) to add services with no OTel SDK, traced by OBI, to its shipping path. Linux hosts only; OBI runs privileged.
See Configuration section for more details.
2️⃣ Start the stack:
docker compose up -d
This starts all services including example services (multi-agent travel planner, weather-agent, events-agent, and canary) that generate sample telemetry data.
3️⃣ View your Logs and Traces in OpenSearch Dashboards
👉 Navigate to http://localhost:5601
Username and password can be retrieved from .env file:
grep -E '^OPENSEARCH_(USER|PASSWORD)=' .env
Option 3: Kubernetes (Helm)
Deploy to any Kubernetes cluster using the umbrella Helm chart:
git clone https://github.com/opensearch-project/observability-stack.git
cd observability-stack
helm install obs charts/observability-stack
Access OpenSearch Dashboards:
kubectl port-forward svc/obs-opensearch-dashboards 5601:5601
See charts/observability-stack/README.md for configuration, credential management, and sizing options.
Option 4: AWS Managed Services
Deploy the same observability stack to AWS managed services:
| Local (Docker Compose) | AWS Managed |
|---|---|
| OpenSearch | Amazon OpenSearch Service |
| Prometheus | Amazon Managed Service for Prometheus |
| OTel Collector → Data Prepper | Amazon OpenSearch Ingestion (OSIS) |
| OpenSearch Dashboards | OpenSearch UI |
CLI installer — interactive single-command deploy:
cd aws/cli-installer && npm install
node bin/cli-installer.mjs --managed --pipeline-name obs-stack --region us-west-2
See aws/cli-installer/README.md for details.
CDK — infrastructure as code:
cd aws/cdk
npm install
cdk deploy --all
See aws/cdk/README.md for configuration options, architecture details, and sending telemetry via SigV4.
Destroying the Stack
To stop the stack while preserving your data:
docker compose down
To stop the stack and remove all data volumes:
docker compose down -v
Upgrading from Previous Releases
This release swaps vanilla Prometheus for Cortex (kept under the same prometheus service name) and adds an always-on Alertmanager. Existing deployments can upgrade in place, with two caveats worth calling out:
- Historical metrics do not carry over. Cortex writes to a different on-disk layout (
/data/tsdb,/data/ruler-storage) than vanilla Prometheus (/prometheus/chunks_head,/prometheus/wal). Cortex does not read the old TSDB blocks, so any metrics stored in theprometheus-datavolume before the upgrade are unreadable after it. New OTLP writes work immediately. - The in-place upgrade migrates OSD state automatically, but if you prefer a clean slate, wipe volumes before bringing the new stack up:
Thedocker compose down -v docker compose up -ddocker compose down -vpath is the safest if you're on an older build. The automatic migration reconciles theObservabilityStack_Prometheusdatasource to add the newprometheus.ruler.uri/alertmanager.uriproperties, cleans up the old saved-object wrapper, and removes stale vanilla-Prometheus directories from the data volume on first Cortex boot.
See Alerting for a tour of the new Cortex rules, Alertmanager routing, and the Alert Manager UI in OpenSearch Dashboards.
Instrumenting Your Agent
Observability Stack accepts telemetry data via the OpenTelemetry Protocol (OTLP) and follows the OpenTelemetry Gen-AI Semantic Conventions for standardized attribute naming and structure for AI agents.
OTLP Endpoint Configuration
The OTel Collector exposes two OTLP endpoints — choose the one that matches your SDK's protocol:
| Port | Protocol | Endpoint | Used By |
|---|---|---|---|
| 4317 | gRPC | http://localhost:4317 |
OpenTelemetry SDK (default), most language SDKs |
| 4318 | HTTP/protobuf | http://localhost:4318 |
Strands SDK (setup_otlp_exporter()), HTTP-based exporters |
Configure via environment variables:
# For gRPC-based exporters (OpenTelemetry SDK default)
export OTEL_EXPORTER_OTLP_ENDPOINT="http://localhost:4317"
# For HTTP/protobuf exporters (Strands SDK, OTLP HTTP exporters)
export OTEL_EXPORTER_OTLP_ENDPOINT="http://localhost:4318"
Note: The Strands Agents SDK's
StrandsTelemetry().setup_otlp_exporter()uses HTTP/protobuf, which requires port 4318. Using port 4317 with Strands will silently fail. When usingOTLPSpanExporterdirectly with gRPC (as in the examples below), use port 4317.
Example: Manual Instrumentation with OpenTelemetry
For complete example, see examples/plain-agents/weather-agent
from opentelemetry import trace
from opentelemetry.exporter.otlp.proto.grpc.trace_exporter import OTLPSpanExporter
from opentelemetry.sdk.trace import TracerProvider
from opentelemetry.sdk.trace.export import BatchSpanProcessor
# Configure OTLP exporter (gRPC — port 4317)
tracer_provider = TracerProvider()
otlp_exporter = OTLPSpanExporter(endpoint="http://localhost:4317", insecure=True)
tracer_provider.add_span_processor(BatchSpanProcessor(otlp_exporter))
trace.set_tracer_provider(tracer_provider)
# Create tracer
tracer = trace.get_tracer("my-agent")
# Instrument agent invocation
with tracer.start_as_current_span("invoke_agent") as span:
span.set_attribute("gen_ai.operation.name", "invoke_agent")
span.set_attribute("gen_ai.agent.name", "Weather Assistant")
span.set_attribute("gen_ai.request.model", "gpt-4")
# Your agent logic here
result = agent.run("What's the weather in Paris?")
span.set_attribute("gen_ai.usage.input_tokens", 150)
span.set_attribute("gen_ai.usage.output_tokens", 75)
Example: Instrument with StrandsTelemetry
For complete example, see examples/strands/code-assistant
from opentelemetry.exporter.otlp.proto.grpc.trace_exporter import OTLPSpanExporter
from opentelemetry.sdk.trace.export import BatchSpanProcessor
from strands import Agent
from strands.models import BedrockModel
from strands.telemetry import StrandsTelemetry
# 1. Initialize StrandsTelemetry (auto-instruments with GenAI semantic conventions)
telemetry = StrandsTelemetry()
# 2. Configure OTLP exporter to send traces to your observability stack
# Note: This example uses gRPC (port 4317) with OTLPSpanExporter directly.
# If using setup_otlp_exporter() instead, it uses HTTP/protobuf (port 4318).
exporter = OTLPSpanExporter(endpoint="localhost:4317", insecure=True)
telemetry.tracer_provider.add_span_processor(BatchSpanProcessor(exporter))
# 3. Use your agent normally - telemetry happens automatically!
agent = Agent(
system_prompt="You are a helpful assistant",
model=BedrockModel(model_id="us.anthropic.claude-sonnet-4-20250514-v1:0"),
tools=[your_tools]
)
# Every agent call is automatically traced with GenAI semantic conventions
agent("What's the weather like?")
Instrumenting Without Code Changes (eBPF)
OpenTelemetry eBPF Instrumentation (OBI) traces HTTP, gRPC, and database calls from unmodified services in any language and sends them to the stack over OTLP. Run it as a Kubernetes DaemonSet or a privileged container, and set OTEL_EBPF_BPF_CONTEXT_PROPAGATION=all so cross-service calls link into one trace and show up on the Application Map:
helm install obi open-telemetry/opentelemetry-ebpf-instrumentation \
--namespace obi --create-namespace -f obi-values.yaml
See eBPF Instrumentation (OBI) for the Helm values, a Docker Compose example, the eBPF example, and kernel requirements.
Managing Services
Common Commands
# View logs
docker compose logs -f
# View logs for specific service
docker compose logs -f opensearch
# Stop services (keeps data)
docker compose down
# Stop and remove all data
docker compose down -v
# Restart services
docker compose restart
# Restart specific service
docker compose restart opensearch
# Check service status
docker compose ps
Ports
| Port | Service | Protocol | Description |
|---|---|---|---|
| 4317 | OTel Collector | gRPC | OTLP gRPC receiver — used by most OpenTelemetry SDKs |
| 4318 | OTel Collector | HTTP | OTLP HTTP receiver — used by Strands SDK, browser-based exporters |
| 5601 | OpenSearch Dashboards | HTTP | Web UI for logs, traces, dashboards, and Alert Manager |
| 9090 | Prometheus (Cortex) | HTTP | PromQL query API (/prometheus/...) and Ruler admin API (/api/v1/rules/...) |
| 9093 | Alertmanager | HTTP | Alert routing UI and API for Cortex-side PromQL alerts |
| 9200 | OpenSearch | HTTPS | REST API (self-signed cert, use curl -k) |
| 21890 | Data Prepper | gRPC | Internal OTLP receiver (from OTel Collector) |
When example services are enabled:
| Port | Service | Description |
|---|---|---|
| 8000 | weather-agent | Weather lookup API with fault injection |
| 8002 | events-agent | Local events lookup API |
| 8003 | travel-planner | Multi-agent orchestrator |
When OpenTelemetry Demo is enabled:
| Port | Service | Description |
|---|---|---|
| 8080 | frontend-proxy | Demo telescope web store |
| 8080/loadgen/ | load-generator | Load generator dashboard |
| 8080/feature | feature-flag | Feature flag management UI |
Configuration
Environment Variables
The .env file contains all configurable parameters. Edit this file before starting the stack to customize your deployment.
Including Example Services
By default, the stack includes example services (multi-agent travel planner, weather-agent, events-agent, and canary) via the INCLUDE_COMPOSE_EXAMPLES variable in .env:
INCLUDE_COMPOSE_EXAMPLES=docker-compose.examples.yml
Example services:
- travel-planner (port 8003): Multi-agent orchestrator demonstrating distributed tracing
- weather-agent (port 8000): Weather lookup with fault injection
- events-agent (port 8002): Local events lookup
- canary: Generates test traffic with fault injection
To run without examples:
- Comment out the
INCLUDE_COMPOSE_EXAMPLESline in.env - Restart the stack:
docker compose down && docker compose up -d
Running with OpenTelemetry Demo
Observability Stack can run alongside the OpenTelemetry Demo application, a full microservices e-commerce app that generates realistic telemetry data.
To enable OpenTelemetry Demo, uncomment in .env:
INCLUDE_COMPOSE_OTEL_DEMO=docker-compose.otel-demo.yml
Then restart the stack:
docker compose down && docker compose up -d
Access points when running with OTel Demo:
- Web Store: http://localhost:8080/
- Load Generator UI: http://localhost:8080/loadgen/
- Feature Flags UI: http://localhost:8080/feature
Note: Running with OTel Demo significantly increases resource requirements. See Resource Requirements below.
OpenSearch Credentials
The default credentials are admin / My_password_123!@# (development only).
Setting credentials during install:
The interactive installer prompts "Customize OpenSearch credentials?" — enter Y to set a custom username and password. The installer writes them to .env, and all services pick them up automatically.
Changing credentials after install:
Edit
.envfile (single source of truth):OPENSEARCH_USER=your-new-username OPENSEARCH_PASSWORD=your-new-passwordRestart the stack (remove volumes to clear stale credentials):
docker compose down -v
docker compose up -d
How it works: .env is the single source of truth for credentials. OpenSearch, Dashboards, and the init script read from .env via environment variables. Data Prepper uses a template with OPENSEARCH_USER/OPENSEARCH_PASSWORD placeholders that are injected via sed at container startup — no manual config edits needed. OpenSearch uses HTTPS with self-signed certificates, so use -k flag with curl commands.
Resource Requirements
| Configuration | Memory Usage | Recommended Minimum |
|---|---|---|
| Core stack only | ~1.1 GB | 4 GB RAM |
| Core + OTel Demo | ~3.0 GB | 8 GB RAM |
Core services (~1.1 GB total):
- OpenSearch: ~1.6 GB
- Data Prepper: ~650 MB
- OpenSearch Dashboards: ~230 MB
- OTel Collector: ~100 MB
- Prometheus: ~40 MB
- Example services (weather-agent, canary): ~100 MB
OpenTelemetry Demo adds (~1.9 GB total):
- Kafka: ~500 MB
- Java services (fraud-detection, ad, accounting): ~540 MB
- Frontend, load-generator, and other services: ~850 MB
Check resource usage:
docker stats --no-stream

# For Finch users
finch stats --no-stream
Production Readiness
⚠️ Observability Stack is NOT production-ready out of the box. The default configuration prioritizes ease of use for development and testing. Before deploying to production, you must address the following:
Security Hardening Required
- Authentication: Enable OpenSearch security plugin and configure user authentication
- Authorization: Implement role-based access control (RBAC)
- Encryption: Enable TLS/SSL for all HTTP endpoints and encrypt data at rest
- Network Security: Implement network policies, firewalls, and limit exposed ports
- Secrets Management: Use secure secret storage instead of default passwords
Operational Requirements
- High Availability: Configure multi-node OpenSearch cluster and redundant services
- Backup and Recovery: Implement automated backup procedures and test recovery
- Monitoring: Set up monitoring and alerting for the observability stack itself
- Resource Limits: Configure appropriate CPU, memory, and disk quotas
- Data Lifecycle: Default retention is 7 days (
ISM_RETENTION_DAYSin.env). Adjust for production workloads
Security Considerations
The default configuration includes these development-friendly settings that are NOT secure:
- OpenSearch security is enabled but uses default credentials (admin/My_password_123!@#)
- Self-signed TLS certificates with verification disabled
- Permissive CORS settings
- All services exposed without network isolation
Never deploy the default configuration to production or expose it to untrusted networks.
Troubleshooting
Services Won't Start
Check Docker resource allocation:
docker stats
View service logs:
docker compose logs <service-name>
Data Not Appearing
Verify OpenTelemetry Collector is receiving data:
docker compose logs otel-collector
Check Data Prepper pipeline status:
docker compose logs data-prepper
Verify OpenSearch indices:
curl -k -u admin:My_password_123!@# https://localhost:9200/_cat/indices?v
Performance Issues
Check resource usage:
docker stats
Adjust resource limits in docker-compose.yml or values.yaml for Helm.
Network Removal Error on Shutdown
If docker compose down fails with an error like:
failed to remove network observability-stack-network: Error response from daemon: error while removing network: network observability-stack-network id ab129adaabcd7ab35cddb1fbe8dc2a68b3c730b9fb9384c5c1e7f5ca015c27d9 has active endpoints
This typically occurs when containers from other compose files are still running. Try:
docker compose down --remove-orphans
Or stop all containers using the network first:
docker network inspect observability-stack-network --format '{{range .Containers}}{{.Name}} {{end}}' | xargs -r docker stop
docker compose down
For more troubleshooting guidance, see TROUBLESHOOTING.md.
Project Status: 🚧 Alpha
Note: As the OpenSearch agent observability ecosystem grows, this repository may eventually be consolidated into a unified "container-recipes" repository alongside other quickstart setups. This would provide a centralized location for all OpenSearch deployment patterns. However we'll communicate any such changes through the repository's issue tracker and release notes.
Temporary Workarounds
The current configuration includes a custom OpenSearch Dockerfile (docker-compose/opensearch/Dockerfile) that removes some plugins facing issues during OpenSearch 3.5.0 development. This workaround will be removed once OpenSearch 3.5.0 is officially released and stabilized. At that point, we'll switch back to using the standard OpenSearch Docker image directly.
Track progress: OpenSearch 3.5.0 Release
Query Language: PPL
The Observability Stack uses Piped Processing Language (PPL) as its native query language for logs and traces. PPL is a pipe-based language designed for the way operators actually investigate data:
source = logs-otel-v1*
| where severityNumber >= 17
| stats count() as errors by `resource.attributes.service.name`
| sort - errors
PPL provides 50+ commands and 200+ functions covering search, aggregation, pattern discovery, machine learning, joins, and more. See the PPL documentation for the full reference with live playground examples.
Documentation
- PPL Language Reference - Query language documentation with live examples
- AGENTS.md - AI-optimized repository documentation
- CONTRIBUTING.md - Development workflow and contribution guidelines
- examples/ - Language-specific instrumentation examples
- docs/ - Additional documentation and guides
Development
When making changes to example services or other components, rebuild and restart with:
docker compose up -d --build
This rebuilds any modified containers and restarts them with the new changes.
Contributing
We welcome contributions! Please see CONTRIBUTING.md for guidelines on:
- Development workflow
- Testing requirements
- Code style conventions
- Pull request process
License
This project is licensed under the Apache License 2.0 - see the LICENSE file for details.
Support
- Issues: Report bugs or request features via GitHub Issues
- Discussions: Ask questions in GitHub Discussions
- Documentation: See the docs/ directory
Acknowledgments
Observability Stack is built on top of excellent open-source projects:
Remember: Observability Stack is for development and testing. Harden security and operations before production use.
Explore related projects
affaan-m/ECC
The agent harness performance optimization system. Skills, instincts, memory, security, and research-first development for Claude Code, Codex, Opencode, Cursor and beyond.
300,759 starsNousResearch/hermes-agent
The agent that grows with you
262,426 starsmultica-ai/andrej-karpathy-skills
A single CLAUDE.md file to improve Claude Code behavior, derived from Andrej Karpathy's observations on LLM coding pitfalls.
231,843 starsfirecrawl/firecrawl
Supercharge your AI agents with data from the web and beyond. Building the library for superintelligence. 🔥
200,444 stars