
nschloe/termplotlib
nschloe/termplotlib has 725 GitHub stars and 17 forks. GitHot measured 0 stars in 24 hours and 0 in 7 days. Last checked 2026-11-09 02:03 UTC. Last push 2021-12-09.
:chart_with_upwards_trend: Plotting on the command line
Measured star growth
- in 24h
- 0
- in 7 days
- 0
- in 15 days
- Update delayed
- in 1 month
- Update delayed
Net star changes over overlapping periods, not daily totals. Missing measurements are left blank. Stars measure attention, not software quality.
README.md
Originaltermplotlib


termplotlib is a Python library for all your terminal plotting needs. It aims to work like matplotlib.
Line plots
For line plots, termplotlib relies on gnuplot. With that installed, the code
import termplotlib as tpl
import numpy as np

x = np.linspace(0, 2 * np.pi, 10)
y = np.sin(x)

fig = tpl.figure()
fig.plot(x, y, label="data", width=50, height=15)
fig.show()
produces
    1 +---------------------------------------+
  0.8 |    **     **                          |
  0.6 |   *         **           data ******* |
  0.4 | **                                    |
  0.2 |*              **                      |
    0 |                 **                    |
      |                                   *   |
 -0.2 |                   **            **    |
 -0.4 |                     **         *      |
 -0.6 |                              **       |
 -0.8 |                       **** **         |
   -1 +---------------------------------------+
      0     1    2     3     4     5    6     7
Horizontal histograms
import termplotlib as tpl
import numpy as np

rng = np.random.default_rng(123)
sample = rng.standard_normal(size=1000)
counts, bin_edges = np.histogram(sample)

fig = tpl.figure()
fig.hist(counts, bin_edges, orientation="horizontal", force_ascii=False)
fig.show()
produces
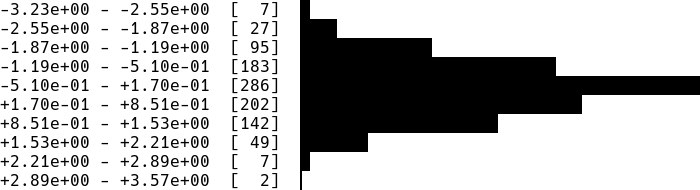
Horizontal bar charts are covered as well. This
import termplotlib as tpl

fig = tpl.figure()
fig.barh([3, 10, 5, 2], ["Cats", "Dogs", "Cows", "Geese"], force_ascii=True)
fig.show()
produces
Cats   [ 3]  ************
Dogs   [10]  ****************************************
Cows   [ 5]  ********************
Geese  [ 2]  ********
Vertical histograms
import termplotlib as tpl
import numpy as np

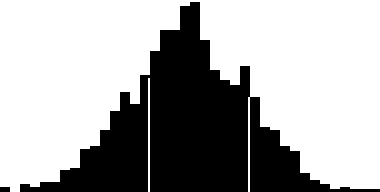
rng = np.random.default_rng(123)
sample = rng.standard_normal(size=1000)
counts, bin_edges = np.histogram(sample, bins=40)
fig = tpl.figure()
fig.hist(counts, bin_edges, grid=[15, 25], force_ascii=False)
fig.show()
produces
Tables
Support for tables has moved over to termtables.
Installation
termplotlib is available from the Python Package Index, so simply do
pip install termplotlib
to install.
Testing
To run the termplotlib unit tests, check out this repository and type
pytest
Similar projects
Explore related projects
codecrafters-io/build-your-own-x
Master programming by recreating your favorite technologies from scratch.
561,292 starspublic-apis/public-apis
A collective list of free APIs
497,545 starsmorluto/rea
Reverse engineer anything with agents, from app behavior down to native binaries.
446,251 starsopenclaw/openclaw
The AI that really does things. Any OS. Any Platform. The lobster way. 🦞
394,240 stars