
nethercoded/heron has 11 GitHub stars and 0 forks. GitHot measured 0 stars in 24 hours. Last checked 2026-11-09 15:54 UTC. Last push 2026-11-06.
Self-hosted status page and uptime monitor. One small Go binary, SQLite, automatic HTTPS and a web installer.
Measured star growth
- in 24h
- 0
- in 7 days
- Collecting history
- in 15 days
- Collecting history
- in 1 month
- Collecting history
Net star changes over overlapping periods, not daily totals. Missing measurements are left blank. Stars measure attention, not software quality.
README.md
Original

A self-hosted status page and uptime monitor.
One small binary, one SQLite file, and a page your users will actually like looking at.


curl -fsSL https://raw.githubusercontent.com/nethercoded/heron/main/deploy/install.sh | sudo sh
One command on any Linux server, then a web installer takes you the rest of the way. The download is about 10 MB and heron idles at around 40 MB of RAM. Docker works too, see Getting it running.
Why heron
I wanted a status page that I could drop on a cheap VPS and forget about. Most tools I tried either needed a database server, ate a few hundred megabytes of RAM, or looked like an admin template from 2014. heron is my answer to that.
It checks your sites, APIs, databases, containers and game servers, keeps a year of history, opens incidents when something breaks and closes them when it comes back. The public page updates live, so people watching it during an outage see the moment things recover.
What it does
Checks. HTTP and HTTPS with status codes, keywords, custom headers and certificate expiry. TCP ports, ping and DNS records. Postgres (it runs a real query), Redis, SMTP with STARTTLS, IMAP, Docker containers and their healthchecks, gRPC health, Minecraft and Steam servers with player counts. Push monitors for cron jobs and backups that call heron instead of the other way around.
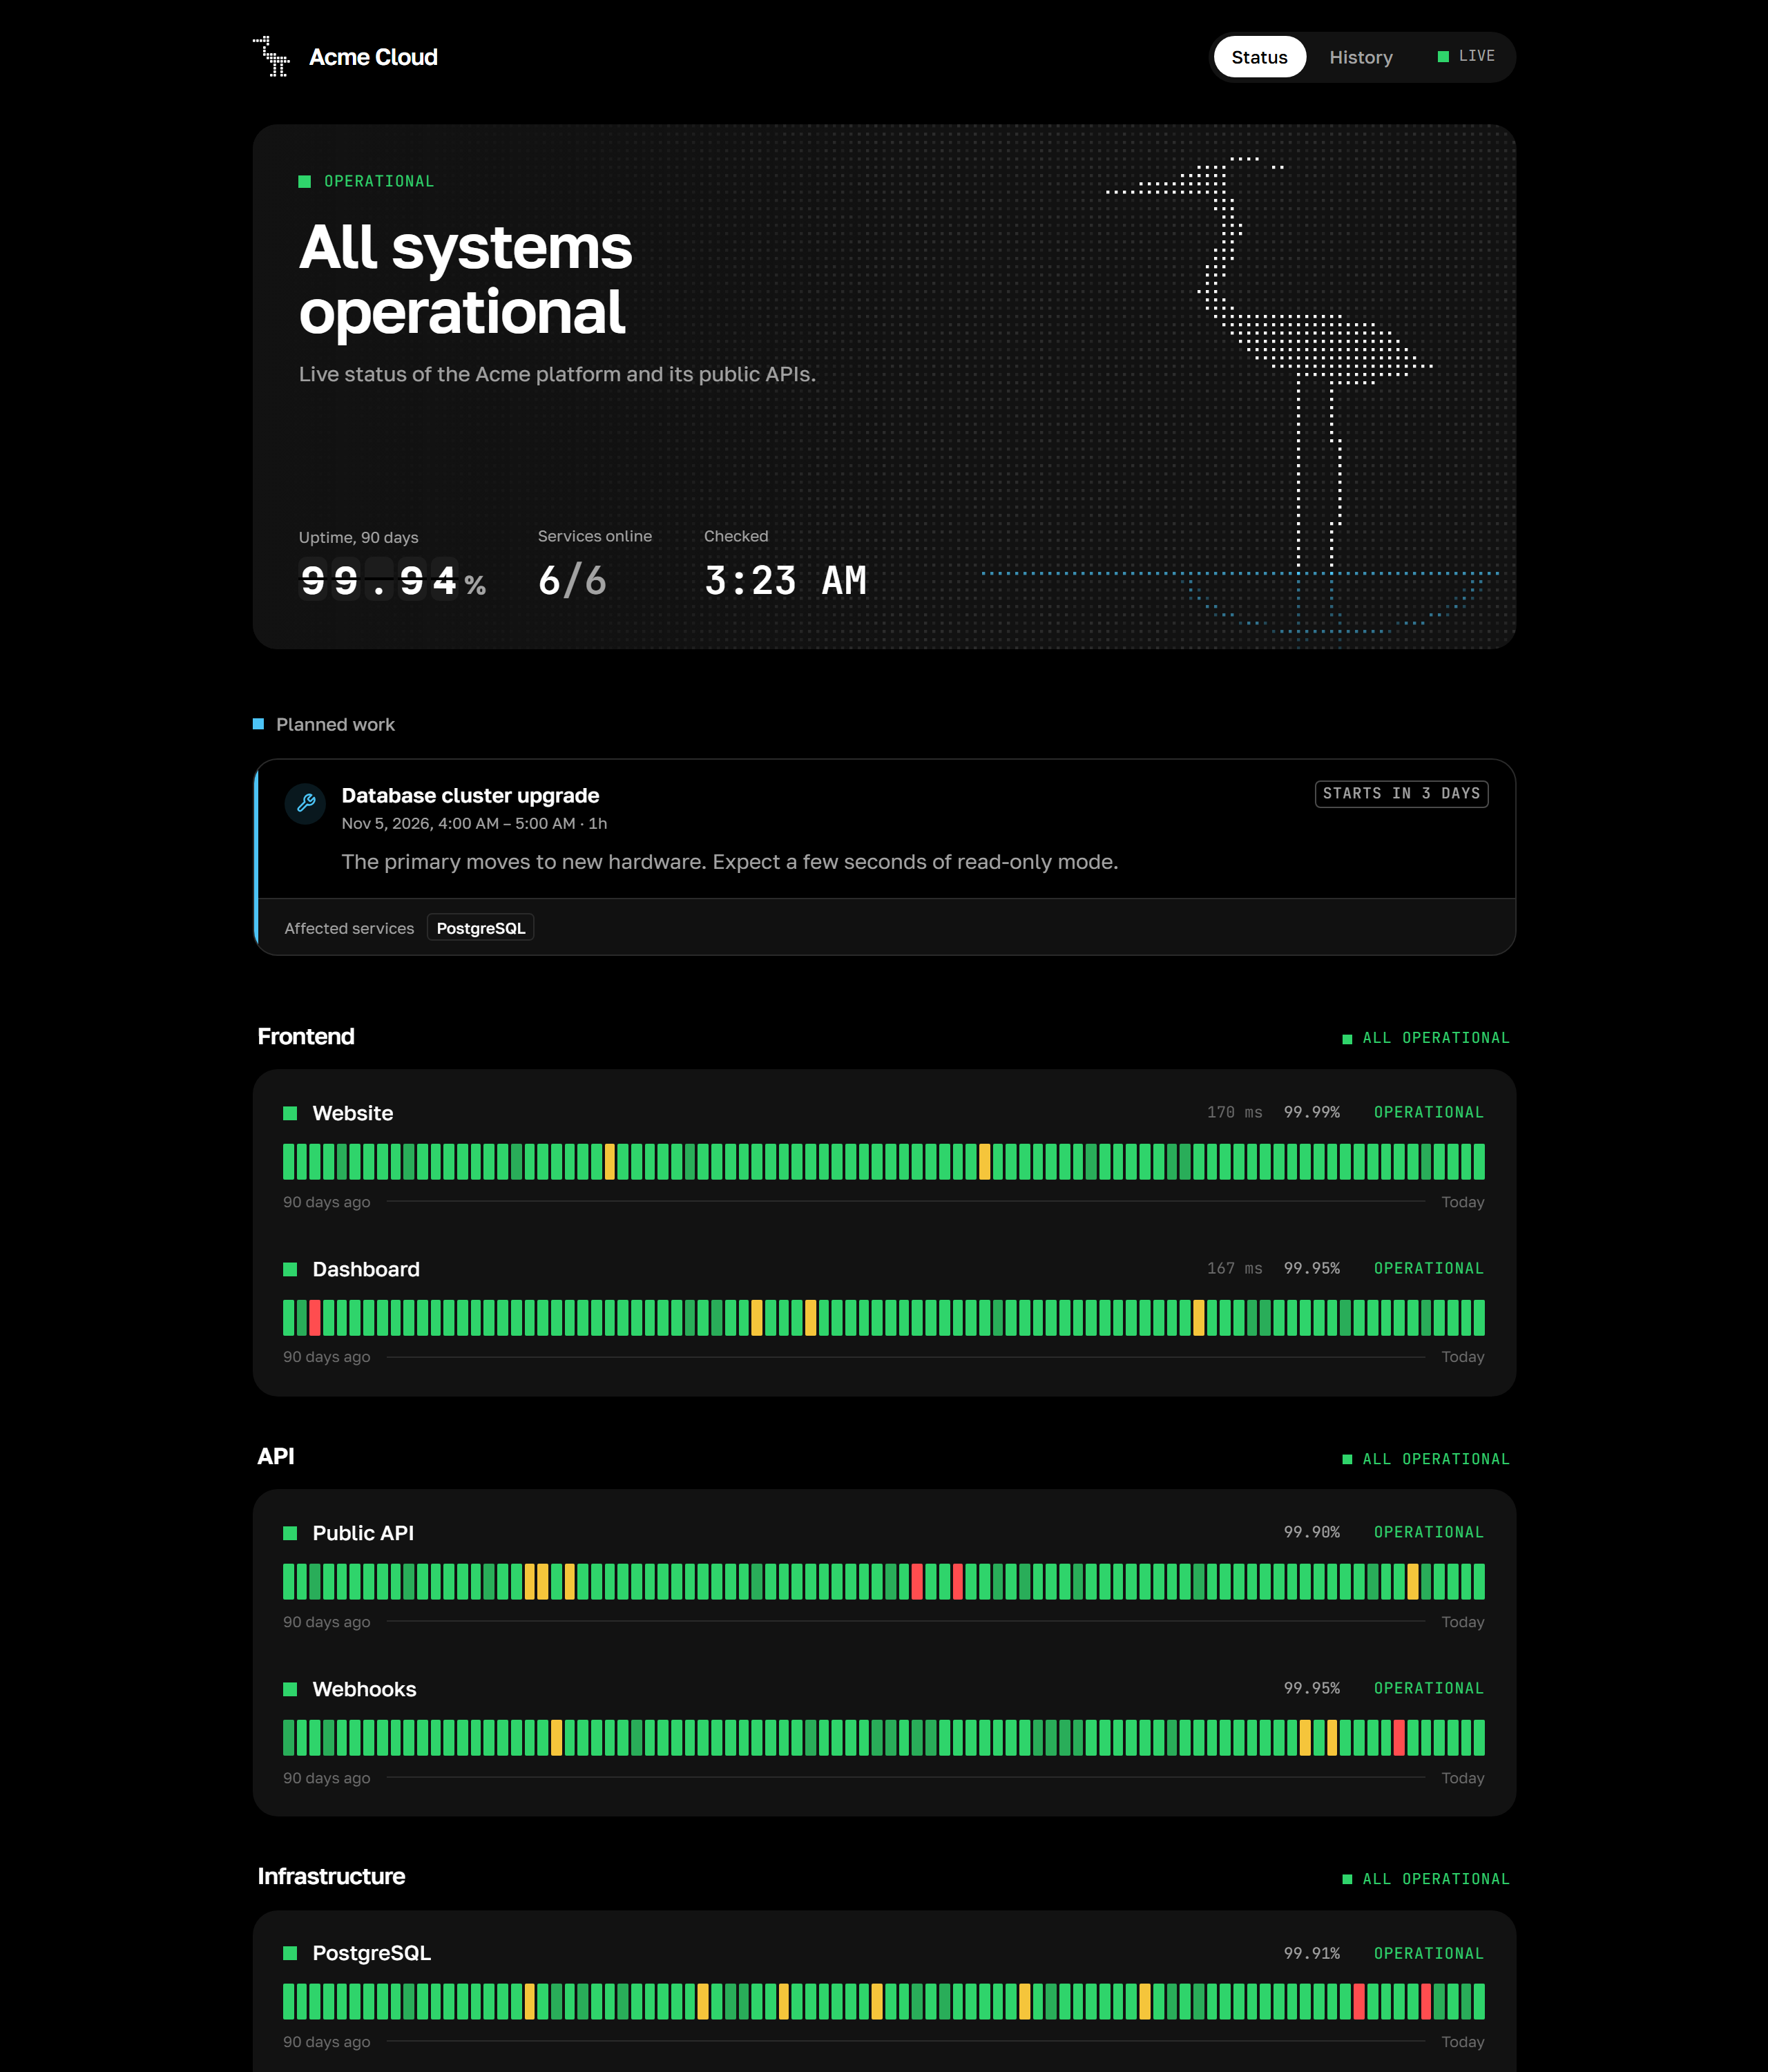
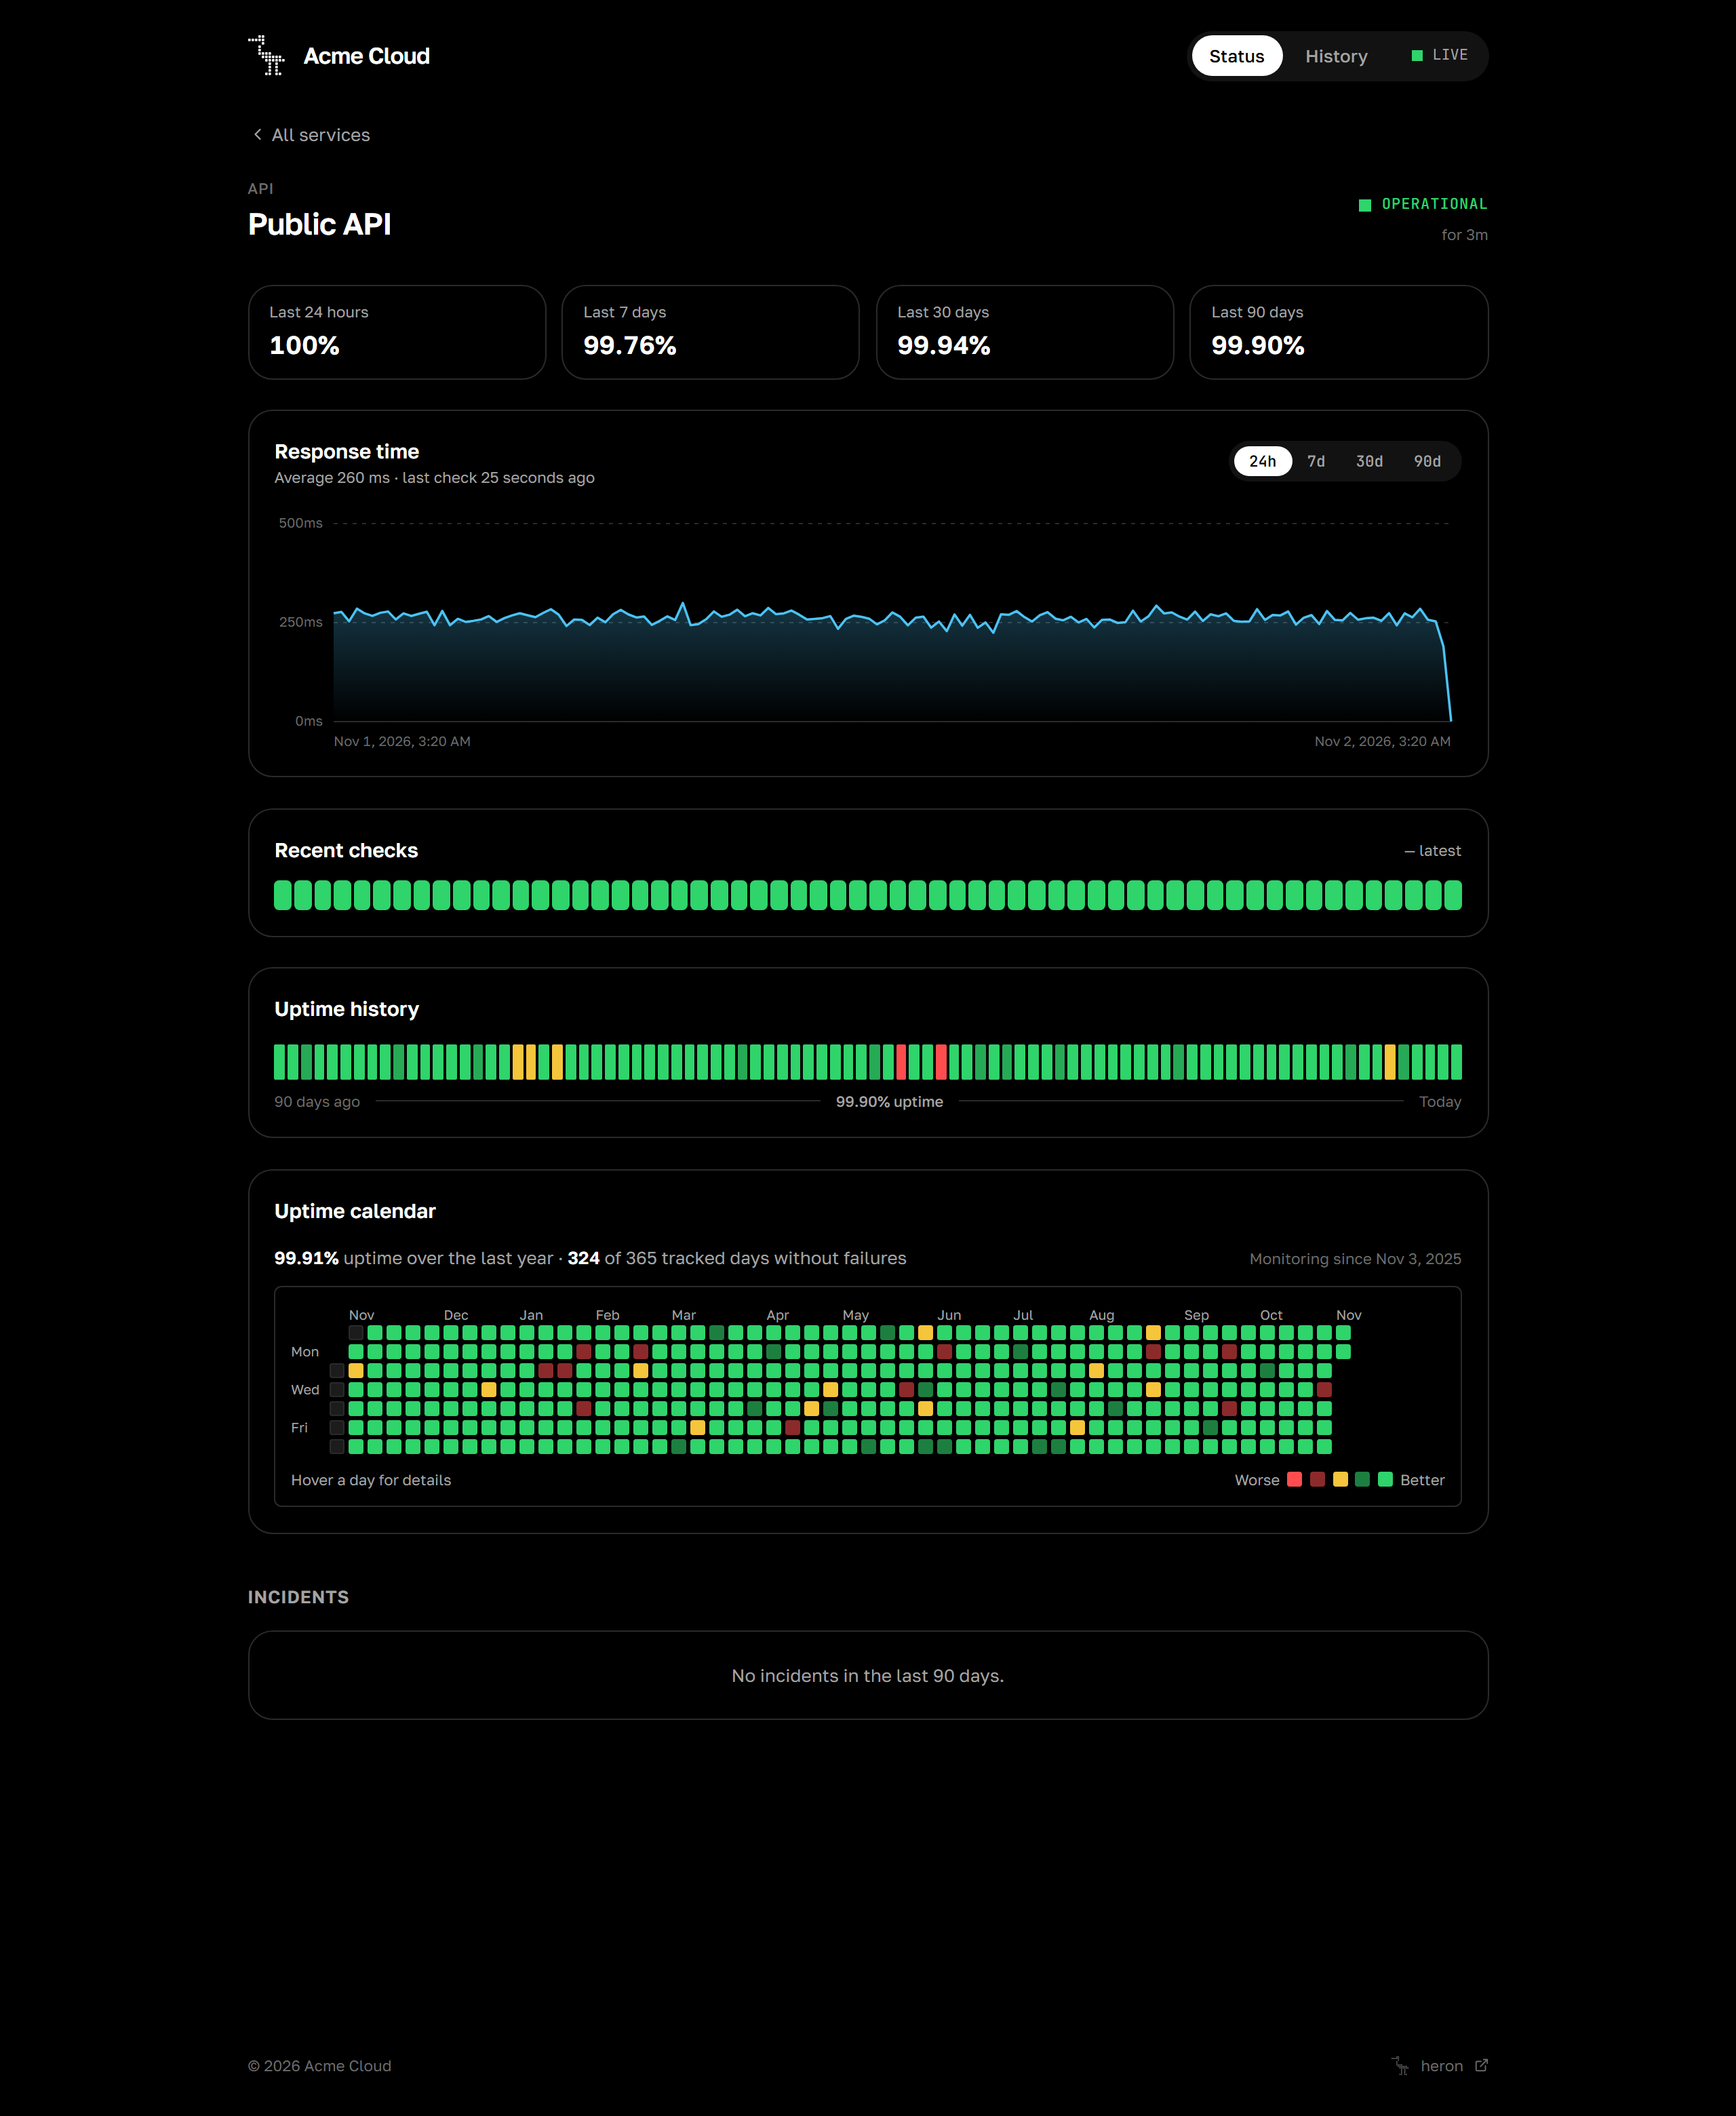
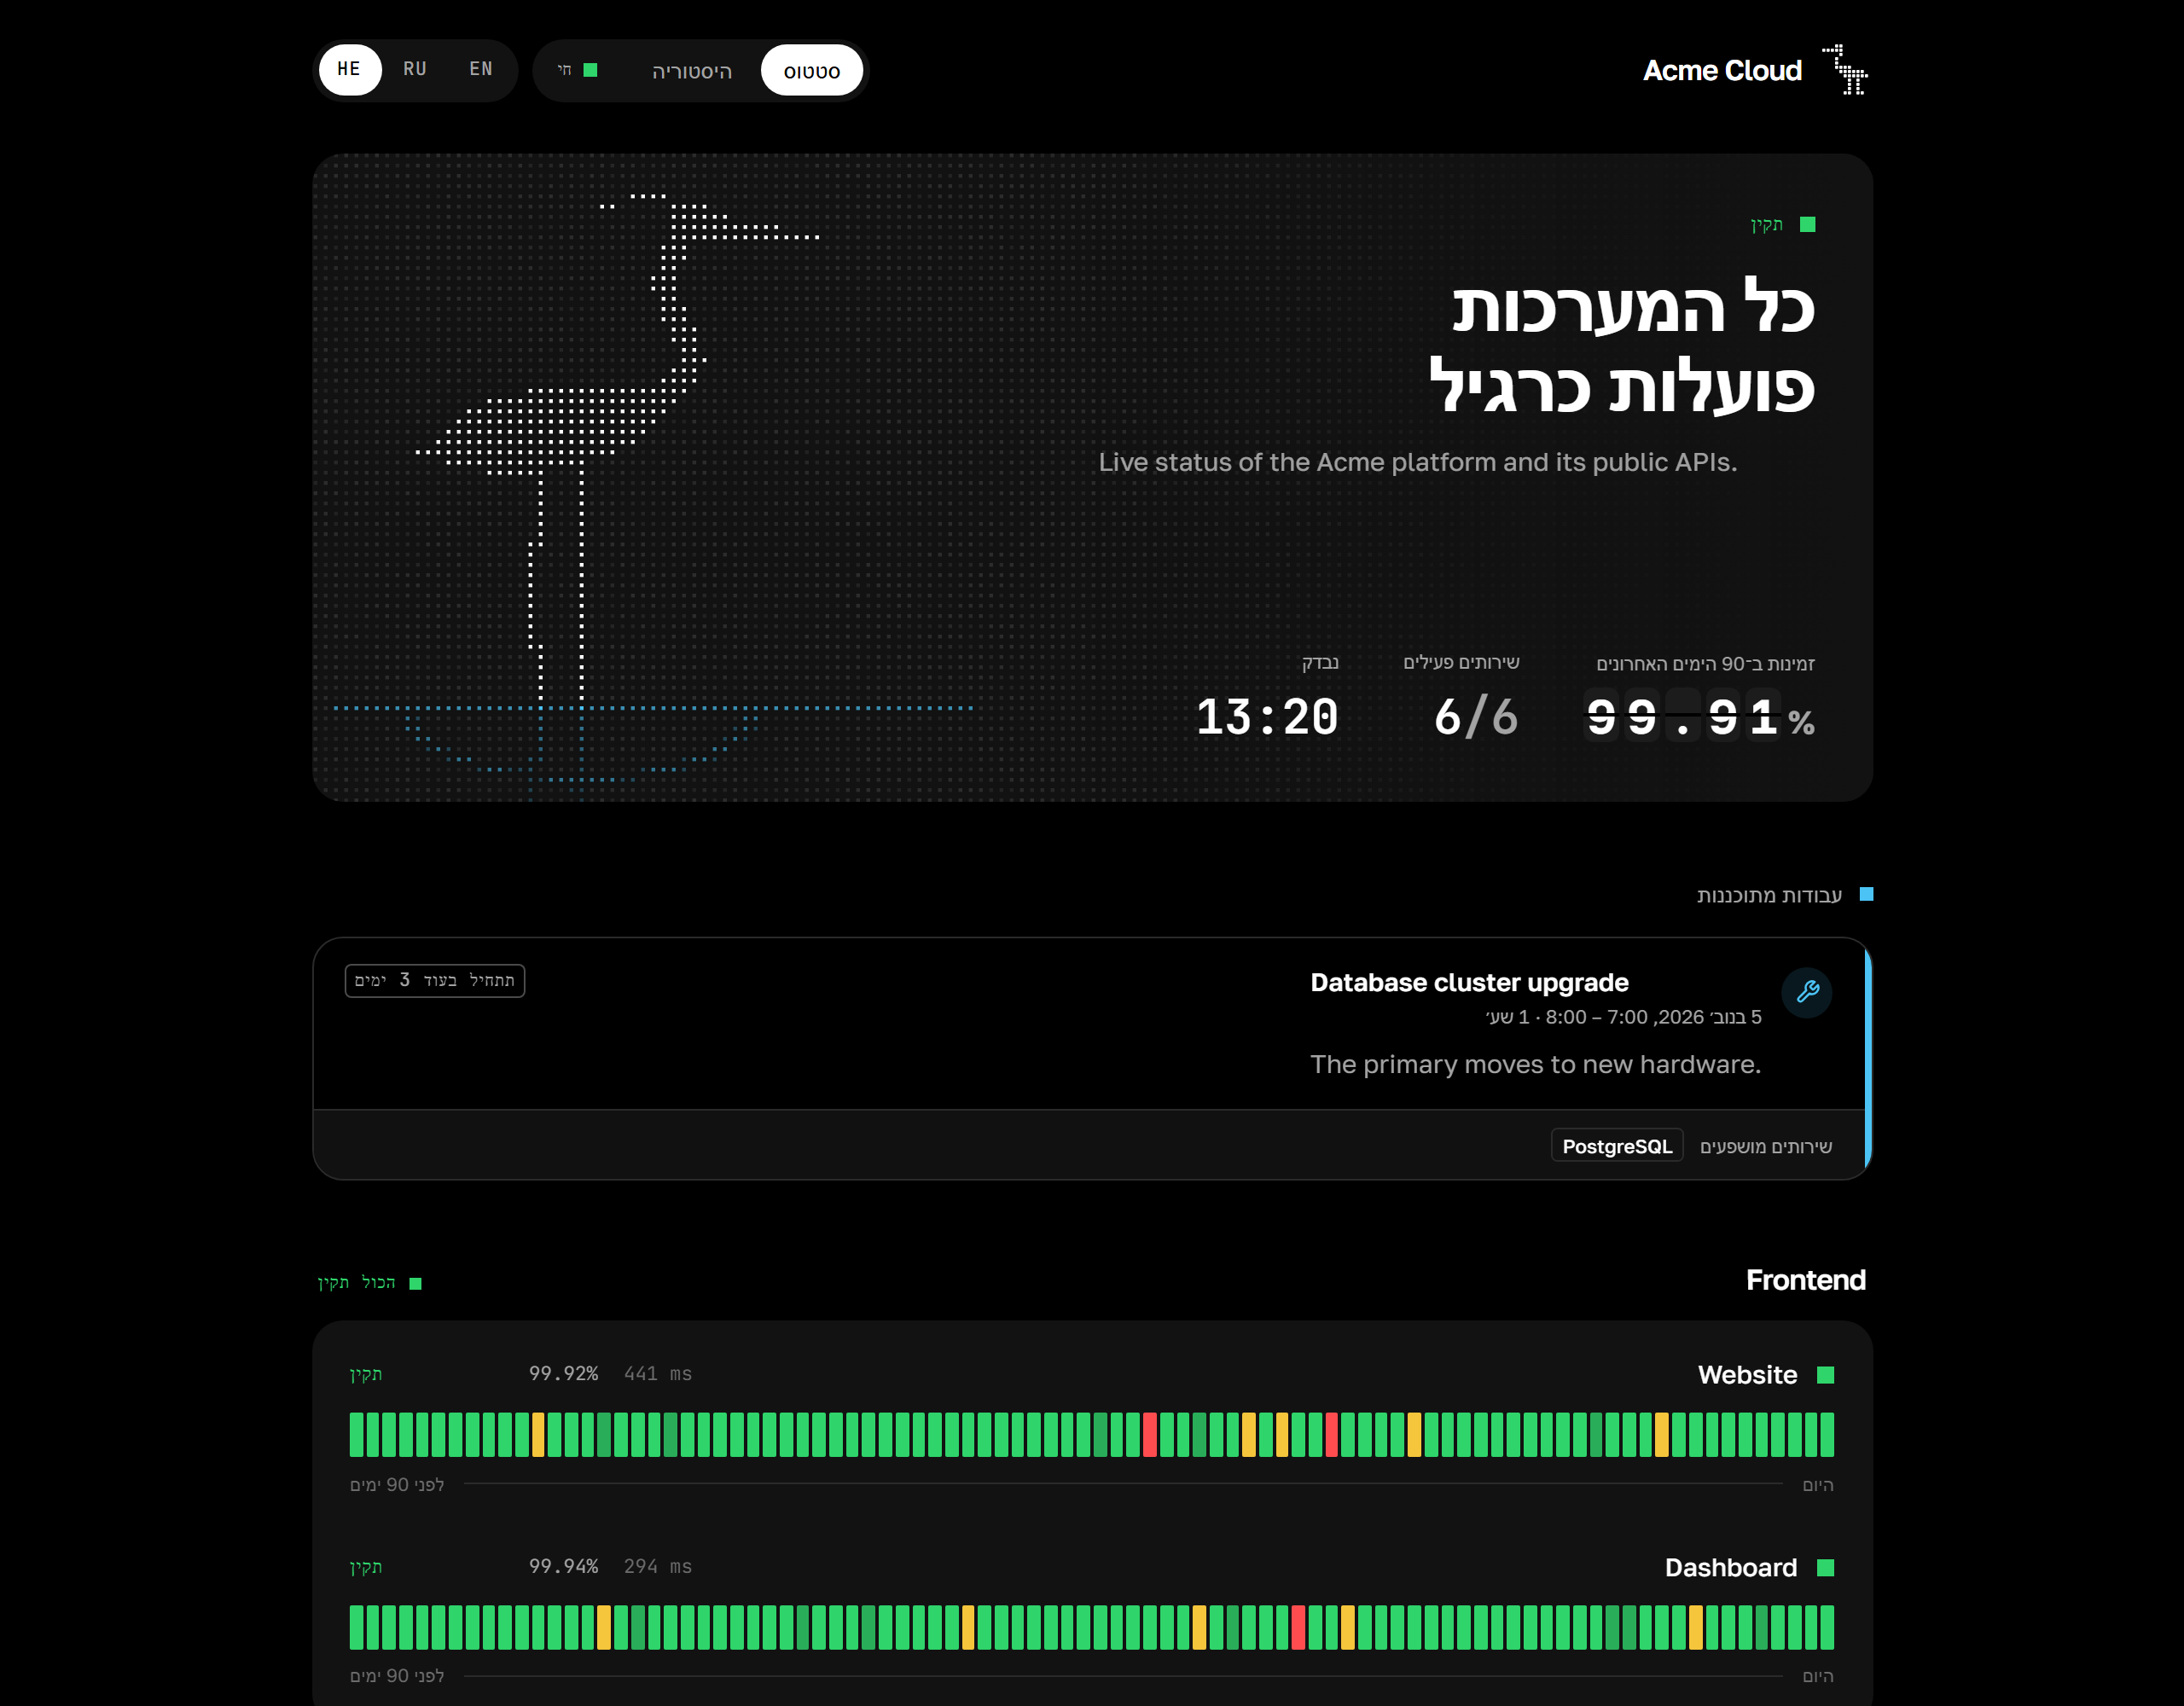
Status page. 90 day uptime bars, a GitHub style calendar for the whole year, response time charts and an incident timeline. Live updates over Server-Sent Events, no refresh needed. Lay it out in a visual editor: drag blocks around, click one to choose what it shows, add notices of your own and preview it on a phone before you publish.
Incidents and maintenance. Incidents open and resolve on their own, and you can write updates by hand. Maintenance windows can be one-off or repeat every day or week. While one is running, alerts stay quiet and the page tells visitors what is going on.
Alerts. Telegram (topics in forum groups work too), Discord with an optional role ping, and signed webhooks, with retries. A monitor only counts as down after the number of failed checks you choose, so a single hiccup does not wake you up. Tell heron what depends on what and a dead server sends one alert, not one for every service on it. A monitor that keeps going up and down sends one "flapping" alert and then stays quiet until it settles.
Team. Invite people with a one-time link and give them a role. Owners manage people and the domain, admins run monitors and incidents, viewers can look around but not touch anything. An audit log keeps a year of who changed what.
Sign-in security. Two-factor codes from any authenticator app, and passkeys, so you can sign in with Face ID, Touch ID, Windows Hello or a hardware key instead of a password.
Three languages. The public page speaks English, Russian and Hebrew, with proper right-to-left layout. It picks the visitor's language on its own and remembers the choice.
Updates. heron notices new releases on GitHub and can install them by itself. The owner sees the release notes in the panel and updates with one click, or lets heron do it on its own. If a new version does not come up healthy, heron goes back to the one that worked.
A black box for outages. The moment a monitor goes down, heron records what it saw: the full answer with headers and body, where the time went, DNS, the certificate chain, the network route and, if Chromium is installed, a screenshot of the page. You find it on the incident, even if everything is back by the time you look.
Early warnings. heron tells you before things break: a service that answers twice as slow as usual, checks that keep failing and passing on the retry, a game server close to its memory limit, a node whose disk fills up in a few days at the current pace.
Game server hosting. Connect a Pelican or Pterodactyl panel and heron watches every node through Wings and every game server on it, with memory and CPU in the check result. New servers show up on their own and deleted ones go away.
Expiry. Every domain and certificate behind your monitors on one screen, with a warning 30, 7 and 1 day before it runs out. Domains are looked up over RDAP, with WHOIS for zones like .ru that have no RDAP.
Backups and moving in. One command or one button saves the whole database, and heron keeps a copy from before every update. Monitors and notifications from Uptime Kuma come over in one go.
Extras. SVG badges for your README, a small script that shows a notice on your own website during an outage, a /metrics endpoint for Prometheus and Grafana, and a dark admin panel that matches the public page.
The page editor
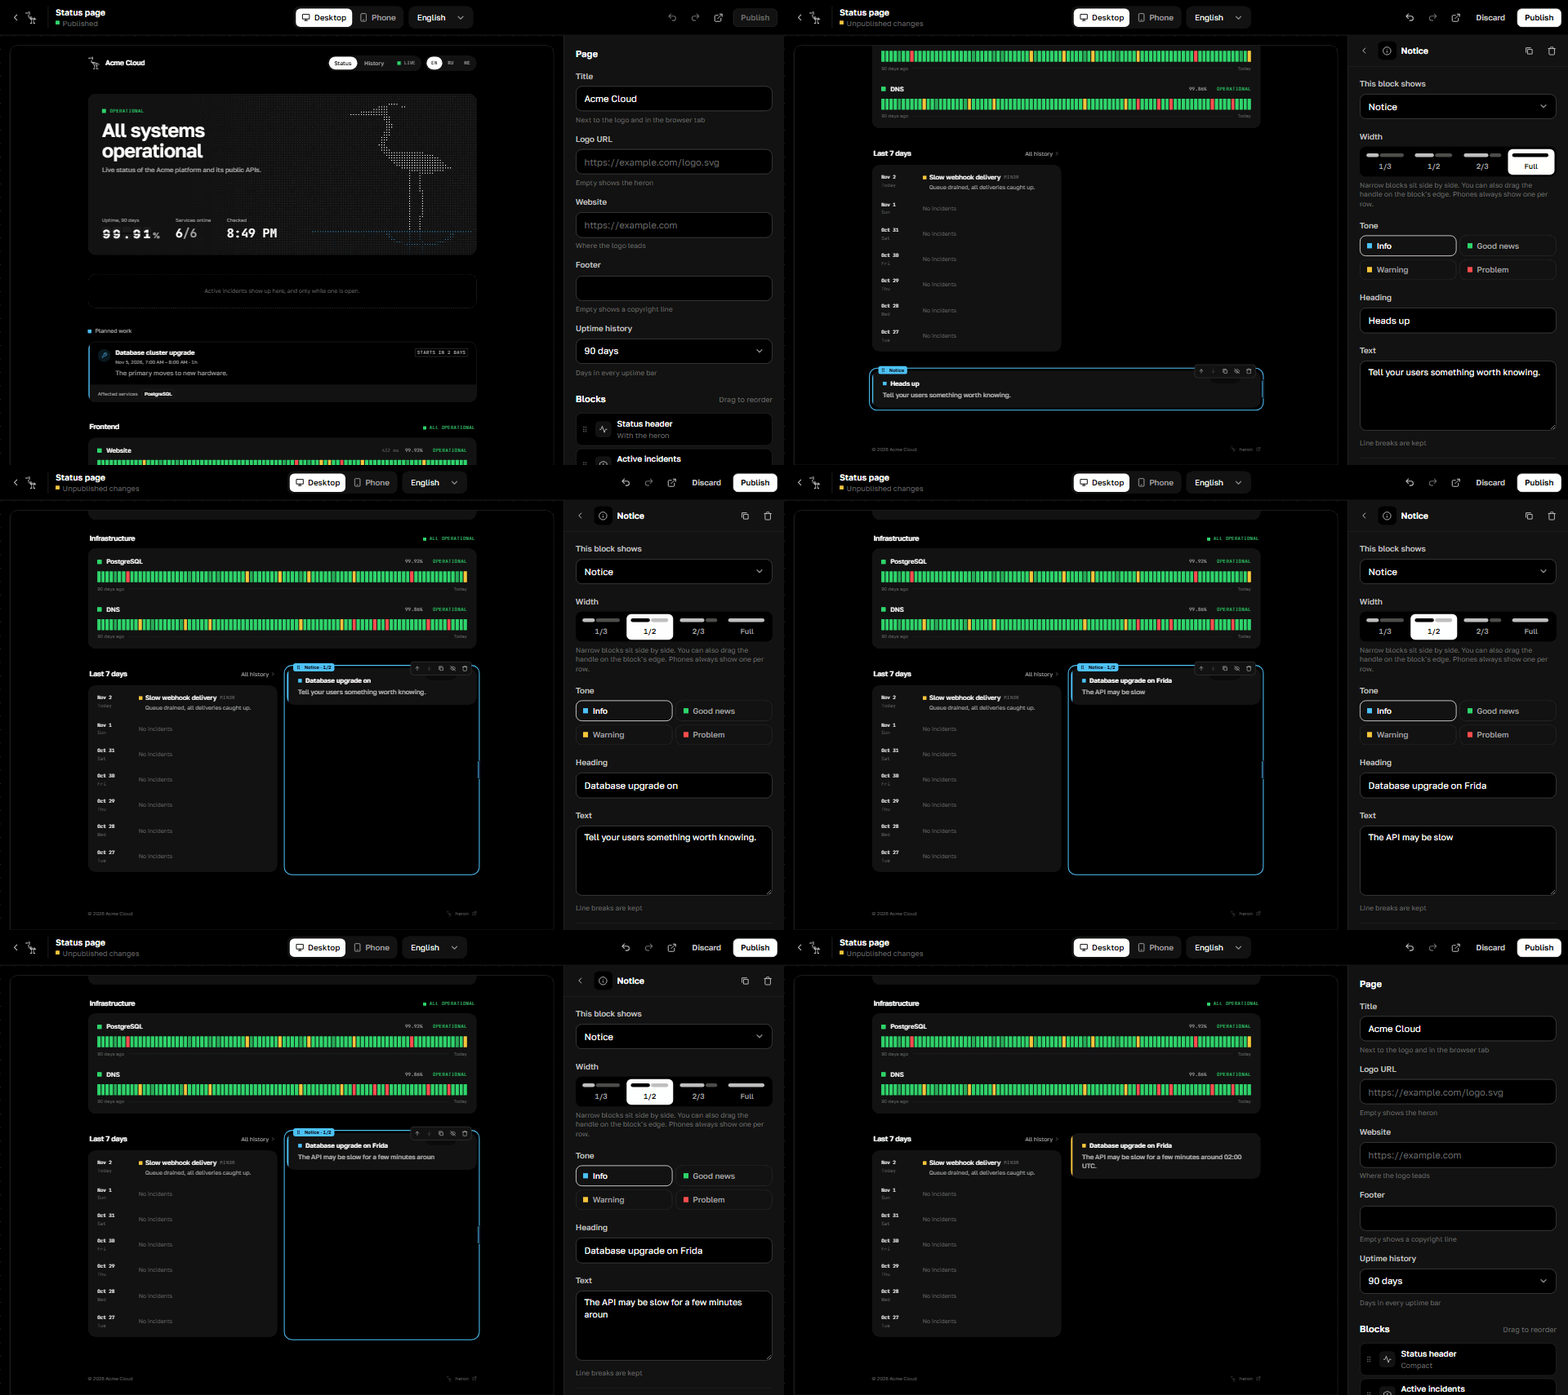
Status page in the sidebar opens the real public page with your live data. Click a block to choose what it shows, drag it by the handle to move it, pull its edge to make it a third, half or two thirds wide, and use the plus under a block to add a new one. Notices are typed right on the page. Every block can be hidden without losing its settings. Switch between desktop and phone and between the three languages to check how visitors see it. Nothing changes for them until you press Publish, and Ctrl+Z undoes any step before that.
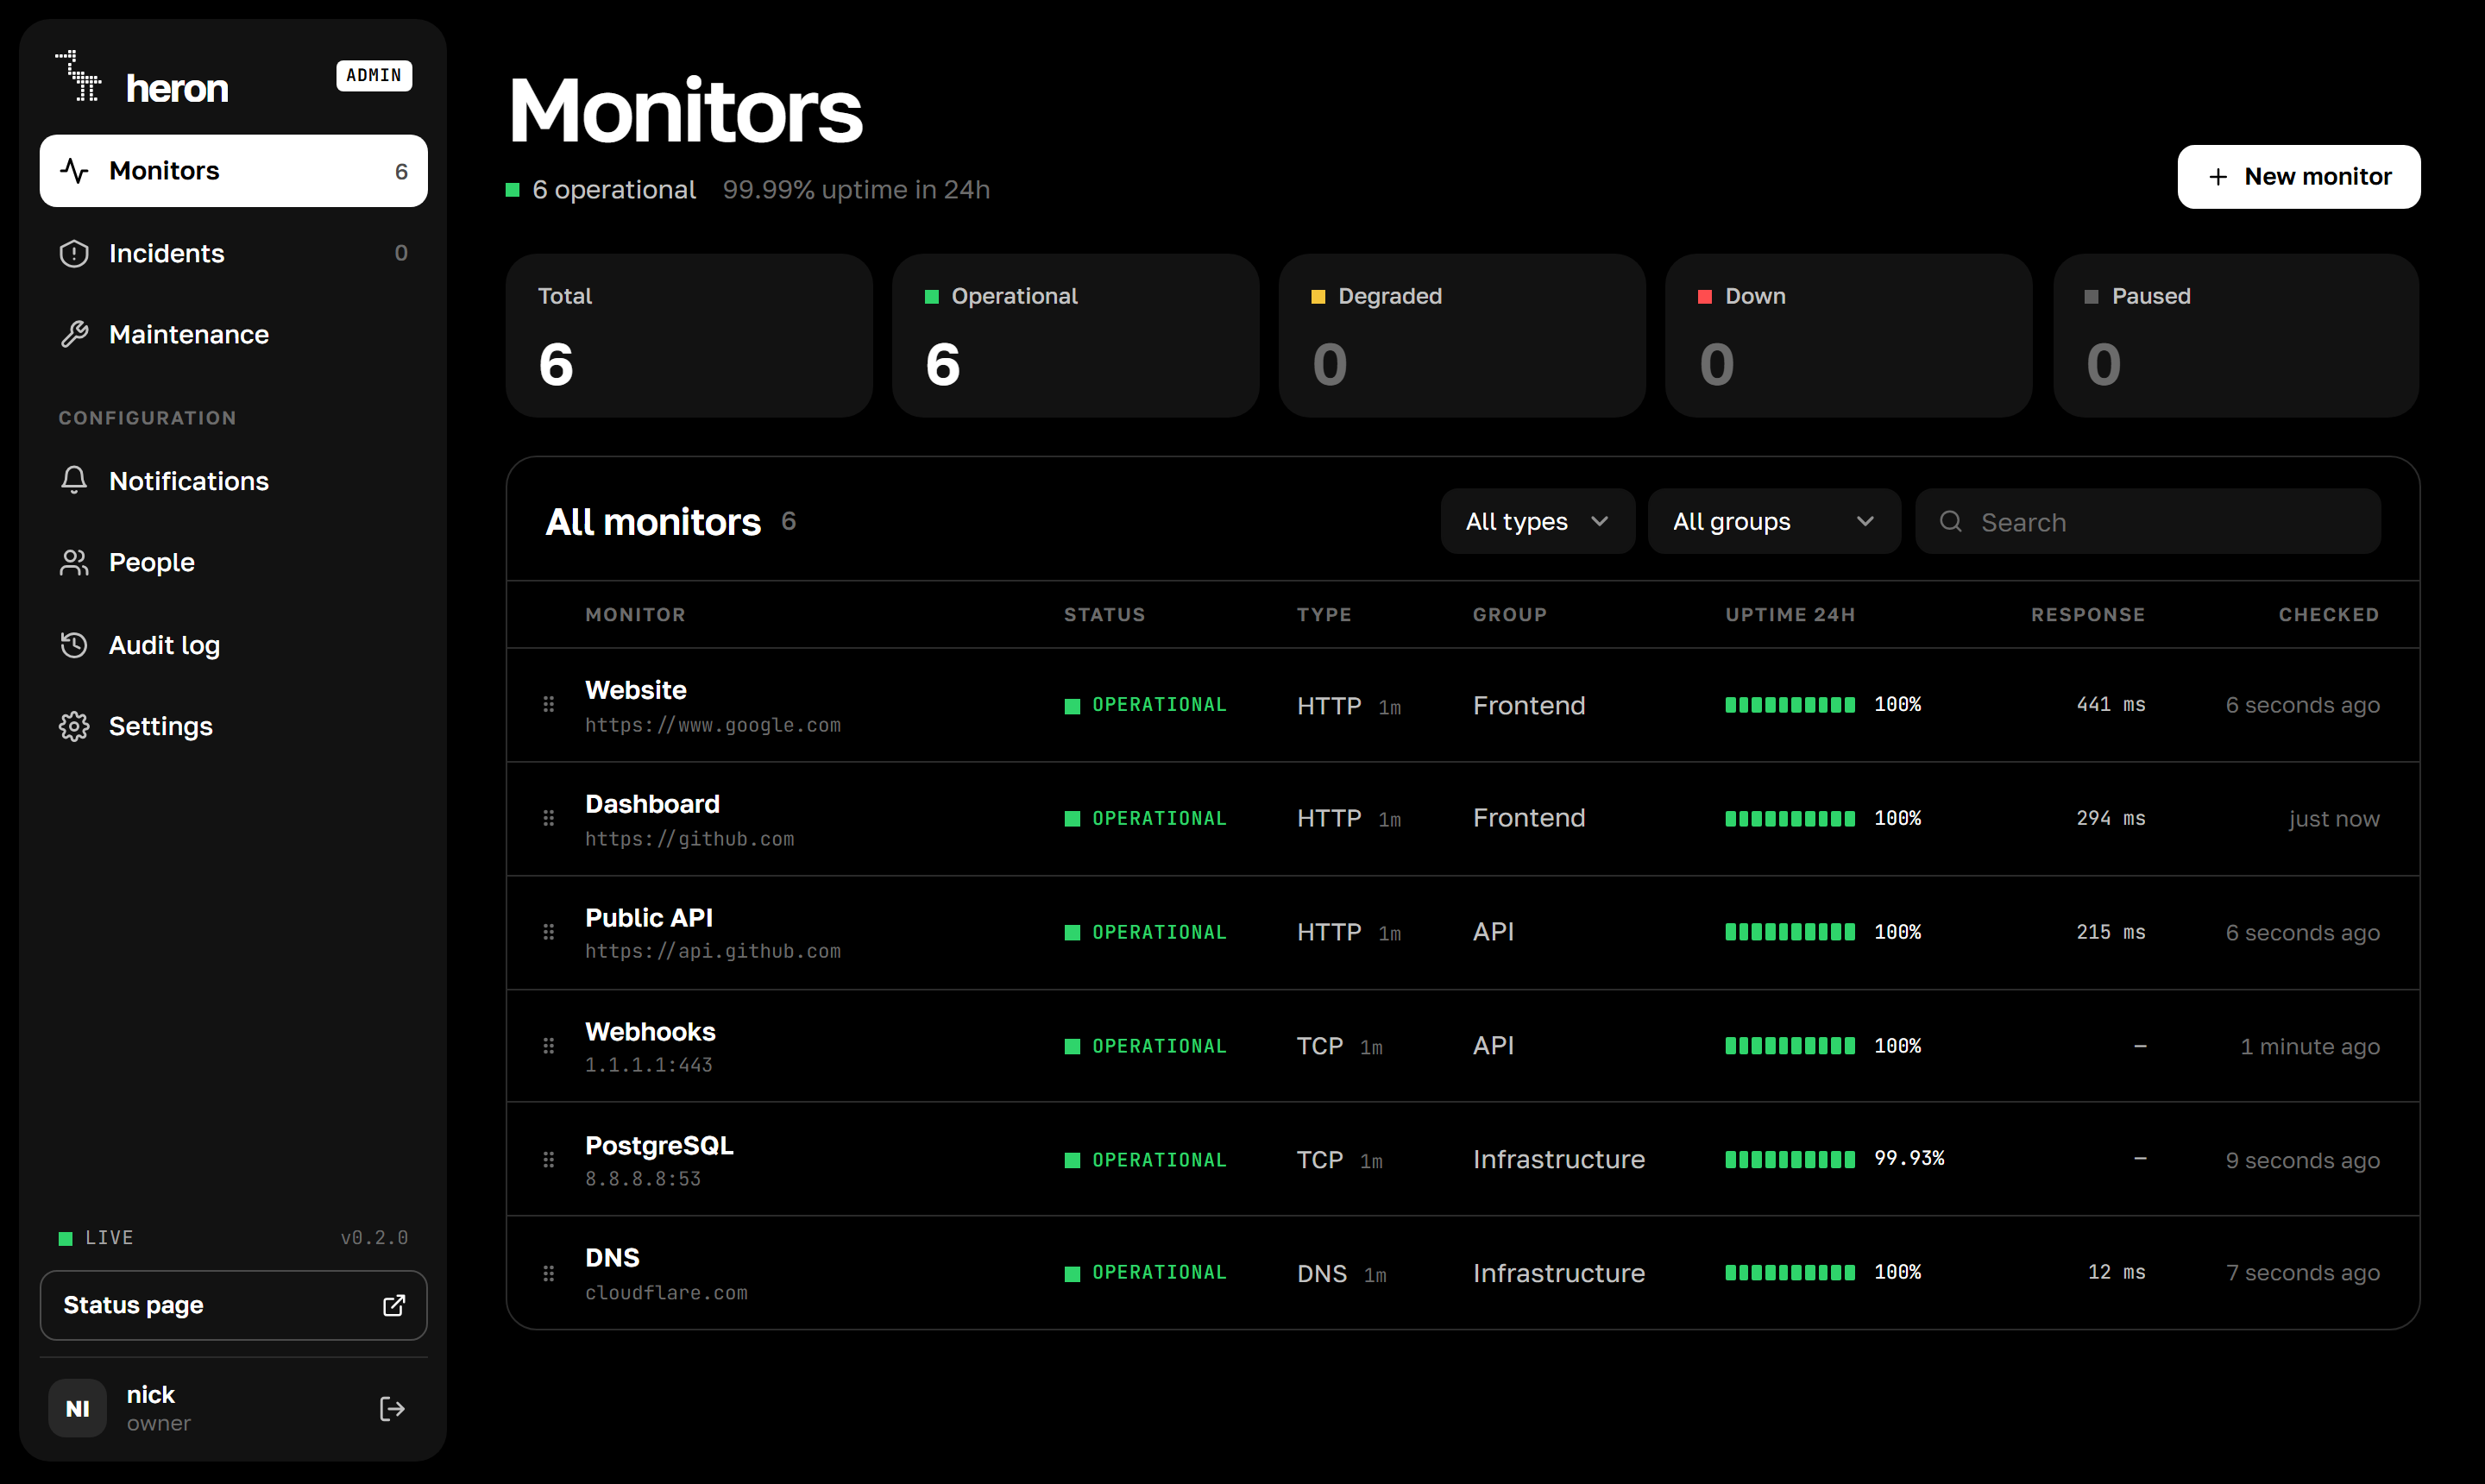
The admin panel
All monitors on one screen. Filter them by type or group, search by name or address, and drag rows to change the order on the public page.
Adding a monitor takes one field. Paste a website, an address with a port, an IP or a database URL, and heron works out what kind of check it needs. Check now tries it before you save. Everything else waits under More settings with sensible defaults.
How it compares
There are good tools in this space already. This is where heron sits next to the ones people usually ask about.
| heron | Uptime Kuma | Gatus | Upptime | |
|---|---|---|---|---|
| Runs as | One Go binary | Node.js app | One Go binary | GitHub Actions and Pages |
| Set up through | A web installer | The web UI | A YAML file | A template repository |
| HTTPS | Built in, Let's Encrypt | Your own proxy | Your own proxy | GitHub Pages |
| Page layout | Visual editor | Basic page settings | Config file | Config file |
| People | Owner, admin and viewer roles, audit log | One account | Not needed, it has no admin UI | GitHub access |
| Alert services | Telegram, Discord, webhooks | 90 and more | Dozens | GitHub issues and a few chat apps |
| Moving in | Imports from Uptime Kuma |
Pick Uptime Kuma if you need a long list of notification services today. Pick Gatus if you want everything in a config file under version control. Pick Upptime if you do not want to run a server at all. heron is for when you want one small process on your own box, a page that looks good without work, and a panel more than one person can use.
Working as a team
Open People, pick a role and create a link. It works once and expires after 72 hours, so you can send it in any chat. Whoever opens it chooses their own username and password and lands straight in the panel.
| Role | What they can do |
|---|---|
| Owner | Everything, plus inviting and removing people and changing the domain |
| Admin | Monitors, incidents, maintenance, notifications and the status page |
| Viewer | Sees the panel, cannot change anything. Passwords and tokens stay hidden |
The first account created during setup is the owner. From the same page the owner can change roles, sign someone out on every device or reset their two-factor if they lost their phone.
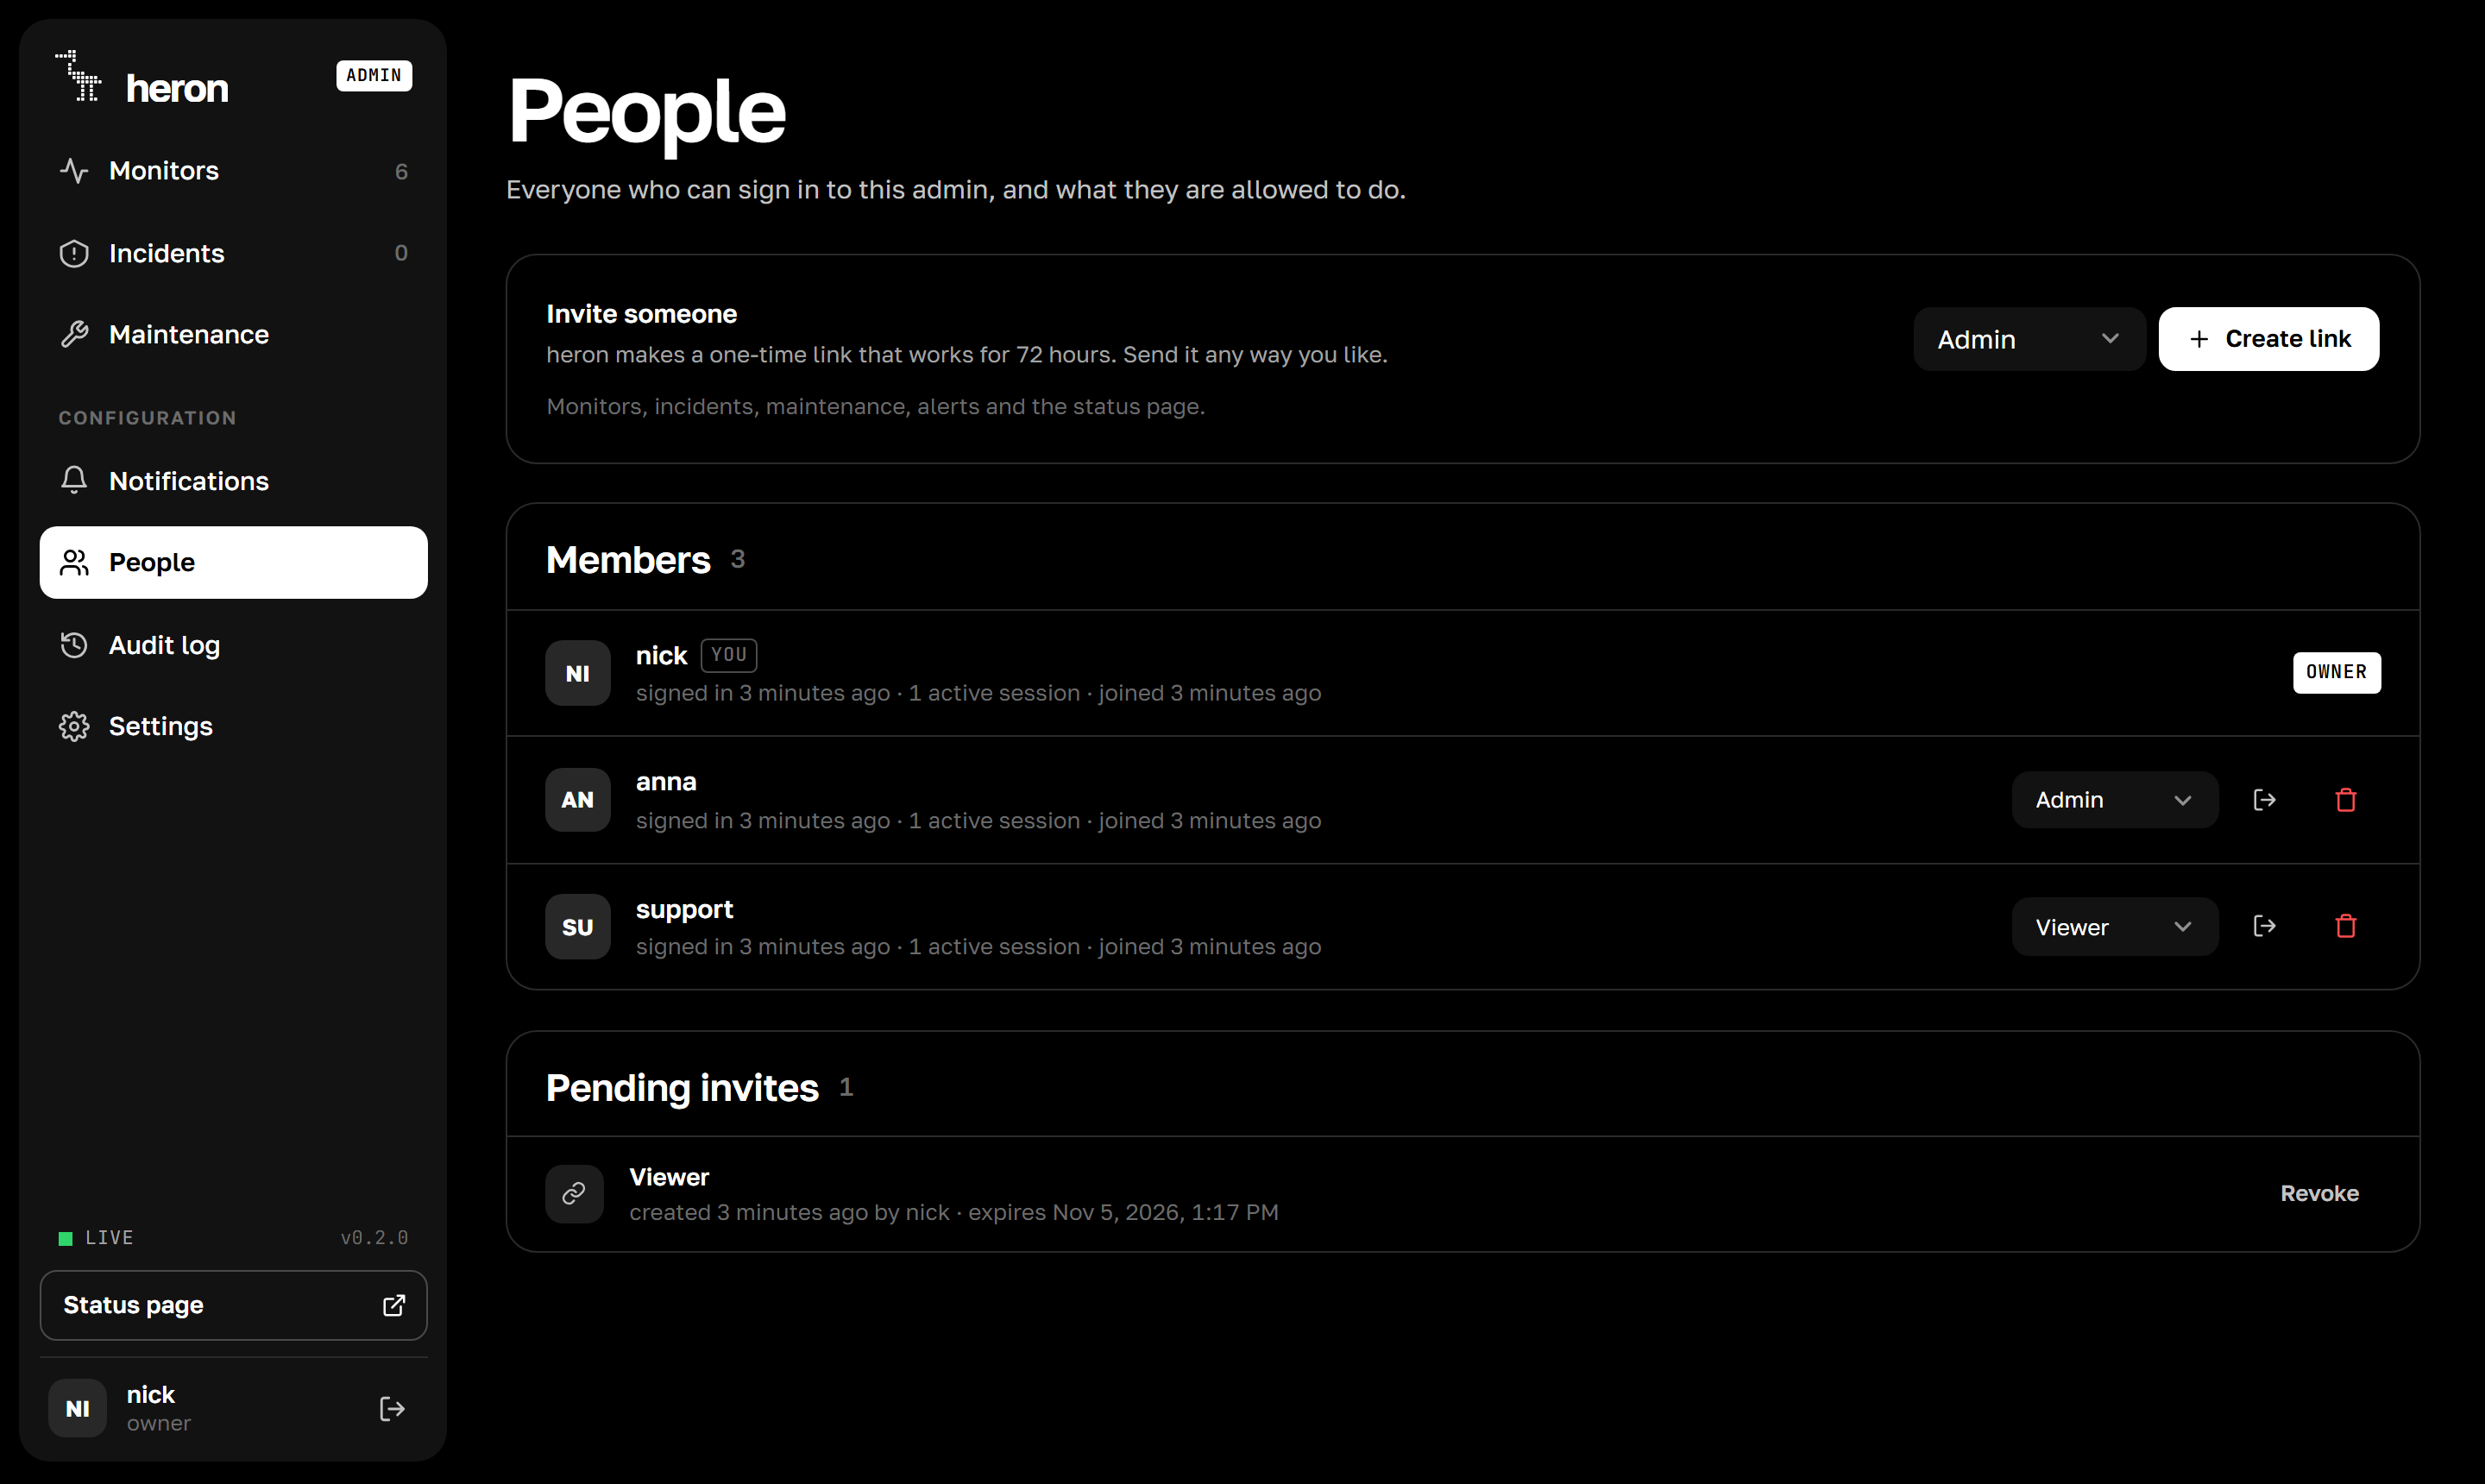
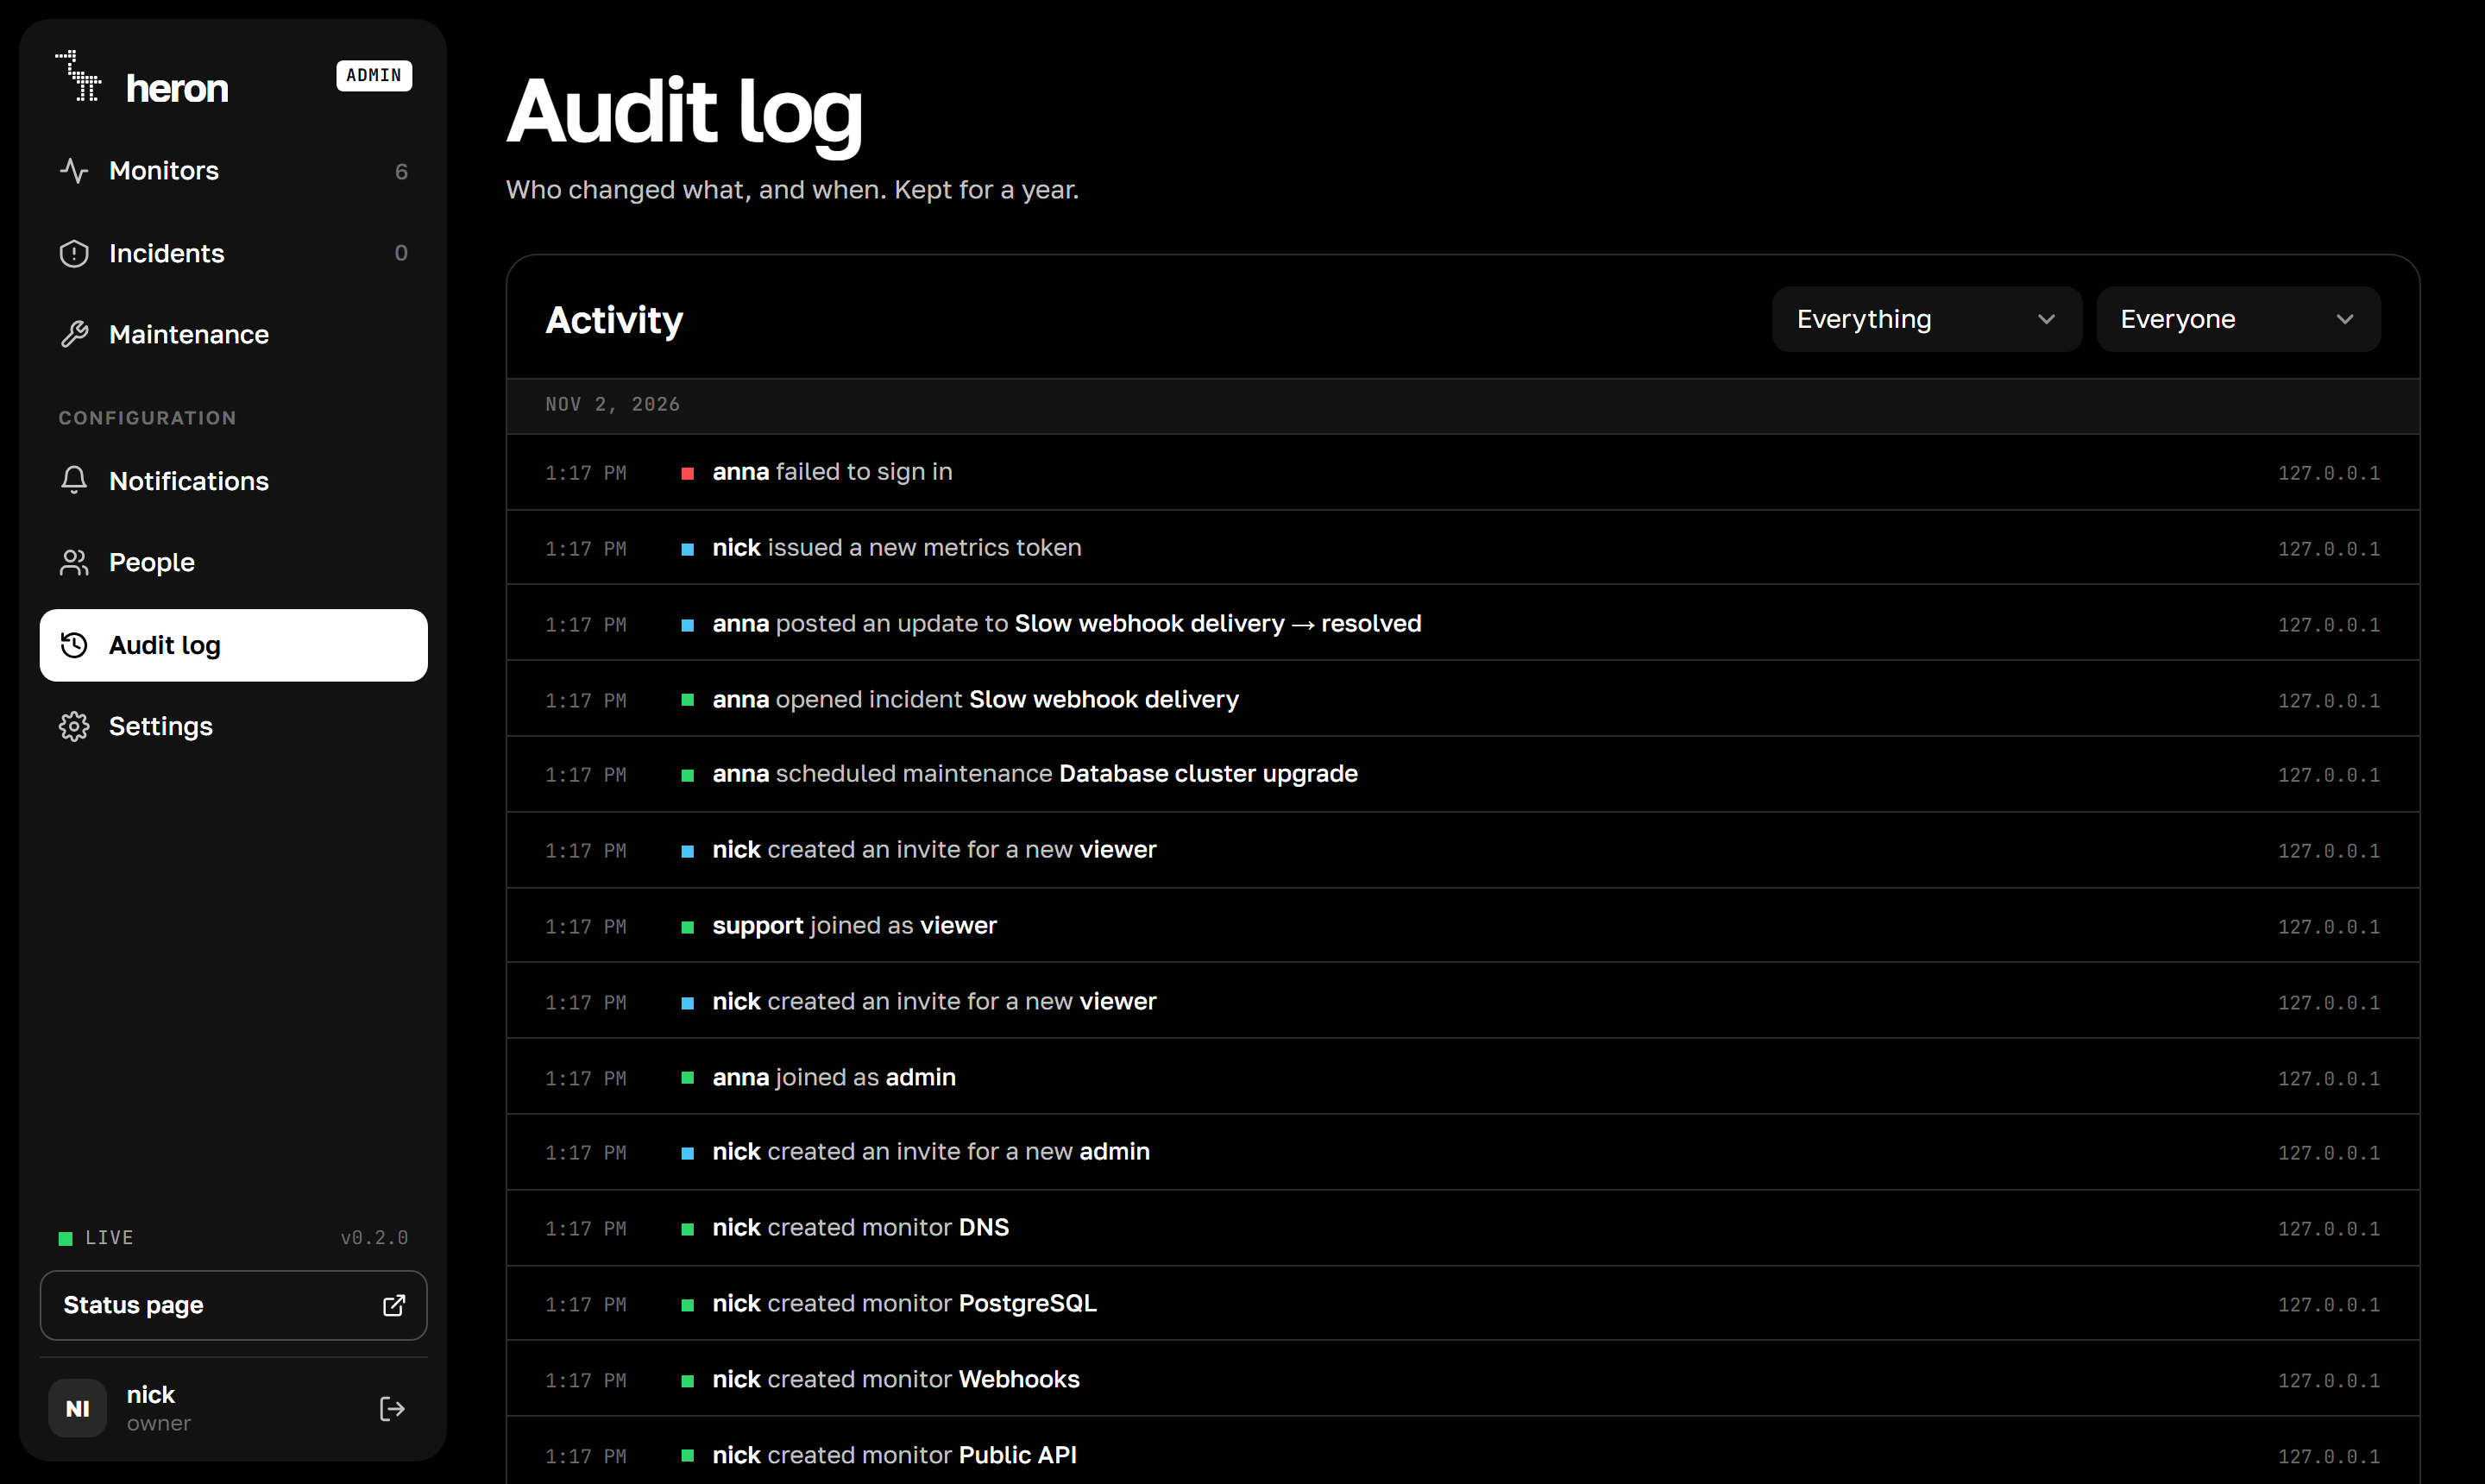
Every change lands in the Audit log: monitors, incidents, maintenance, settings, people, and sign ins including failed ones. You can filter it by kind of activity or by person.
Signing in safely
Each person turns these on for themselves under Settings, Sign-in security.
Authenticator app. Scan the QR code with Google Authenticator, 1Password, Aegis or anything that speaks TOTP. From then on heron asks for a six digit code after the password, and a code can only be used once.
Passkeys. Add one per device. The sign in page gets a "Sign in with a passkey" button that skips the password entirely. Browsers only allow passkeys over HTTPS, so set up a domain first.
Locked out of your own two-factor? On the server:
sudo -u heron heron user reset-2fa -u yourname
Languages
The switcher in the top corner of the public page offers English, Russian and Hebrew. Hebrew flips the whole layout to right-to-left. Only the interface is translated. Monitor names, incident updates and your page description stay exactly as you wrote them. The admin panel is in English.
Getting it running
You need a Linux server and, ideally, a domain or subdomain pointed at it with an A record.
curl -fsSL https://raw.githubusercontent.com/nethercoded/heron/main/deploy/install.sh | sudo sh
The script downloads the latest release, checks its checksum, creates a heron system user and starts the service. At the end it prints a one-time setup code. Open http://your-server:8080 and the installer takes it from there.
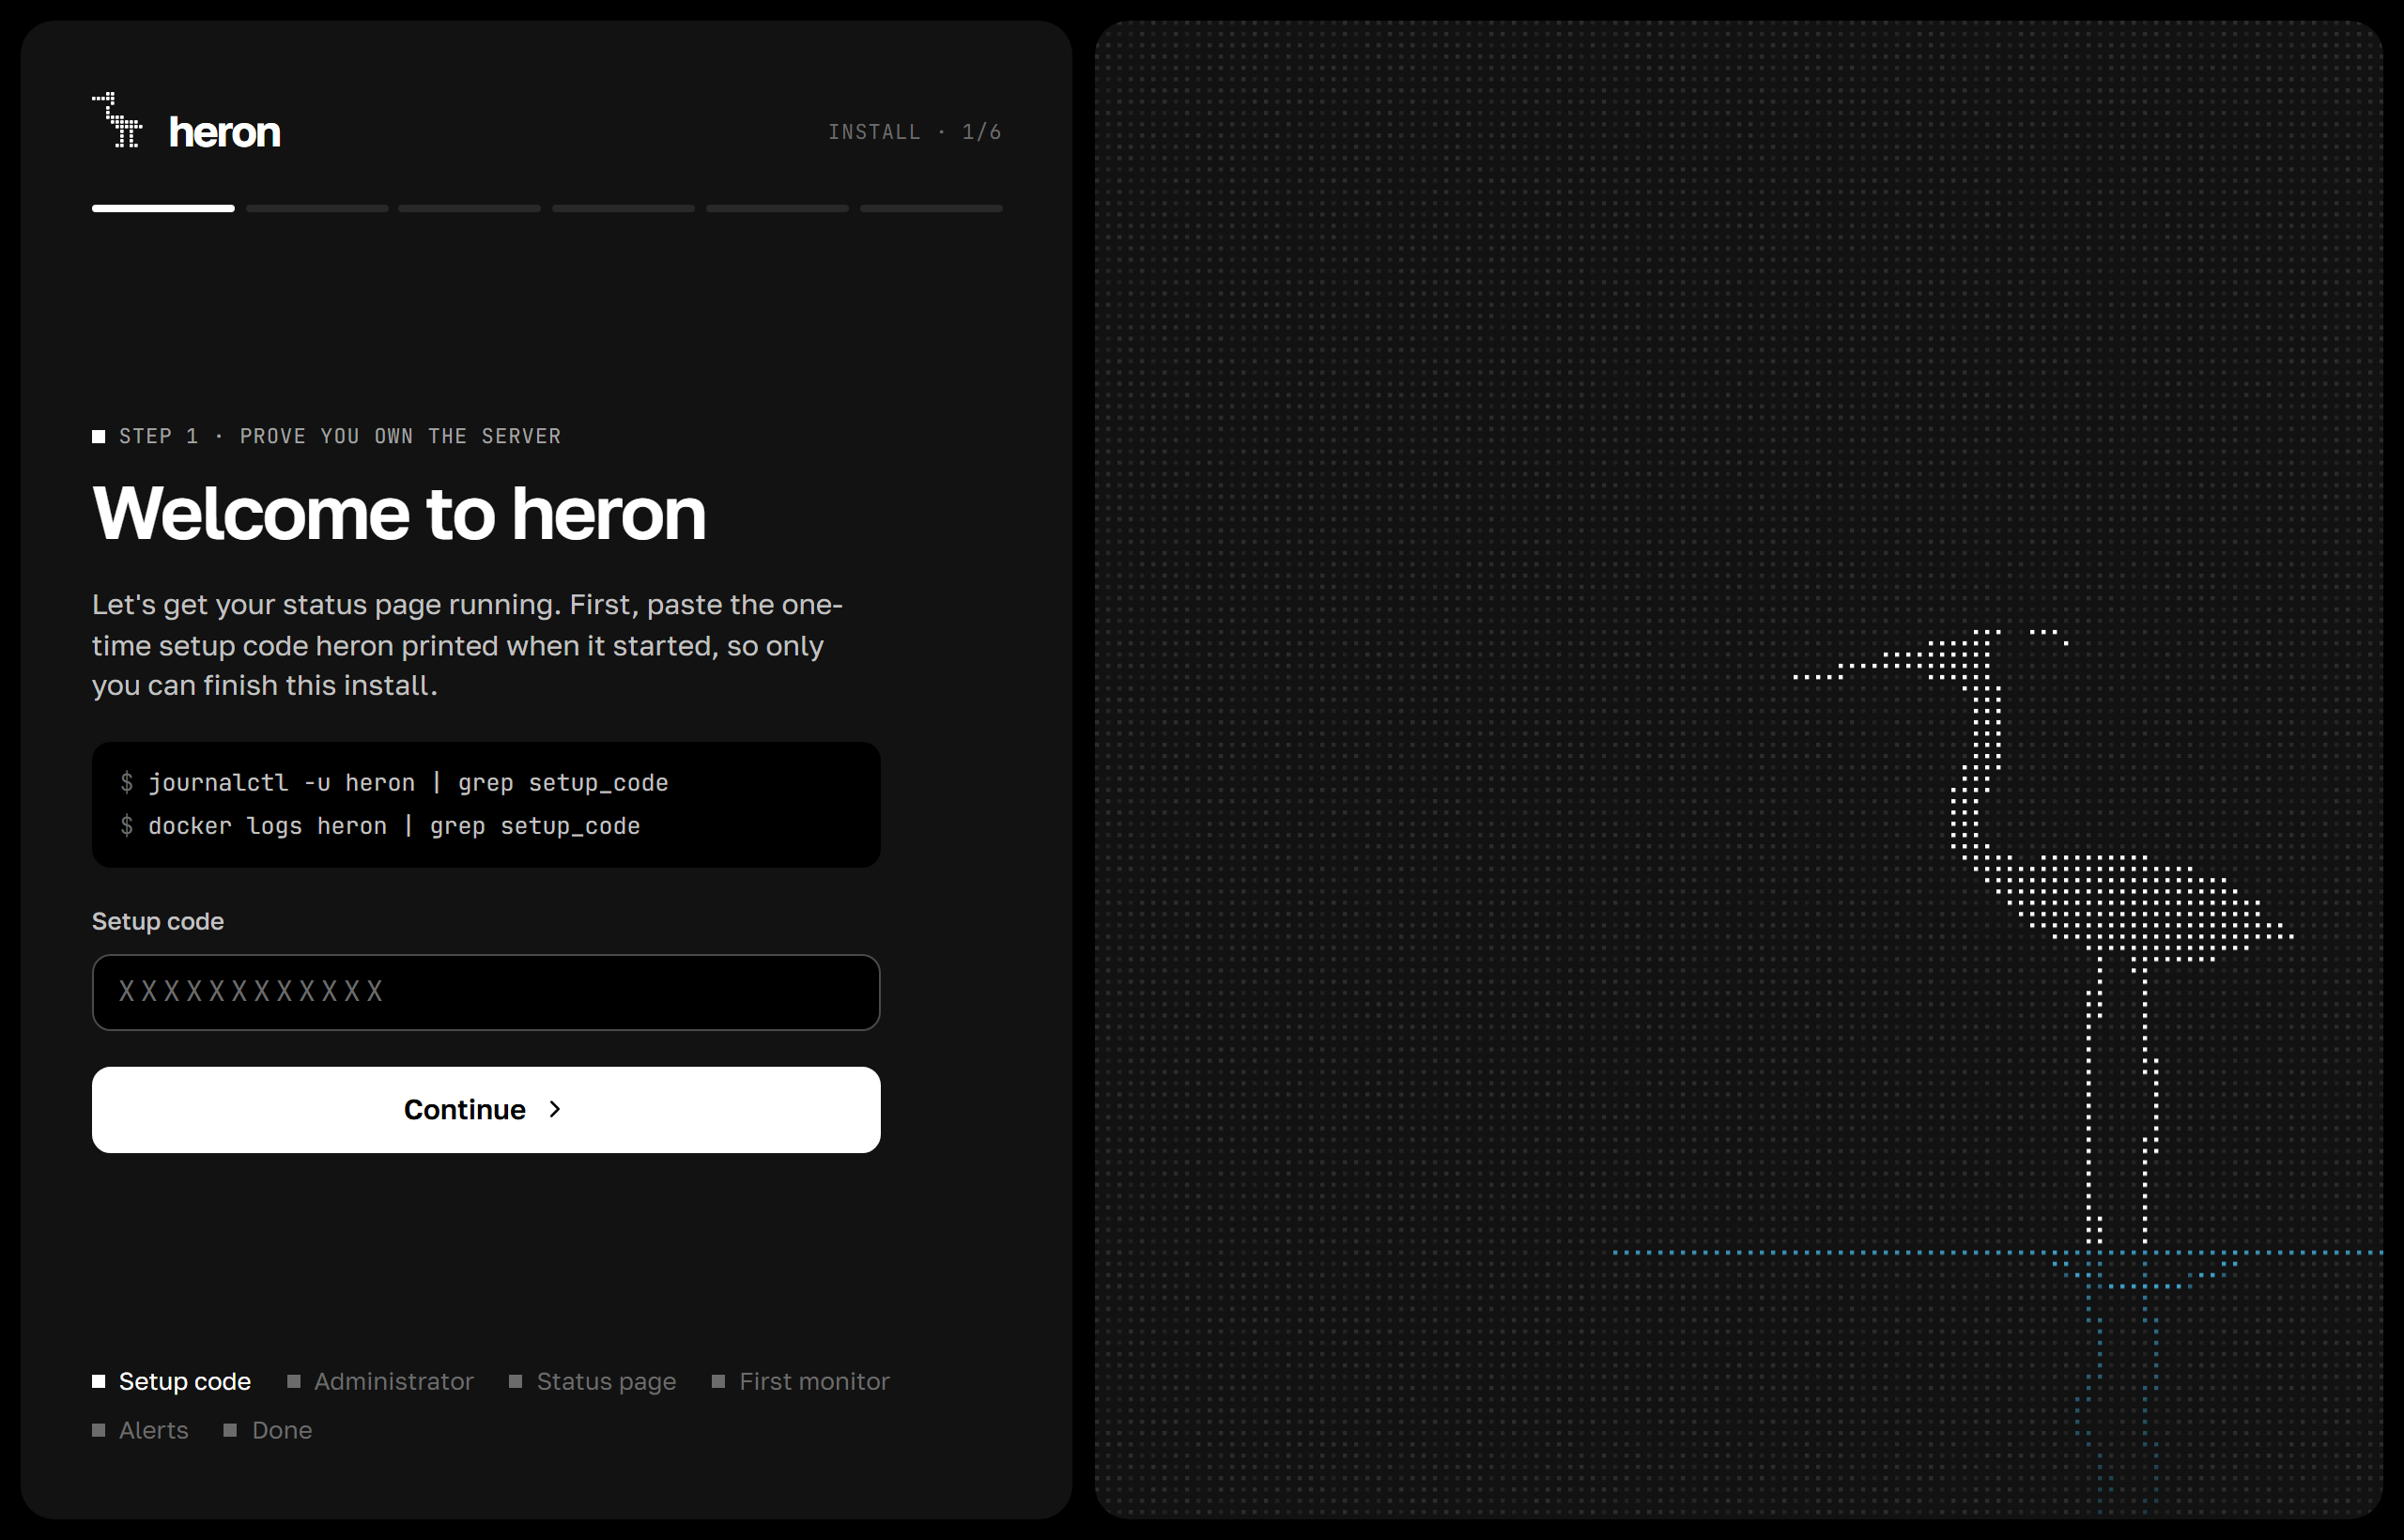
The installer walks you through seven short steps:
- Setup code. Proves you are the one who owns the server, so nobody can grab a fresh install before you do.
- Domain. Enter something like
status.example.com. heron checks that the record points at the server, gets a certificate from Let's Encrypt, starts serving HTTPS on ports 80 and 443 and moves you over to the new address. If you already run nginx or Caddy, pick the reverse proxy option and heron will only remember the address. - Administrator. Your username and password. This account becomes the owner.
- Status page. Title, description and an optional logo.
- First monitor. Any URL you care about.
- Alerts. A Telegram bot token and chat. heron sends a test message straight away.
- Done.
Everything except the setup code and the account can be skipped and changed later in the panel.
Lost the code? It is in the log:
journalctl -u heron | grep setup_code
Docker
docker run -d --name heron \
  -p 80:80 -p 443:443 -p 8080:8080 \
  --sysctl net.ipv4.ip_unprivileged_port_start=0 \
  --cap-add NET_RAW \
  -v heron-data:/data \
  ghcr.io/nethercoded/heron:latest

docker logs heron | grep setup_code
There is also a compose.yaml in the repository.
From source
You need Go 1.27 or newer, Node 24 or newer and pnpm.
git clone https://github.com/nethercoded/heron && cd heron
cd web && pnpm install && pnpm build && cd ..
go build ./cmd/heron
./heron serve
If you have Task installed, task build does the same.
Configuration
Most things are set in the panel. The few that belong to the server live in heron.toml (next to the binary, in $HERON_CONFIG, or passed with -config). Every key can also come from an environment variable.
| Key | Variable | Default | What it does |
|---|---|---|---|
listen |
HERON_LISTEN |
:8080 |
Address for plain HTTP, handy for local access and proxies |
data_dir |
HERON_DATA_DIR |
./data |
Where the database and certificates are stored |
public_url |
HERON_PUBLIC_URL |
Address used in alerts when no domain is set in the panel | |
timezone |
HERON_TIMEZONE |
UTC |
Which midnight the daily uptime bars use |
retention_days |
HERON_RETENTION_DAYS |
7 |
How long raw checks are kept. Hourly totals stay for a year |
trusted_proxies |
HERON_TRUSTED_PROXIES |
Proxies allowed to set X-Forwarded-For |
|
icmp_privileged |
HERON_ICMP_PRIVILEGED |
false |
Use raw sockets for ping, needs CAP_NET_RAW |
check_updates |
HERON_CHECK_UPDATES |
true |
Look for new releases on GitHub every six hours |
demo |
HERON_DEMO |
user:password of a read-only account shown on the sign in page |
|
log_level |
HERON_LOG_LEVEL |
info |
debug, info, warn or error |
log_format |
HERON_LOG_FORMAT |
text |
text or json |
There is an example in heron.example.toml.
Behind your own proxy
Point the proxy at port 8080, turn off buffering so live updates get through, and add the proxy to trusted_proxies so login limits apply per visitor and not to everyone at once.
location / {
    proxy_pass http://127.0.0.1:8080;
    proxy_set_header Host $host;
    proxy_set_header X-Forwarded-For $proxy_add_x_forwarded_for;
    proxy_buffering off;
}
With Caddy it is a single line: reverse_proxy 127.0.0.1:8080.
Push monitors
Create a monitor of type Push and heron gives you a URL. Call it at the end of your job:
0 3 * * * /usr/local/bin/backup.sh && curl -fsS -m 10 --retry 3 https://status.example.com/api/push/<token>
If no call arrives within the interval plus a grace period, the monitor goes down. A job can also report a failure or its own timing:
/api/push/<token>?status=down&msg=disk%20full
/api/push/<token>?status=up&ping=532
Badges and the widget
[](https://status.example.com)
[](https://status.example.com/monitor/api)
Use /badge/<slug> for a single monitor, /badge/<slug>/uptime?period=24h|7d|30d|90d for uptime and /badge/<slug>/response for the last response time. Add ?label= to change the text on the left.
The widget stays hidden while everything is fine and shows a small card on your site when something is wrong or maintenance is running:
<script src="https://status.example.com/widget.js" data-position="bottom-right" async></script>
You can move it with data-position, announce planned work early with data-upcoming="true" and change how often it refreshes with data-refresh (in seconds).
Prometheus and Grafana
/metrics is off until you ask for it. Go to Settings, Prometheus, press Turn on and copy the scrape config heron shows you:
scrape_configs:
  - job_name: heron
    scheme: https
    metrics_path: /metrics
    authorization:
      credentials: <token>
    static_configs:
      - targets: ['status.example.com']
You get heron_monitor_up, heron_monitor_status, heron_monitor_latency_seconds, heron_monitor_uptime_ratio for 24 hours and 30 days, heron_monitor_last_check_timestamp_seconds and heron_incidents_open. Every monitor series carries monitor, name, kind and group labels.
Updates
heron asks GitHub for the latest release a minute after it starts and every six hours after that. When there is a new one, the owner sees a green dot next to the version in the sidebar and the release notes in Settings, Updates.
Press Update and heron downloads the archive for your platform, checks it against checksums.txt from the same release, makes sure the new binary starts, and restarts on it. The panel and the status page are gone for a few seconds and come back on the new version. Turn on Install updates automatically and heron does all of this without you.
The new binary goes to bin/heron inside the data directory, so the service user can write it without root. The installer's systemd unit and the Docker image both work this way, and the update survives restarts: on every start heron runs the newest binary it has. If you later install a newer version over /usr/local/bin/heron by hand, the old download is thrown away.
Before it downloads anything heron saves the database to backups/before-update-<time>-<version>.db and keeps the last five. The new version then has two minutes to answer on /healthz. If it does not, or if it crashes twice before that, heron puts the previous binary back, restores the database from that copy when the new version had already changed its schema, and starts the old version again. The panel tells the owner what happened, and automatic updates skip that release until you install it by hand.
You can also update from a shell:
sudo heron update
sudo systemctl restart heron
heron update -check only tells you whether there is something new. Set check_updates = false if the server should never talk to GitHub on its own.
Backups
Settings, Backups, Download a backup gives you the whole database as one SQLite file. On the server:
heron backup                     # writes data/backups/heron-<time>.db
heron backup -o /mnt/heron.db    # or anywhere you like
It is safe to run while heron is serving. To bring a backup back, stop heron first:
sudo systemctl stop heron
sudo -u heron heron restore /mnt/heron.db
sudo systemctl start heron
restore checks that the file really is a heron database from this or an older version, and keeps the database it replaces as heron.db.before-restore.
Running a public demo
Set demo = "demo:look-around" and heron creates that account as a viewer on start. The sign in page then offers Enter the demo, and the account can open every screen but cannot change anything, not even its own password. deploy/demo has a config and a systemd timer that puts a saved database back every hour:
sudo heron backup -o /var/lib/heron/seed.db
sudo cp deploy/demo/heron-demo-reset.* /etc/systemd/system/
sudo systemctl enable --now heron-demo-reset.timer
Alert rules
Three settings under More settings on every monitor keep the noise down.
Depends on. Point a monitor at the one it needs, like a site at its server or a game server at its node. While the parent is down, the monitors that depend on it stay quiet and the parent's alert says how many there are. If one of them goes down first, heron waits for the parent's next checks before it decides who to blame. When the parent comes back and a dependent is still down two minutes later, that dependent gets an alert of its own.
Alert after and Back up after. How many failed checks in a row make a monitor down, and how many good ones in a row bring it back.
Flapping. When a monitor changes between up and down six times within an hour, heron sends one alert saying so and holds the rest. Once it has stayed in one state for half an hour, a last message says it is stable again.
The black box
When a monitor goes down and opens an incident, heron looks at the target once more and keeps what it finds on the incident page under What heron saw:
- the status, headers and the first 4 KB of the body, with cookies and authorization headers hidden
- how long DNS, connecting, TLS, waiting and downloading took
- what the name resolved to and the certificate chain the server sent
- the route to the server, if
mtr,tracerouteortracepathis installed - a screenshot of the page, if Chromium or Chrome is installed
Up to three reports are kept per incident and they go away with it.
Early warnings
Every 15 minutes heron looks for trouble that has not turned into an outage yet. A Heads up box on the monitor list and on the monitor page shows what it found, and the monitor's alert channels hear about each warning once a day while it lasts:
- Slower than usual. The average answer over the last 6 hours is at least twice the usual one from the week before, and at least 150 ms slower.
- Failing quietly. In the last day at least 5 checks, and at least 2% of them, failed and then passed on the retry.
- Near its memory limit. A game server from Pelican uses 90% or more of its memory.
- Disk filling up. heron samples the disk of every Pelican node once an hour and fits a line through the last week. If the disk will be full within two weeks at that pace, or is already 90% full, you hear about it.
A warning disappears by itself once the reason is gone.
Domain and certificate expiry
Expiry in the sidebar lists every domain and HTTPS certificate that your website and DNS monitors use. heron checks them twice a day: certificates by connecting to the site, domains through the registry's RDAP service, or WHOIS for zones without one. Alerts go to the channels of the monitors that use the domain, 30, 7 and 1 day before the date and once more if it passes.
Pelican and Pterodactyl
In the panel create an application API key with read access to nodes and servers (Admin, API Keys). Then open Settings, Pelican in heron, paste the panel address and the key and press Save and sync.
heron adds a monitor for every node and every game server and syncs every five minutes. Nodes are checked through their Wings daemon with the node token, which the panel hands over through the same key. Game servers are checked through Wings as well: running is up, starting or stopping is degraded, offline is down, and the check result shows memory and CPU. Each server depends on its node, so a dead node is one alert. Suspended servers are added paused, and servers you delete in the panel disappear from heron. Names, groups and alert channels can be changed in heron like any other monitor.
Moving from Uptime Kuma
Open Settings, Move from Uptime Kuma and drop either the JSON from Kuma's Settings, Backup, Export (Kuma 1.x) or its kuma.db file. heron shows what it will create and what it has to skip before anything is saved. The same works from a shell:
heron import kuma -dry-run kuma.db
heron import kuma kuma.db
HTTP, keyword, TCP, ping, DNS, push, Postgres, Redis, Docker, gRPC, SMTP, Steam and Minecraft monitors come over with their groups, intervals and retries. Monitors that sat on a Kuma status page stay public, the rest are private. Telegram, Discord and webhook notifications become channels and stay attached to the same monitors. Push monitors keep their tokens, and heron answers on the same /api/push/<token> path, so once your domain points at heron the cron jobs keep working. Anything heron cannot check, like MQTT or Kafka, is listed as skipped.
Webhooks
Webhook channels receive a JSON POST every time a monitor goes down or comes back:
{
  "event": "monitor.down",
  "at": "2026-11-02T03:14:00Z",
  "status": "down",
  "reason": "unexpected status 502 Bad Gateway",
  "link": "https://status.example.com/monitor/api",
  "monitor": { "id": 3, "slug": "api", "name": "API", "kind": "http", "target": "https://api.example.com/health" }
}
If you set a secret, each request also carries X-Heron-Timestamp and X-Heron-Signature: sha256=<hex>, an HMAC of timestamp + "." + body.
Docker monitors
These talk to the Docker API, by default through /var/run/docker.sock. Add the heron user to the docker group, or put a read-only socket proxy in front and set the monitor's Docker host to tcp://proxy:2375.
Command line
heron serve                    start the server
heron user create -u name      create an account without the installer
heron user passwd -u name      reset a password and sign out every session
heron user reset-2fa -u name   turn off two-factor sign in for someone
heron backup [-o file]         save the database to a file
heron restore [-force] file    replace the database with a backup
heron import kuma [-dry-run] f bring monitors over from Uptime Kuma
heron update [-check]          download the latest release over the binary
heron version                  print the version
Working on heron
task dev     # backend on :8080 and the Vite dev server on :5173
task test    # go test -race ./...
task lint    # golangci-lint, svelte-check and biome
The Go code lives in internal/. monitor has the checks, scheduler runs one goroutine per monitor, engine turns results into incidents, alerts and live events, site handles domains and certificates, and store wraps SQLite. The interface is a SvelteKit app in web/ that gets built to static files and embedded into the binary.
License
Explore related projects
awesome-selfhosted/awesome-selfhosted
A list of Free Software network services and web applications which can be hosted on your own servers
335,420 starsimmich-app/immich
High performance self-hosted photo and video management solution.
118,568 starsStirling-Tools/Stirling-PDF
#1 PDF Application on GitHub that lets you edit PDFs on any device anywhere
96,048 starslouislam/uptime-kuma
A fancy self-hosted monitoring tool
93,389 stars