
matthart1983/syswatch
matthart1983/syswatch has 923 GitHub stars and 43 forks. GitHot measured +1 stars in 24 hours. Last checked 2026-11-10 04:44 UTC. Last push 2026-11-03.
Single-host system diagnostics TUI.
Measured star growth
- in 24h
- +1
- in 7 days
- Update delayed
- in 15 days
- Update delayed
- in 1 month
- Update delayed
Net star changes over overlapping periods, not daily totals. Missing measurements are left blank. Stars measure attention, not software quality.
README.md
Original
SysWatch
System diagnostics in your terminal.





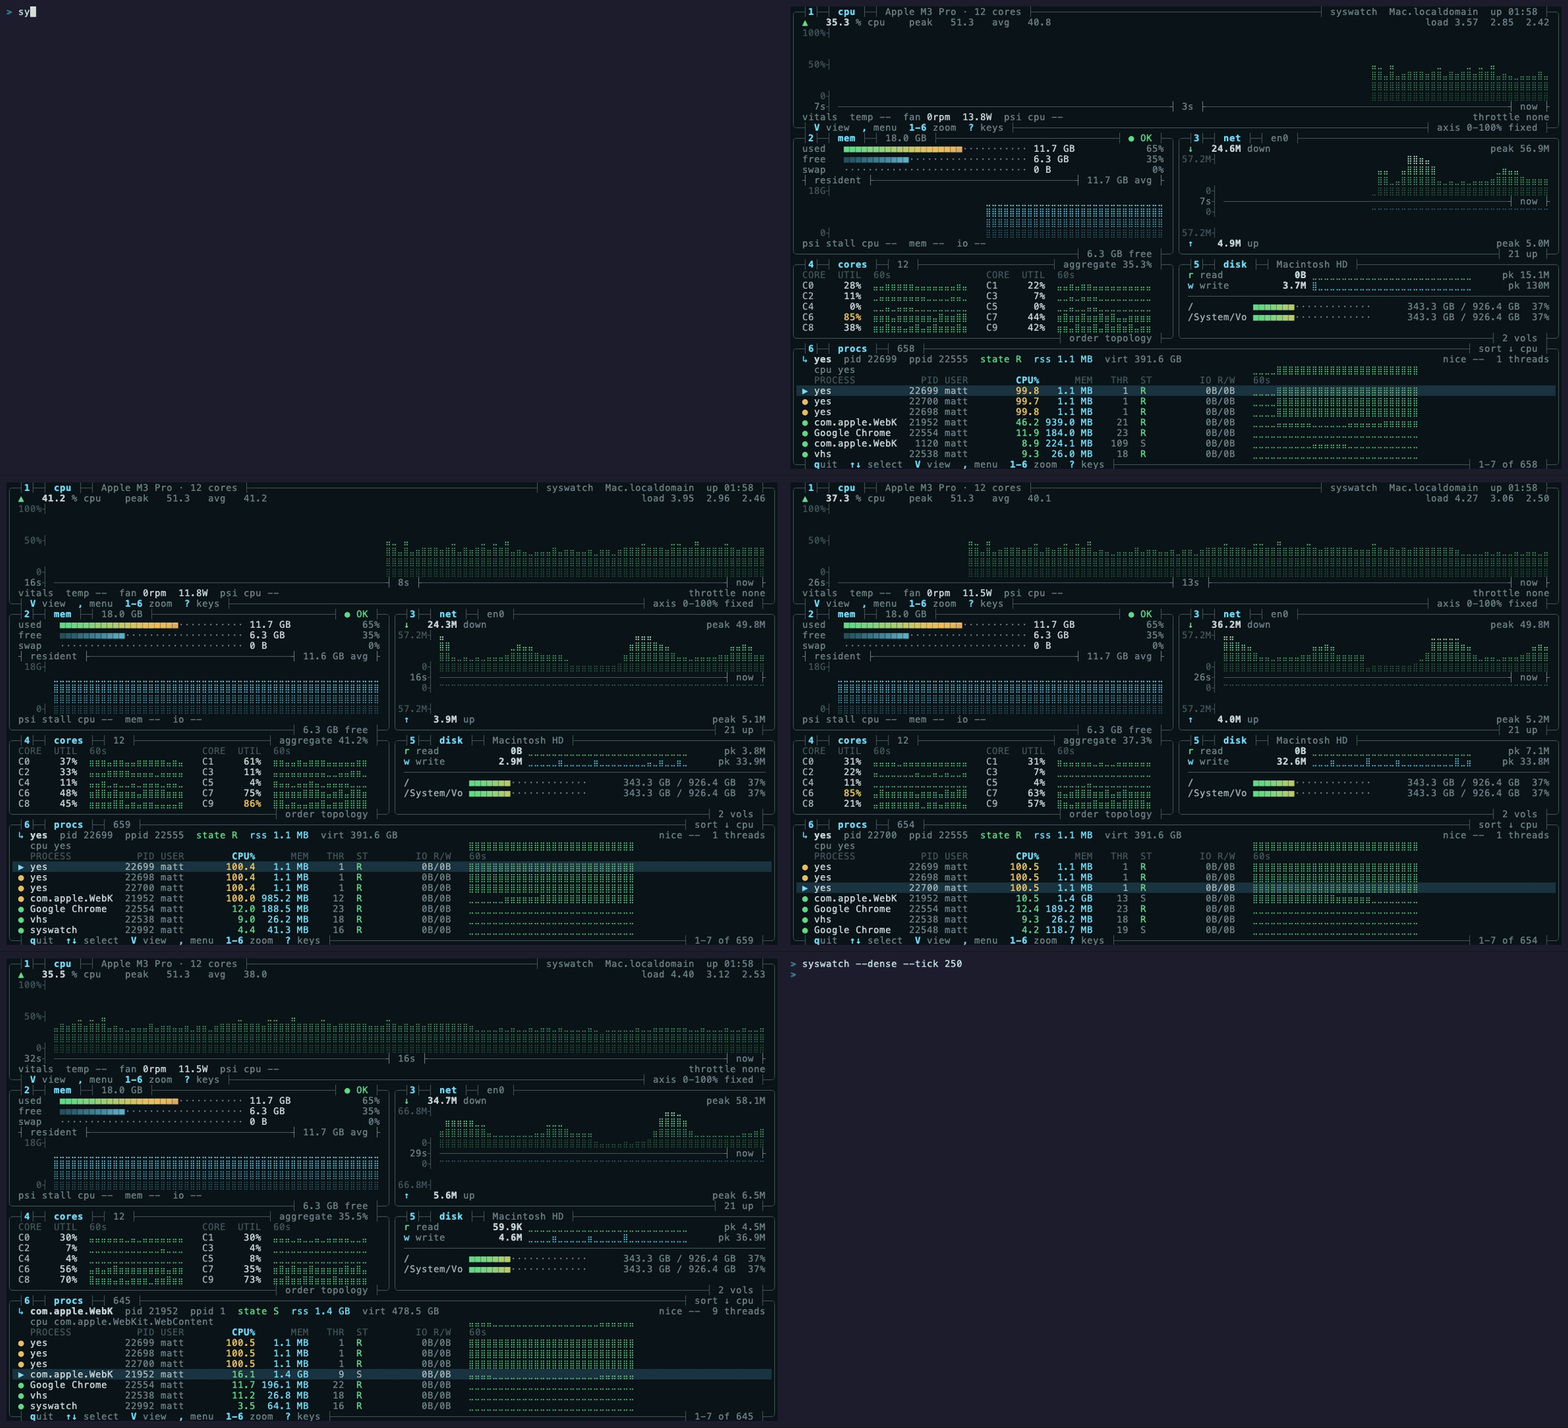
Live system activity in syswatch --dense.
Monitor CPU, memory, disks, processes, GPU, power and network activity on macOS and Linux. Scrub recent history, record sessions, and investigate spikes with heuristic anomaly cards. SysWatch is read-only and runs without sudo; available measurements depend on your platform and permissions.
Install
brew install syswatch                 # macOS / Linux
nix-shell -p syswatch                 # NixOS / Nix
paru -S syswatch                      # Arch (AUR)
cargo install syswatch                # build from source with Rust
Prebuilt binaries are available for macOS and Linux (x86_64 and aarch64), with static Linux builds and an armv5te build for older NAS hardware. Build from source.
Run
syswatch                       # twelve tabs, default 1 Hz refresh
syswatch --lite                # one 80×24 screen
syswatch --dense               # all main subsystems, designed for 130×44
syswatch --tab procs           # start on Processes
1–9, 0, - and + switch tabs. V cycles views, ? shows help, q quits.
Use ← / → to scrub recent history and End to return live.
Every keybinding · Full-view demo
The tabs
| Key | Tab | Shows |
|---|---|---|
| 1 | Overview | Activity across subsystems |
| 2 | CPU | CPU usage, load and per-core activity |
| 3 | Memory | Memory use, swap and pressure |
| 4 | Disks | Disk read/write activity |
| 5 | Filesystems | Capacity, inode use and mounts |
| 6 | Procs | Processes, resource use, sorting and filtering |
| 7 | GPU | Utilisation and memory, where available |
| 8 | Power | Battery and available power measurements |
| 9 | Services | systemd or launchd services |
| 0 | Net | Network traffic |
| - | Timeline | Session events and history scrubbing |
| + | Insights | Anomalies and suggested tabs to investigate |
Views
| View | Size | For |
|---|---|---|
| Full | Tabbed | Exploring individual subsystems |
Lite (--lite) |
80×24 | SSH sessions and small terminals |
Dense (--dense) |
Designed for 130×44 | CPU, memory, network, cores, disk and processes together |
In Dense, 1–6 zoom a panel and Esc restores the grid.
View details · Lite demo
Record and report
Press R to record an interactive session or S to save a snapshot.
syswatch --record --keep 24h          # foreground recording without a TUI
syswatch --replay session.swr         # replay a recording
syswatch snapshot --json             # one live sample
syswatch why                         # sample for 30s, explain detected anomalies
syswatch diff before.swr after.swr   # compare recordings
Live scrubbing holds 120 samples (two minutes at the default refresh rate).
Record longer sessions to disk. Headless recording rotates files and prunes old
chunks according to --keep; it runs until stopped.
Recording and report details.
Docs
| Reference | Controls, views, recording and reports |
| Platform support | Sensors, permissions, NVIDIA support and ZFS |
| Architecture | Collectors, history, rendering and refresh model |
| Security | Security policy |
Related
NetWatch covers network diagnostics; DiskWatch covers disk activity. They share the terminal layout and palette.
Thanks
Community packagers maintain the Nix and Arch packages. Repology tracks package versions. File packaging issues with the packagers and SysWatch bugs here.
License
MIT
Explore related projects
codecrafters-io/build-your-own-x
Master programming by recreating your favorite technologies from scratch.
561,634 starspublic-apis/public-apis
A collective list of free APIs
497,998 starsmorluto/rea
Reverse engineer anything with agents, from app behavior down to native binaries.
450,355 starsopenclaw/openclaw
The AI that really does things. Any OS. Any Platform. The lobster way. 🦞
394,308 stars