
matthart1983/netscan
matthart1983/netscan has 67 GitHub stars and 3 forks. GitHot measured 0 stars in 24 hours and 0 in 7 days. Last checked 2026-11-15 21:09 UTC. Last push 2026-11-07.
Measured star growth
- in 24h
- 0
- in 7 days
- 0
- in 15 days
- Update delayed
- in 1 month
- Update delayed
Net star changes over overlapping periods, not daily totals. Missing measurements are left blank. Stars measure attention, not software quality.
About
Network scanning in your terminal, built on nmap. Saved targets and profiles, scan history, differential scans and opt-in AI triage.
Developer ToolsREADME.md
Originalnetscan
The continuous attack surface monitor — a TUI workflow for nmap.



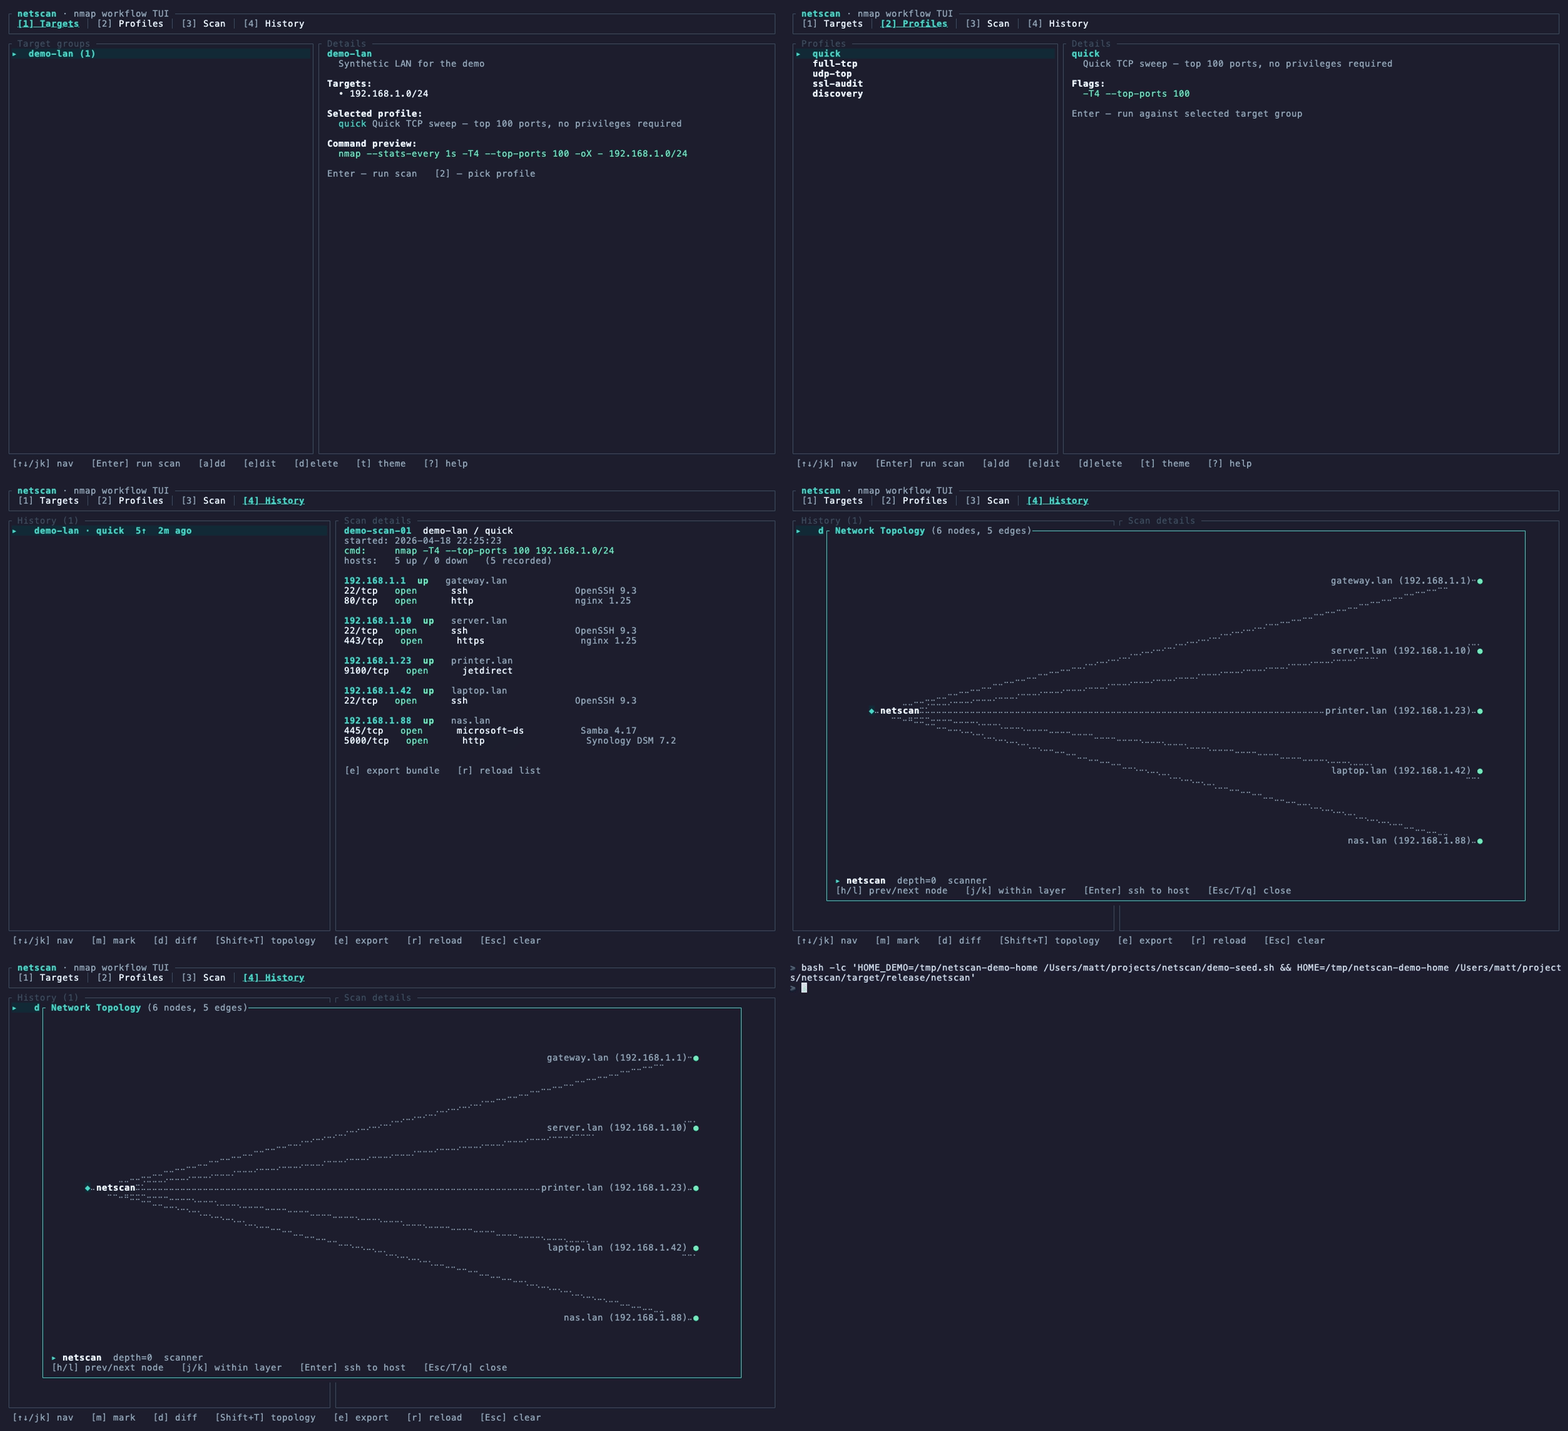
Live scan streaming with progress bar + ETA · auto-diff on re-run · scan history · 5 themes.
netscan wraps the nmap engine with a real workflow: target inventory, saved scan profiles,
live streaming results as each host comes in, and scan history with differential scanning.
One binary. No config required on first run.
Status: v0.8.1 (April 2026). Target and profile CRUD via TUI forms, live
streaming scan view with real-time progress bar + ETA and pause/resume,
SQLite-backed scan history, automatic differential scanning, scheduled scans
with a headless --daemon mode, a topology view with ssh drill-down, incident
bundle export, manual diff between any two historical scans, opt-in AI triage
via local or remote Ollama, and 5 built-in themes are all working. Not yet
built: an NSE script picker and webhook alerts on change.
Why
nmap is the canonical network scanner, and its UX has been frozen since 1998. Zenmap is
decaying. Nobody loves typing nmap -T4 -p- -sV -sC 192.168.1.0/24 from memory every
time they want to check their LAN. netscan keeps nmap as the engine and puts a modern TUI
in front of it.
The design principle: the value is in the workflow, not the engine. nmap has 25+ years of NSE scripts, OS fingerprinting, and protocol probes you can't match. netscan doesn't try. It gives you:
- Named target groups you edit once
- Saved scan profiles so you never look up flags
- Live streaming results as nmap reports each host
- (Soon) scan history and differential scanning — the real killer feature
Requirements
nmapinstalled and onPATH— hard dependency. Install withbrew install nmaporapt install nmap.- Rust 1.70+ if you're building from source.
Build & run
cd netscan
cargo run --release
Or build once and run the binary directly:
cargo build --release
./target/release/netscan
First run creates ~/.config/netscan/targets.toml and ~/.config/netscan/profiles.toml
(or the platform equivalent) with sensible defaults. Edit them to add your own groups.
netscan --config-paths # show where config and data live
Keyboard reference
| Key | Action |
|---|---|
1 / 2 / 3 / 4 |
Switch tabs (Targets / Profiles / Scan / History) |
Tab |
Next tab |
↑↓ / j k |
Navigate lists |
Enter |
Run scan with selected target group + profile |
p |
Pause / resume a running scan (SIGSTOP / SIGCONT) |
x |
Stop a running scan |
Shift+E |
Export incident bundle (Scan tab) |
m |
Mark a scan for diff (History tab) |
d |
Diff marked ↔ current (History tab) |
e |
Export selected history entry |
r |
Reload history list |
Esc |
Close diff view / clear mark / cancel form |
a / e / d |
Add / edit / delete (Targets & Profiles tabs) |
Ctrl+S |
Save form |
t |
Cycle theme (dark → solarized → dracula → nord → gruvbox) |
? |
Help overlay |
q |
Quit (or stop a running scan) |
Themes
Five built-in themes, cycle with t:
- dark — the default; netwatch-family teal on deep navy
- solarized — Ethan Schoonover's solarized dark palette
- dracula — the classic Dracula palette
- nord — the Nord palette (arctic / frost)
- gruvbox — Gruvbox dark (retro groove)
Your choice persists in ~/.config/netscan/config.toml under [ui] theme = "…".
Scan history & differential scanning
Every completed scan is persisted to a local SQLite database at
~/.local/share/netscan/history.db (or the platform equivalent). When you finish a
scan, netscan automatically looks up the most recent prior scan with the same
target group + profile combination and renders a diff pane at the bottom of the
Scan tab showing:
- New hosts that came online
- Removed hosts that went dark
- Newly open ports (potential attack surface growth)
- Newly closed ports
- Service changes (e.g.
nginx→apache) - Version changes (e.g.
OpenSSH 9.2→OpenSSH 9.3)
This is the core value loop: run the same scan on a schedule, see only what
changed. Press 4 to browse the full scan history.
Incident bundle export
Press Shift+E on the Scan tab (or e in History) to export a self-contained
bundle into ~/.local/share/netscan/exports/:
netscan_YYYY-MM-DD-HH-MM-SS_<group>_<scan-id>/
  manifest.json    scan metadata
  hosts.json       normalized host + port data
  summary.md       human-readable write-up
  diff.md          diff against previous scan (if present)
Hand this directory to a teammate, a client, or your future self.
AI triage (opt-in)
netscan can send a structured summary of every completed scan (plus its diff against the previous scan) to an Ollama endpoint and render the model's analysis live in the Scan tab. Nothing happens unless you turn it on.
Enable it by editing ~/.config/netscan/config.toml:
[ai]
enabled = true
endpoint = "local"      # or "http://host:11434" or "https://ollama.com"
model = "llama3.2"
timeout_secs = 60
Endpoint options:
"local"— useshttp://localhost:11434(the default Ollama daemon). Zero-setup if you already run Ollama."http://host:11434"— a remote Ollama on another machine on your network."https://ollama.com"— Ollama Cloud models (you must be logged in via the local daemon first; netscan itself never handles API keys).
When enabled, the AI triage pane appears at the bottom of the Scan tab after each scan with a bullet-point analysis covering: the most important finding, security concerns, suspicious changes since the last scan, and what to investigate first.
Requests run on a background thread — the TUI stays responsive while the model is working, and errors are surfaced non-destructively (bad endpoint, Ollama daemon down, timeout, etc.).
Manual diff between any two scans
In the History tab:
- Navigate to the first scan you want to compare and press
mto mark it (★ appears next to it in the list and the title bar shows the mark). - Navigate to any other scan and press
d. - The detail pane switches to a full-fidelity diff view showing every host
and port change between the two scans. Older scan is treated as
prevregardless of which one you marked first. - Press
Escto close the diff and return to the scan detail view.Escagain clears the mark.
Config format
# ~/.config/netscan/targets.toml

[[groups]]
name = "home-lan"
description = "Home LAN sweep"
targets = ["192.168.1.0/24"]

[[groups]]
name = "prod-edge"
description = "Production edge hosts"
targets = [
  "api.example.com",
  "cdn.example.com",
]
# ~/.config/netscan/profiles.toml

[[profiles]]
name = "quick"
description = "Quick TCP sweep — top 100 ports"
flags = "-T4 --top-ports 100"

[[profiles]]
name = "full-tcp"
description = "Full TCP, service detection, default NSE"
flags = "-T4 -p- -sV -sC"
netscan always appends -oX - and the target list to whatever flags you specify, so you
never need to include those yourself.
Roadmap
- TUI shell with target/profile inventory
- Live scan view with streaming XML parse
- Default profiles (
quick,full-tcp,udp-top,ssl-audit,discovery) - SQLite-backed scan history
- Automatic diff on scan completion
- History browser with detail view
- Incident bundle export (
Shift+E) - Manual diff between any two historical scans
- Opt-in AI triage via local or remote Ollama
- Target group CRUD via TUI form
- Scan profile CRUD via TUI form
- Theme system (5 built-in themes, persisted)
- Live progress bar + ETA from nmap's
--stats-everyon stderr - Pause / resume running scans via SIGSTOP / SIGCONT
- Scheduled scans and headless
--daemonmode - Topology view with ssh drill-down (
Shift+T) - NSE script picker
- Webhook alerts on change
License
MIT.
Part of NetWatch Labs — the security-minded sysadmin's toolkit.