
lorenzo9uerra/GraphIDS
lorenzo9uerra/GraphIDS has 64 GitHub stars and 14 forks. GitHot measured 0 stars in 24 hours. Last checked 2026-11-16 03:19 UTC. Last push 2026-10-21.
Measured star growth
- in 24h
- 0
- in 7 days
- Collecting history
- in 15 days
- Collecting history
- in 1 month
- Collecting history
Net star changes over overlapping periods, not daily totals. Missing measurements are left blank. Stars measure attention, not software quality.
About
GraphIDS: Self-supervised GNN for Network Intrusion Detection (NeurIPS 2025)
SecurityREADME.md
Original

Self-Supervised Learning of Graph Representations for Network Intrusion Detection
This repository provides the official code for our paper, accepted at NeurIPS 2025.
Overview
GraphIDS is a self-supervised intrusion detection system that learns graph representations of normal network traffic patterns. The model combines:
- E-GraphSAGE: An inductive GNN that embeds each flow with its local topological context
- Transformer Autoencoder with Attention Masking: Reconstructs flow embeddings while learning global co-occurrence patterns
Flows with high reconstruction errors are flagged as potential intrusions. By jointly training both components end-to-end, the model achieves strong performance on NetFlow benchmarks (up to 99.98% PR-AUC and 99.61% macro F1-score).
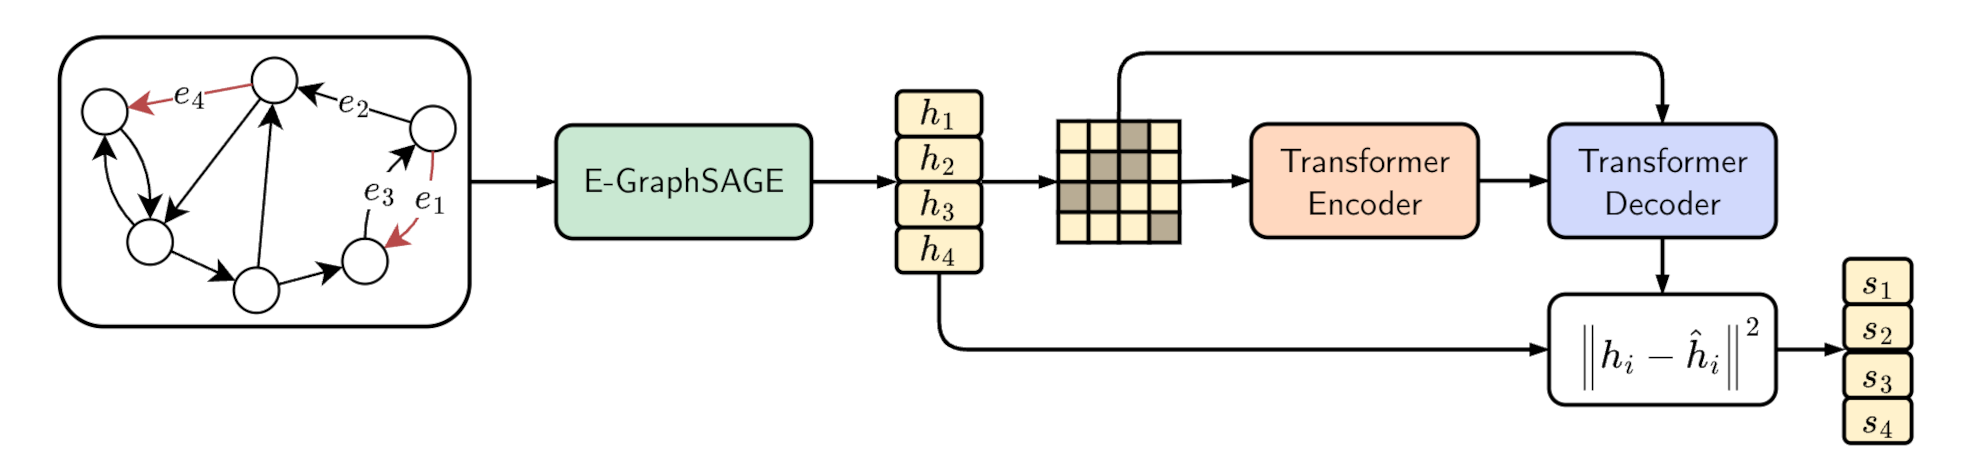
Note: This implementation uses PyTorch Geometric (PyG) for improved maintainability and broader compatibility. For exact reproduction of the paper results and pretrained models, see the DGL branch.
Requirements
Installation
This project uses uv for project management.
Sync the project dependencies:
uv sync
This will create a virtual environment and install all dependencies specified in pyproject.toml.
Note: The project is configured for CUDA 12.8. If you need a different CUDA version, modify the [tool.uv.index] URL in pyproject.toml.
Datasets
The datasets can be downloaded from this website: https://staff.itee.uq.edu.au/marius/NIDS_datasets/
After downloading each dataset zip file, unzip it with the following command:
unzip -d <dataset_name> -j <filename>.zip
For example, for the NF-UNSW-NB15-v3 dataset:
unzip -d NF-UNSW-NB15-v3 -j f7546561558c07c5_NFV3DATA-A11964_A11964.zip
NOTE: The authors recently renamed the file for the NF-CSE-CIC-IDS2018-v2 and NF-CSE-CIC-IDS2018-v3 datasets as NF-CICIDS2018-v2 and NF-CICIDS2018-v3.
To keep a consistent naming convention with the literature, the code expects the dataset directory and the dataset CSV file to be named as one of the 4 considered datasets: NF-UNSW-NB15-v2, NF-UNSW-NB15-v3, NF-CSE-CIC-IDS2018-v2, NF-CSE-CIC-IDS2018-v3.
Quick Start
Once you have installed the dependencies and downloaded a dataset, you can train GraphIDS with:
uv run main.py --data_dir data/ --config configs/NF-UNSW-NB15-v3.yaml
This will train the model on the NF-UNSW-NB15-v3 dataset and automatically evaluate it after training.
Training
Experiment Tracking
We use Weights & Biases for experiment tracking. W&B is set to offline mode by default—no login is required, and all logs are stored locally. To enable online mode, pass the --wandb flag.
Running Training
To train GraphIDS, run this command:
uv run main.py --data_dir <data_dir> --config configs/<dataset_name>.yaml
<data_dir> should point to the directory containing all the datasets. The code expects the directory structure found in the zip files (i.e., each CSV file should be located at <data_dir>/<dataset_name>/<dataset_name>.csv). For example, for the following directory structure:
data/
└── NF-UNSW-NB15-v3
    ├── FurtherInformation.txt
    ├── NF-UNSW-NB15-v3.csv
    ├── NetFlow_v3_Features.csv
    ├── bag-info.txt
    ├── bagit.txt
    ├── manifest-sha1.txt
    └── tagmanifest-sha1.txt
configs/
└── NF-UNSW-NB15-v3.yaml
You should run:
uv run main.py --data_dir data/ --config configs/NF-UNSW-NB15-v3.yaml
During preprocessing, GraphIDS caches the processed PyG graphs, fitted scaler,
and seed metadata under <data_dir>/pyg_graph_data/<dataset_name>/. When using
--fraction, the cache directory becomes
<data_dir>/pyg_graph_data/<dataset_name>_<fraction>/.
To specify different training parameters, you can either modify the configuration file in the configs/ directory, or provide all parameters using command-line arguments. The full list of possible arguments can be accessed by running the command:
uv run main.py --help
Split protocols
By default, GraphIDS uses the stratified split protocol from the NeurIPS 2025 experiments, following Anomal-E for direct benchmark comparability. The results reported below use this published protocol.
For timestamped v3 datasets, GraphIDS also supports out-of-time evaluation. The temporal protocol sorts flows by timestamp before partitioning them.
For NF-CSE-CIC-IDS2018-v3, exploratory analysis of benign traffic indicates a sustained change in NetFlow feature distributions from 2018-02-28 onward. This coincides with a documented change in attack scenarios and victim hosts, suggesting that the observed shift is related to how the benchmark was collected. The temporal_shift_aware protocol defines pre_shift as flows before 2018-02-27, excludes the partial day on 2018-02-27, and starts post_shift on 2018-02-28. Performance across these periods may reflect temporal separation together with changes in both benign traffic and attack composition.
Evaluation
By running the command above, the model would also be evaluated after training. However, to only evaluate the model from a saved checkpoint, run the following command:
uv run main.py --data_dir <data_dir> --config configs/<dataset_name>.yaml --checkpoint checkpoints/GraphIDS_<dataset_name>_<seed>.ckpt --test
Development
If you plan to modify the code, we recommend installing the development dependencies:
uv sync --extra dev
This installs ruff for linting and formatting, ty for type checking, and
pre-commit hooks.
To set up the git hooks:
uv run pre-commit install
To run the linter and formatter manually:
uv run ruff check .
uv run ruff format .
uv run ty check .
Testing
Run the suite with:
uv run pytest
Pytest is configured in pyproject.toml. The suite uses synthetic data and is
intended to validate the preprocessing, training, and evaluation pipeline
without requiring the full datasets.
Results
Our model achieves the following performance on the following datasets:
NF-UNSW-NB15-v3
| Model name | Macro F1-score | Macro PR-AUC |
|---|---|---|
| GraphIDS | 99.61% | 99.98% |
NF-CSE-CIC-IDS2018-v3
| Model name | Macro F1-score | Macro PR-AUC |
|---|---|---|
| GraphIDS | 94.47% | 88.19% |
NF-UNSW-NB15-v2
| Model name | Macro F1-score | Macro PR-AUC |
|---|---|---|
| GraphIDS | 92.64% | 81.16% |
NF-CSE-CIC-IDS2018-v2
| Model name | Macro F1-score | Macro PR-AUC |
|---|---|---|
| GraphIDS | 94.31% | 92.01% |
The results are averaged over multiple seeds; PR-AUC values are computed with scikit-learn's average_precision_score.
Citation
If you find this work useful in your research, please consider citing our paper:
@inproceedings{guerra2025selfsupervised,
  author = {Guerra, Lorenzo and Chapuis, Thomas and Duc, Guillaume and Mozharovskyi, Pavlo and Nguyen, Van-Tam},
  booktitle = {Advances in Neural Information Processing Systems},
  pages = {109471--109501},
  publisher = {Curran Associates, Inc.},
  title = {Self-Supervised Learning of Graph Representations for Network Intrusion Detection},
  url = {https://proceedings.neurips.cc/paper_files/paper/2025/file/9ddb13ae9150f99298065d889f951014-Paper-Conference.pdf},
  volume = {38},
  year = {2025}
}
License
All original components of this repository are licensed under the Apache License 2.0. Third-party components are used in compliance with their respective licenses.