
kroitor/asciichart
kroitor/asciichart has 2,109 GitHub stars and 100 forks. GitHot measured 0 stars in 24 hours, 0 in 7 days, and 0 in 15 days. Last checked 2026-11-09 07:14 UTC. Last push 2026-10-30.
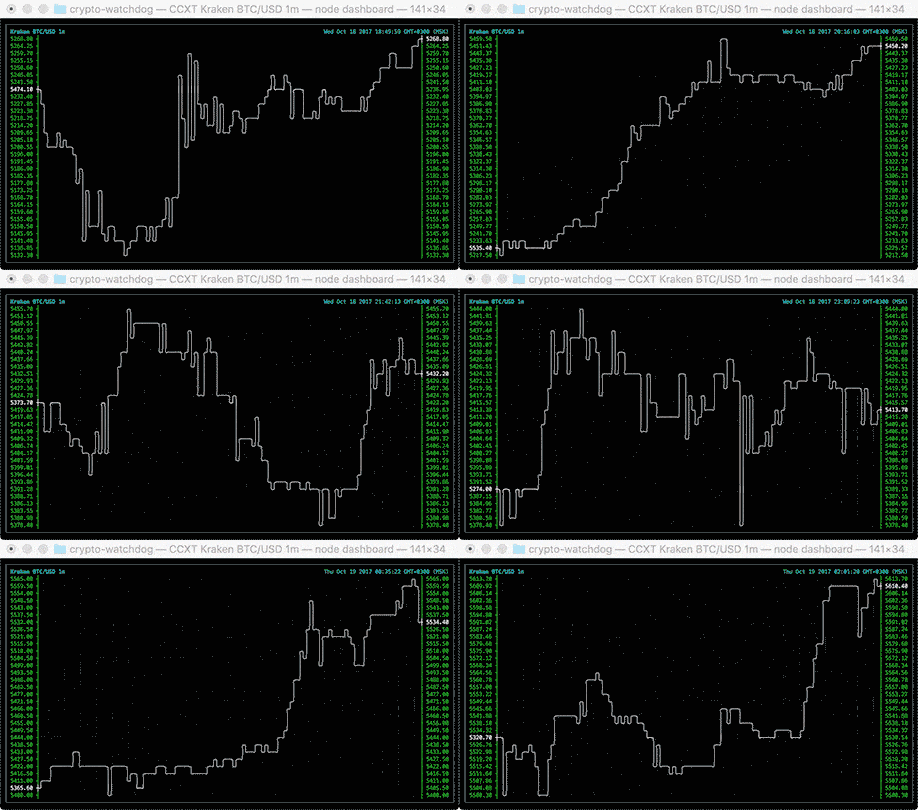
Nice-looking lightweight console ASCII line charts ╭┈╯ for NodeJS, browsers and terminal, no dependencies
Measured star growth
- in 24h
- 0
- in 7 days
- 0
- in 15 days
- 0
- in 1 month
- Collecting history
Net star changes over overlapping periods, not daily totals. Missing measurements are left blank. Stars measure attention, not software quality.
README.md
Originalasciichart


Console ASCII line charts in pure Javascript (for NodeJS and browsers) with no dependencies.

Usage
NodeJS
npm install asciichart
var asciichart = require ('asciichart')
var s0 = new Array (120)
for (var i = 0; i < s0.length; i++)
    s0[i] = 15 * Math.sin (i * ((Math.PI * 4) / s0.length))
console.log (asciichart.plot (s0))
Browsers
<!DOCTYPE html>
<html>
    <head>
        <meta http-equiv="Content-Type" content="text/html; charset=utf-8">
        <meta charset="UTF-8">
        <title>asciichart</title>
        <script src="asciichart.js"></script>
        <script type="text/javascript">
            var s0 = new Array (120)
            for (var i = 0; i < s0.length; i++)
                s0[i] = 15 * Math.sin (i * ((Math.PI * 4) / s0.length))
            console.log (asciichart.plot (s0))
        </script>
    </head>
    <body>
    </body>
</html>
Options
The width of the chart will always equal the length of data series. The height and range are determined automatically.
var s0 = new Array (120)
for (var i = 0; i < s0.length; i++)
    s0[i] = 15 * Math.sin (i * ((Math.PI * 4) / s0.length))
console.log (asciichart.plot (s0))

The output can be configured by passing a second parameter to the plot (series, config) function. The following options are supported:
var config = {

    offset:  3,          // axis offset from the left (min 2)
    padding: '       ',  // padding string for label formatting (can be overridden)
    height:  10,         // any height you want

    // the label format function applies default padding
    format:  function (x, i) { return (padding + x.toFixed (2)).slice (-padding.length) }
}
Scale To Desired Height

var s = []
for (var i = 0; i < 120; i++)
    s[i] = 15 * Math.cos (i * ((Math.PI * 8) / 120)) // values range from -15 to +15
console.log (asciichart.plot (s, { height: 6 }))     // this rescales the graph to ±3 lines

Auto-range
var s2 = new Array (120)
s2[0] = Math.round (Math.random () * 15)
for (i = 1; i < s2.length; i++)
    s2[i] = s2[i - 1] + Math.round (Math.random () * (Math.random () > 0.5 ? 2 : -2))
console.log (asciichart.plot (s2))

Multiple Series
var s2 = new Array (120)
s2[0] = Math.round (Math.random () * 15)
for (i = 1; i < s2.length; i++)
    s2[i] = s2[i - 1] + Math.round (Math.random () * (Math.random () > 0.5 ? 2 : -2))

var s3 = new Array (120)
s3[0] = Math.round (Math.random () * 15)
for (i = 1; i < s3.length; i++)
    s3[i] = s3[i - 1] + Math.round (Math.random () * (Math.random () > 0.5 ? 2 : -2))

console.log (asciichart.plot ([ s2, s3 ]))

Colors
var arr1 = new Array (120)
arr1[0] = Math.round (Math.random () * 15)
for (i = 1; i < arr1.length; i++)
    arr1[i] = arr1[i - 1] + Math.round (Math.random () * (Math.random () > 0.5 ? 2 : -2))

var arr2 = new Array (120)
arr2[0] = Math.round (Math.random () * 15)
for (i = 1; i < arr2.length; i++)
    arr2[i] = arr2[i - 1] + Math.round (Math.random () * (Math.random () > 0.5 ? 2 : -2))

var arr3 = new Array (120)
arr3[0] = Math.round (Math.random () * 15)
for (i = 1; i < arr3.length; i++)
    arr3[i] = arr3[i - 1] + Math.round (Math.random () * (Math.random () > 0.5 ? 2 : -2))

var arr4 = new Array (120)
arr4[0] = Math.round (Math.random () * 15)
for (i = 1; i < arr4.length; i++)
    arr4[i] = arr4[i - 1] + Math.round (Math.random () * (Math.random () > 0.5 ? 2 : -2))

var config = {
    colors: [
        asciichart.blue,
        asciichart.green,
        asciichart.default, // default color
        undefined, // equivalent to default
    ]
}

console.log (asciichart.plot([ arr1, arr2, arr3, arr4 ], config))

See Also
A util by madnight for drawing Bitcoin/Ether/altcoin charts in command-line console: bitcoin-chart-cli.

Ports
Special thx to all who helped port it to other languages, great stuff!
- Python port included!
- Java: ASCIIGraph, ported by MitchTalmadge. If you're a Java-person, check it out!
- Go: asciigraph, ported by guptarohit, Go people! )
- Haskell: asciichart, ported by madnight to Haskell world!
- Ruby: ascii_chart, ported by zhustec!
- Elixir: asciichart, ported by sndv!
- Perl: App::AsciiChart, ported by vti!
- C: plot, ported by annacrombie!
- C++: asciichart, ported by Civitasv!
- R: asciichartr, ported by blmayer!
- Rust: rasciigraph, ported by orhanbalci!
- PHP: PHP-colored-ascii-linechart, ported by noximo!
- C#: asciichart-sharp, ported by samcarton, maintained by NathanBaulch!
- Deno: chart, ported by maximousblk!
- Lua: lua-asciichart, ported by wuyudi!
- Dart: ascii_chart, ported by Rave98!
- Mojo: mojo-asciichart, ported by Mjboothaus!
Future work (coming soon, hopefully)
- levels and points on the graph!
- even better value formatting and auto-scaling!
Explore related projects
codecrafters-io/build-your-own-x
Master programming by recreating your favorite technologies from scratch.
561,227 starspublic-apis/public-apis
A collective list of free APIs
497,462 starsmorluto/rea
Reverse engineer anything with agents, from app behavior down to native binaries.
445,528 starsopenclaw/openclaw
The AI that really does things. Any OS. Any Platform. The lobster way. 🦞
394,228 stars