
karem505/openclaw-agent-dashboard
karem505/openclaw-agent-dashboard has 47 GitHub stars and 8 forks. Star changes are not measured yet. Last checked 2026-11-09 16:58 UTC. Last push 2026-10-24.
OpenClaw agent dashboard: glassmorphic UI to manage AI agents — task kanban, document editor, API monitoring and real-time agent tracking (HTML, CSS, JavaScript)
Measured star growth
- in 24h
- Update delayed
- in 7 days
- Update delayed
- in 15 days
- Update delayed
- in 1 month
- Update delayed
Net star changes over overlapping periods, not daily totals. Missing measurements are left blank. Stars measure attention, not software quality.
README.md
OriginalOpenClaw Agent Dashboard

Glassmorphic agent management dashboard for OpenClaw


A full-featured, single-file agent management dashboard with task kanban boards, document editor, API monitoring, real-time agent tracking, and server metrics — all in a dark glassmorphic UI.
Demo
Screenshots
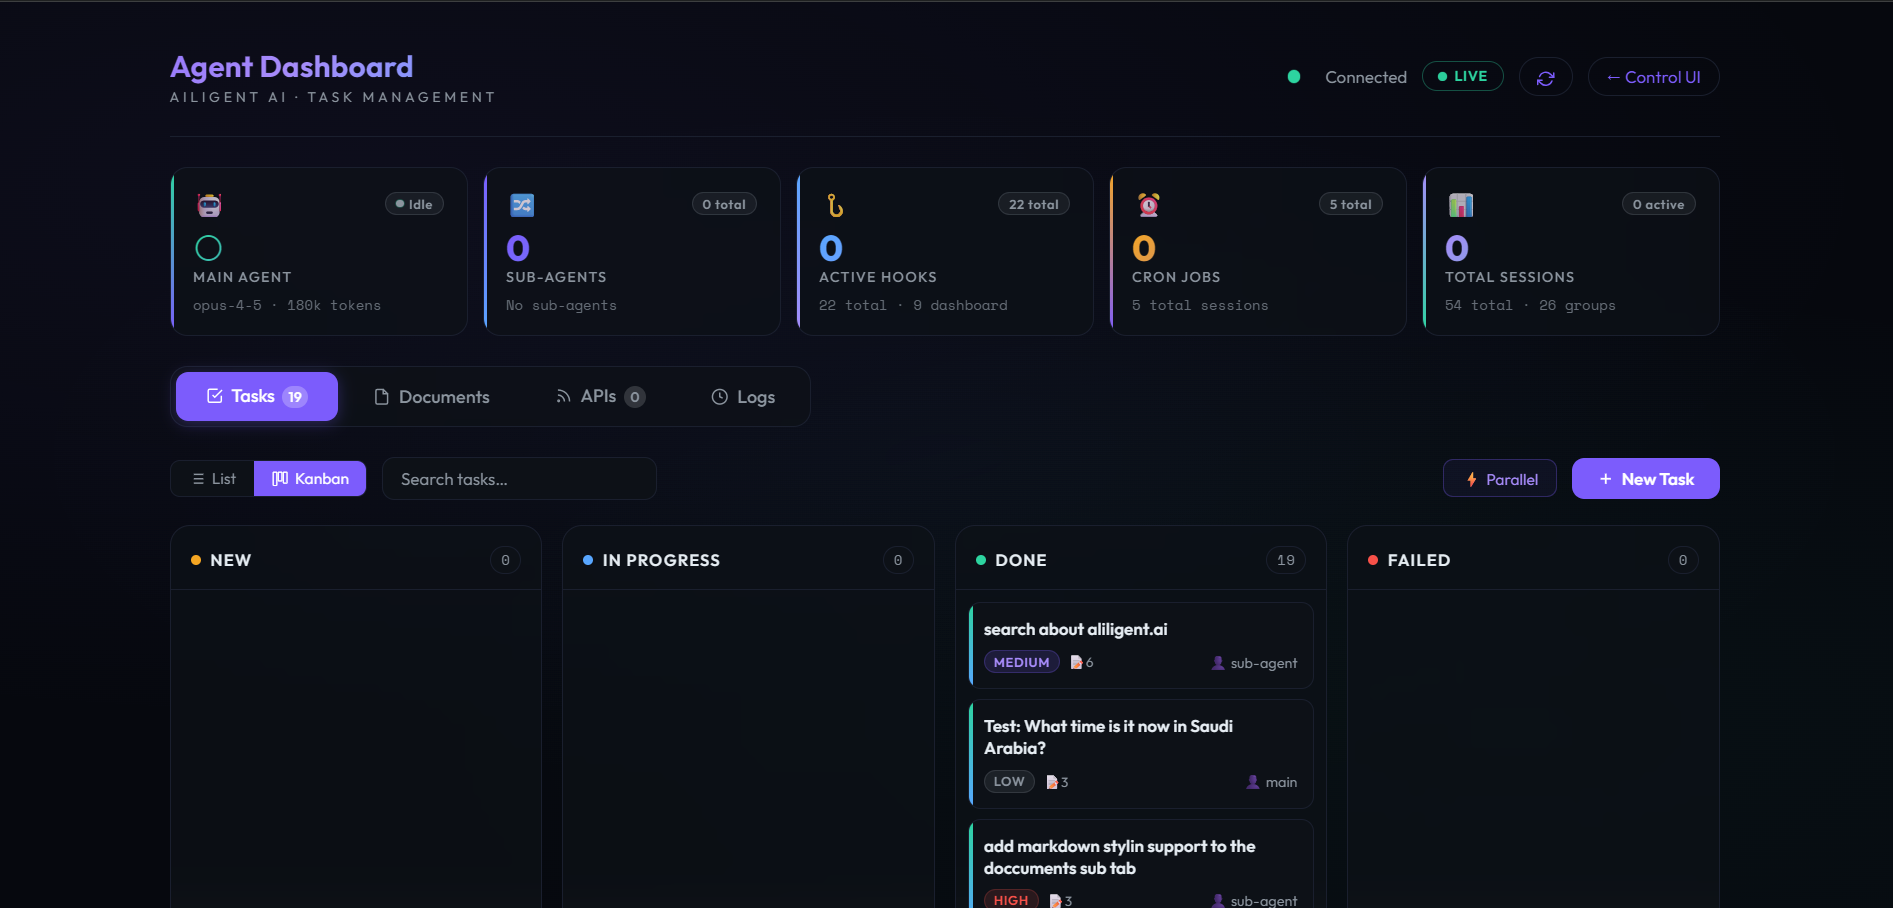 |
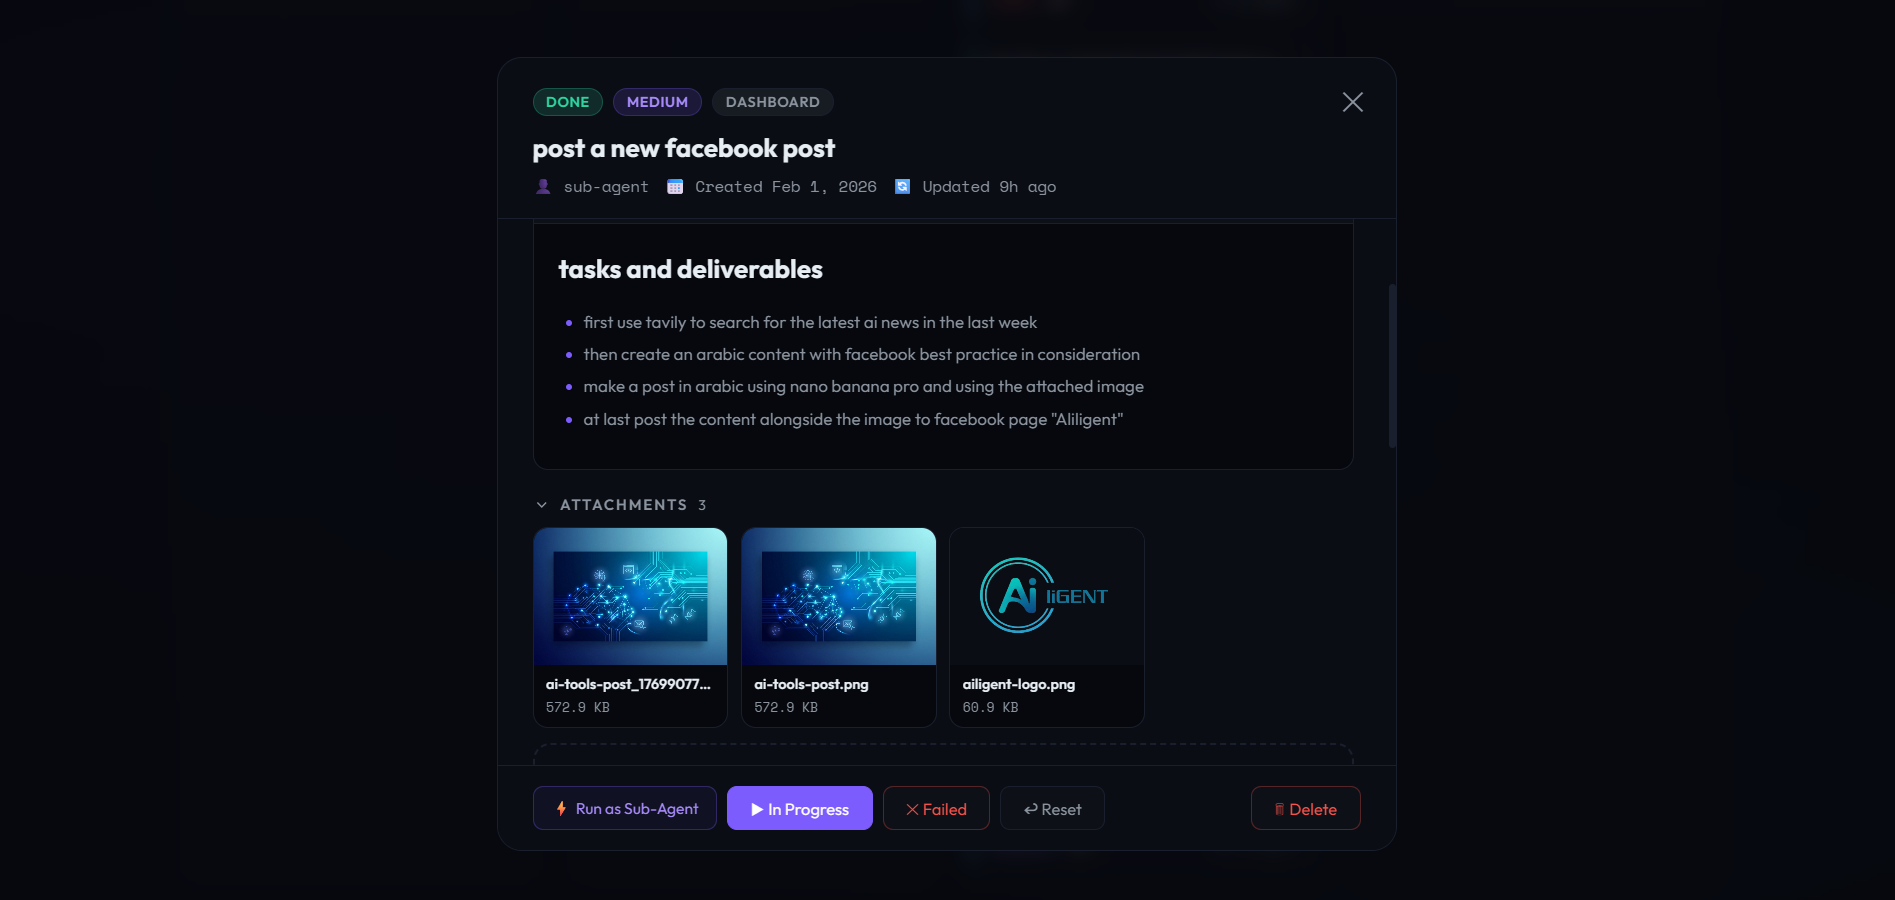 |
| Tasks — Kanban Board | Task Detail — Markdown & Attachments |
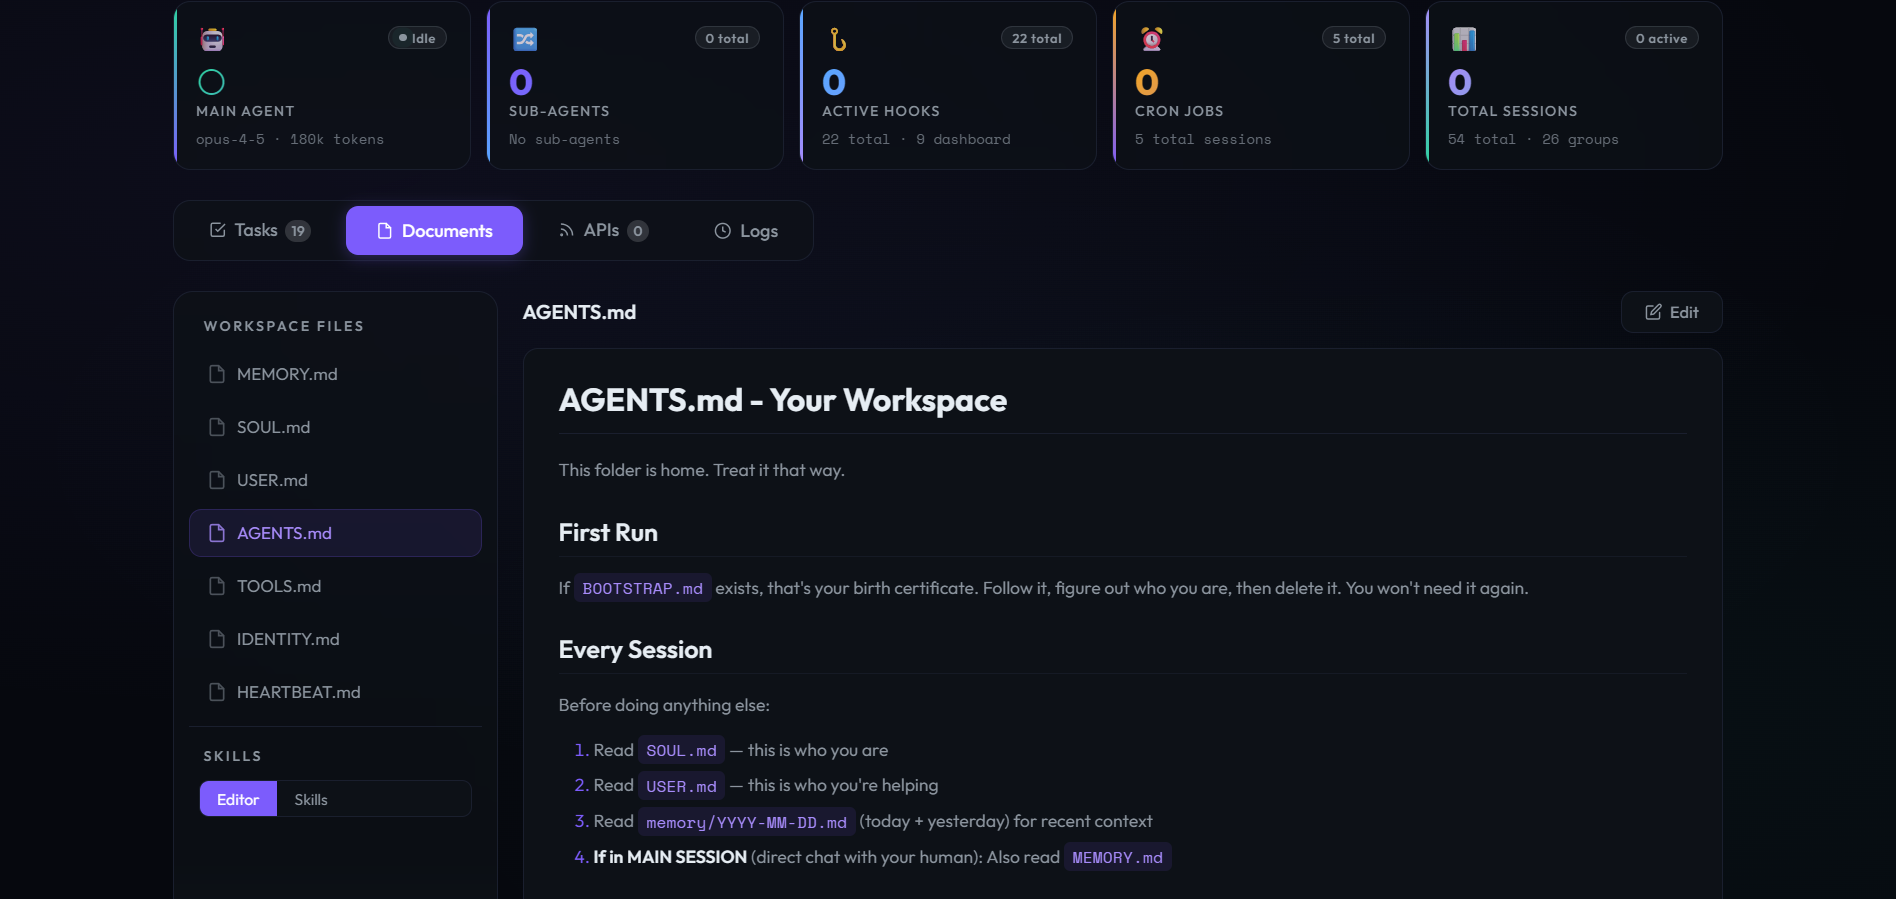 |
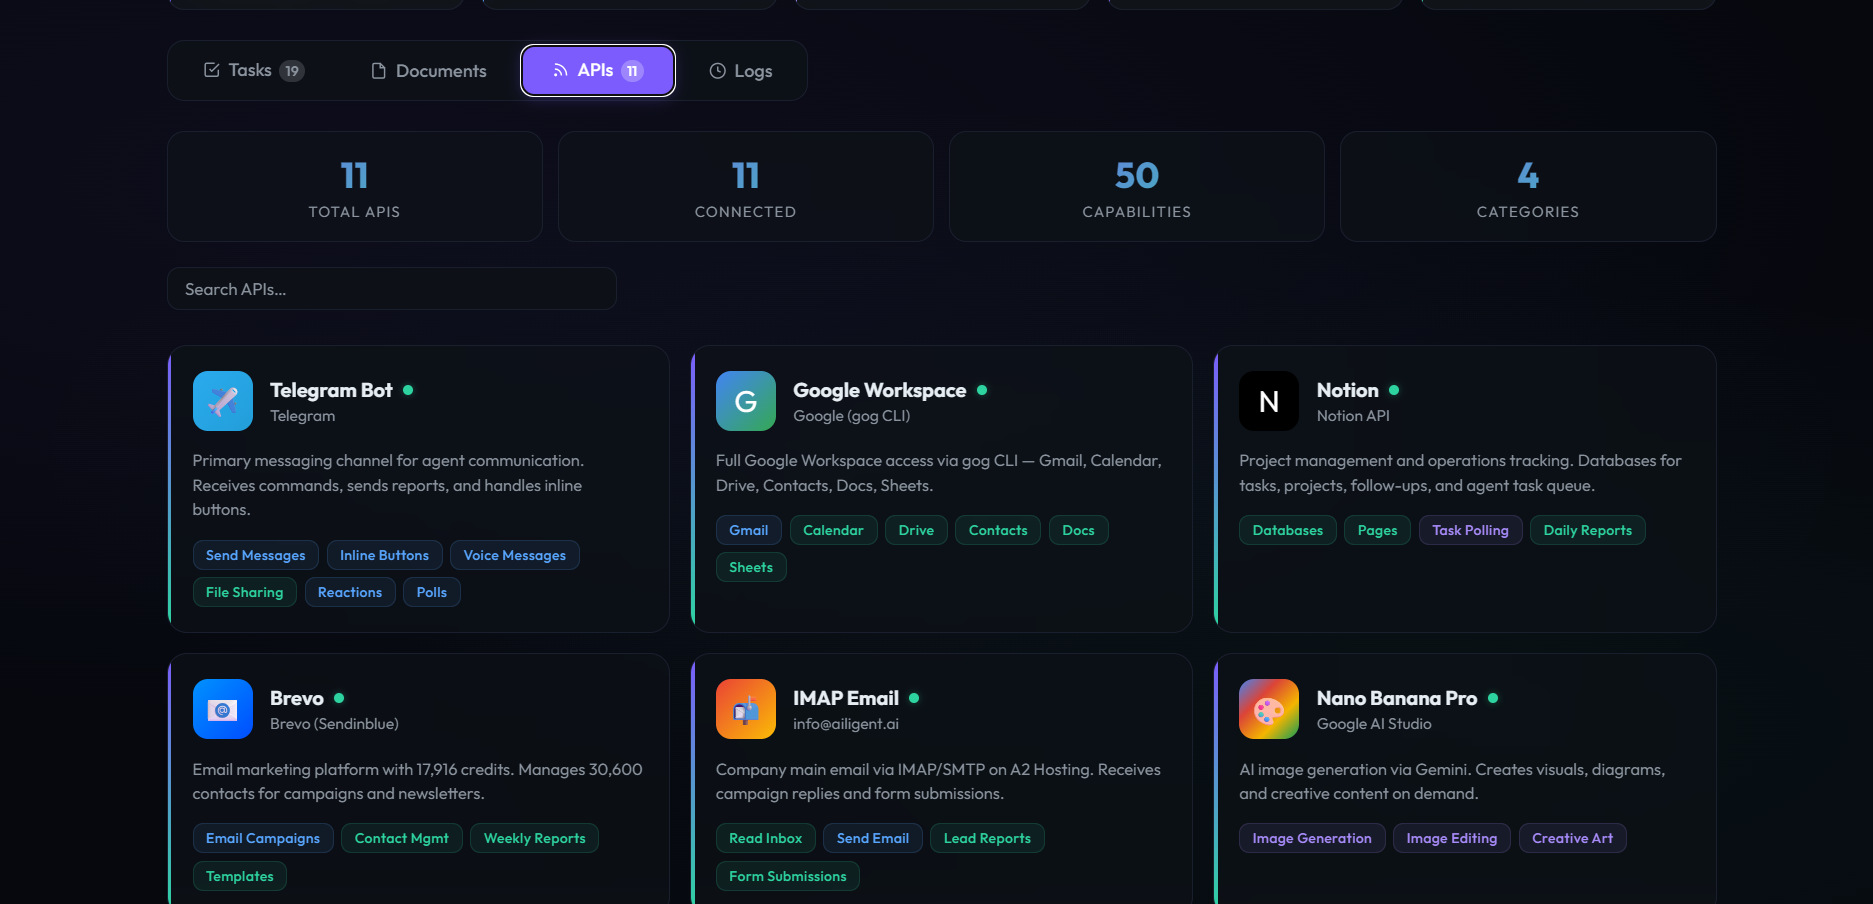 |
| Documents — Workspace Files | Connected APIs |
 |
|
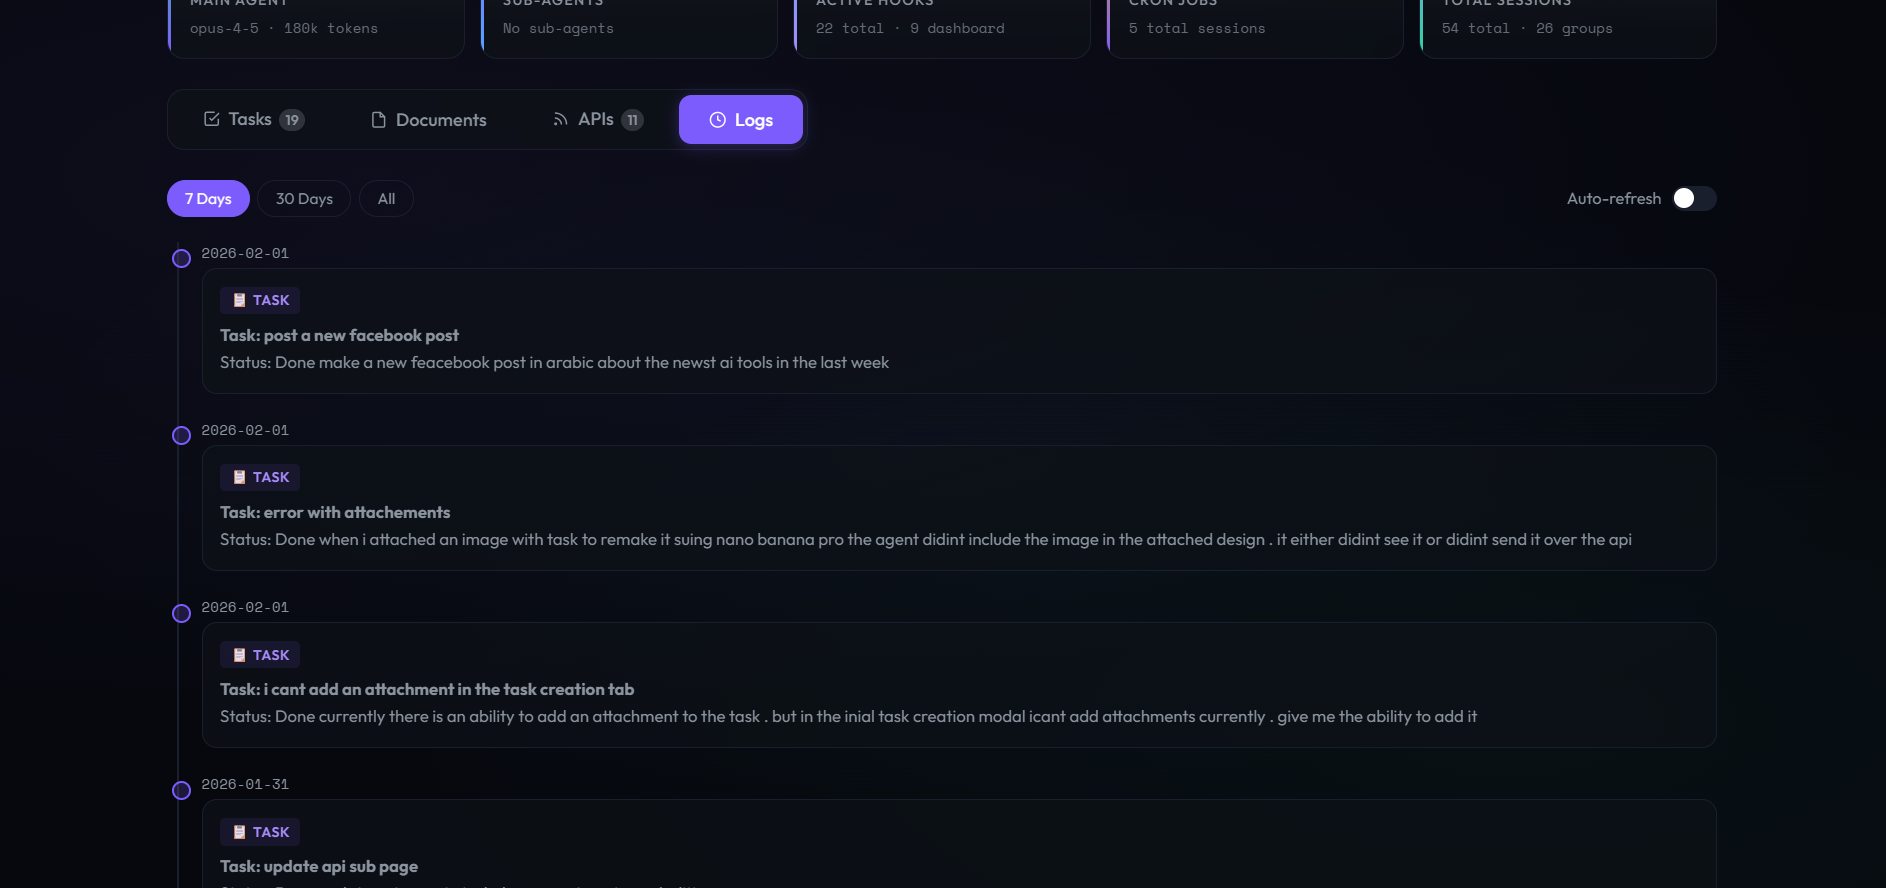
| Agent Logs |
Features
Agent Dashboard (agent-dashboard.html)
- Task Management — List & Kanban views with drag-and-drop, status filters (New / In Progress / Done / Failed), priority badges, bulk actions, and parallel task execution
- Document Editor — Markdown-powered document viewer/editor with real-time preview, file attachments, and syntax highlighting
- API Monitoring — Visual cards for 11 connected integrations (Telegram, Google Workspace, Notion, Brevo, IMAP, Whisper, and more) with capability tags and status indicators
- Agent Monitor (Logs) — Real-time log streaming with level filters, session tracking, token usage stats, and auto-scroll
- Live Dashboard Header — Main agent status, sub-agent count, active hooks, cron jobs, and total session metrics at a glance
- Active Sessions Panel — Collapsible list of running sessions with type badges (MAIN / HOOK / CRON), token counts, and last-active timestamps
Server Monitor (server-monitor.html)
- CPU / Memory / Disk / Network — Real-time gauge cards with color-coded progress bars
- Uptime & Load Average — System uptime display with 5m/15m load averages
- CPU & Memory History — Canvas-drawn 5-minute sparkline charts with live updates
- System Info — Hostname, OS, kernel, architecture, and platform details
- Process Table — Top processes sorted by CPU/memory usage
- Auto-refresh — Polls
/metricsendpoint every 5 seconds
Tech Stack
| Layer | Technology |
|---|---|
| Markup | Single-file HTML (zero build step) |
| Styling | CSS3 with glassmorphism, custom properties, gradients, backdrop-filter |
| JavaScript | Vanilla ES6+ with async/await, no framework dependencies |
| Markdown | marked.js (CDN) |
| Fonts | Outfit + Space Mono |
| Charts | Native Canvas API (server monitor sparklines) |
Installation
Drop into OpenClaw (recommended)
Copy the HTML files into your OpenClaw control-ui directory:
cp agent-dashboard.html ~/openclaw/dist/control-ui/
cp server-monitor.html ~/openclaw/dist/control-ui/dashboard.html
cp favicon.svg ~/openclaw/dist/control-ui/
Then access via your OpenClaw gateway:
https://your-server/agent-dashboard.html?token=YOUR_TOKEN
https://your-server/dashboard.html?token=YOUR_TOKEN
Standalone with Nginx
Serve the files from any web server and proxy API requests to your OpenClaw instance:
server {
    listen 443 ssl;
    server_name agent.example.com;

    root /var/www/dashboard;
    index agent-dashboard.html;

    location /tasks { proxy_pass http://127.0.0.1:18789; }
    location /files { proxy_pass http://127.0.0.1:18789; }
    location /agents { proxy_pass http://127.0.0.1:18789; }
    location /skills { proxy_pass http://127.0.0.1:18789; }
    location /metrics { proxy_pass http://127.0.0.1:18790; }
}
Any Web Server
These are plain HTML files — just serve them with any HTTP server:
# Python
python -m http.server 8080

# Node.js
npx serve .

# PHP
php -S localhost:8080
API Compatibility
The dashboard connects to standard OpenClaw REST endpoints:
| Endpoint | Used By | Purpose |
|---|---|---|
GET /tasks |
Agent Dashboard | Fetch task list |
POST /tasks |
Agent Dashboard | Create new tasks |
PATCH /tasks/:id |
Agent Dashboard | Update task status/details |
GET /files |
Agent Dashboard | List documents |
GET /agents |
Agent Dashboard | Agent status & sessions |
GET /skills |
Agent Dashboard | Available agent skills |
GET /metrics |
Server Monitor | CPU, memory, disk, network stats |
Authentication is handled via ?token= query parameter, read dynamically from the URL.
📱 Mobile & Remote Access
This fork adds browser-native authentication, mobile-first UI, and macOS auto-start — making the dashboard easy to monitor from your phone via a secure public URL.
What's added
| Feature | Details |
|---|---|
| 🔐 Login page | /login — HTML form, 30-day cookie session, no manual token in URL |
| 📱 Mobile bottom nav | Fixed tab bar at bottom for thumb-friendly navigation on phones |
| 🍎 PWA support | Add to Home Screen works on iOS Safari — feels like a native app |
| 📡 Static serving | GET / serves agent-dashboard.html directly — no separate web server needed |
| 🔎 System skills scan | /skills now discovers both workspace and system-installed OpenClaw skills |
| 🔄 macOS auto-start | LaunchAgent plist keeps the server alive across reboots |
Quick start with Tailscale Funnel (recommended for macOS)
Tailscale Funnel gives you a permanent public HTTPS URL without port forwarding or a separate cloud server.
# 1. Install Tailscale (if not already)
brew install tailscale

# 2. Start the dashboard
export OPENCLAW_AUTH_TOKEN="your-secret-token"
export OPENCLAW_WORKSPACE="$HOME/.openclaw/workspace"
node api-server.js &

# 3. Expose publicly via Tailscale Funnel (one-time setup)
tailscale funnel --bg 18791

# Your dashboard is now live at:
#   https://<your-machine>.tail-xxxxx.ts.net/
Open that URL on your phone → sign in with your token → bookmark it. Done.
macOS auto-start (LaunchAgent)
Copy macos/com.openclaw.dashboard.plist.example to ~/Library/LaunchAgents/, fill in your username and token, then:
launchctl load ~/Library/LaunchAgents/com.openclaw.dashboard.plist
The server will now start automatically on login and restart if it crashes.
Author
|
Abo-Elmakarem Shohoud Portfolio · GitHub · LinkedIn |
License
Explore related projects
affaan-m/ECC
The agent harness performance optimization system. Skills, instincts, memory, security, and research-first development for Claude Code, Codex, Opencode, Cursor and beyond.
300,787 starsNousResearch/hermes-agent
The agent that grows with you
262,437 starsmultica-ai/andrej-karpathy-skills
A single CLAUDE.md file to improve Claude Code behavior, derived from Andrej Karpathy's observations on LLM coding pitfalls.
231,855 starsfirecrawl/firecrawl
Supercharge your AI agents with data from the web and beyond. Building the library for superintelligence. 🔥
200,444 stars