
kantord/just-dashboard
kantord/just-dashboard has 1,587 GitHub stars and 58 forks. GitHot measured 0 stars in 24 hours and +1 in 7 days. Last checked 2026-11-08 20:13 UTC. Last push 2026-02-21.
:bar_chart: :clipboard: Dashboards using YAML or JSON files
Measured star growth
- in 24h
- 0
- in 7 days
- +1
- in 15 days
- Collecting history
- in 1 month
- Collecting history
Net star changes over overlapping periods, not daily totals. Missing measurements are left blank. Stars measure attention, not software quality.
README.md
Originaljust-dashboard
Documentation • Getting started • Chart types


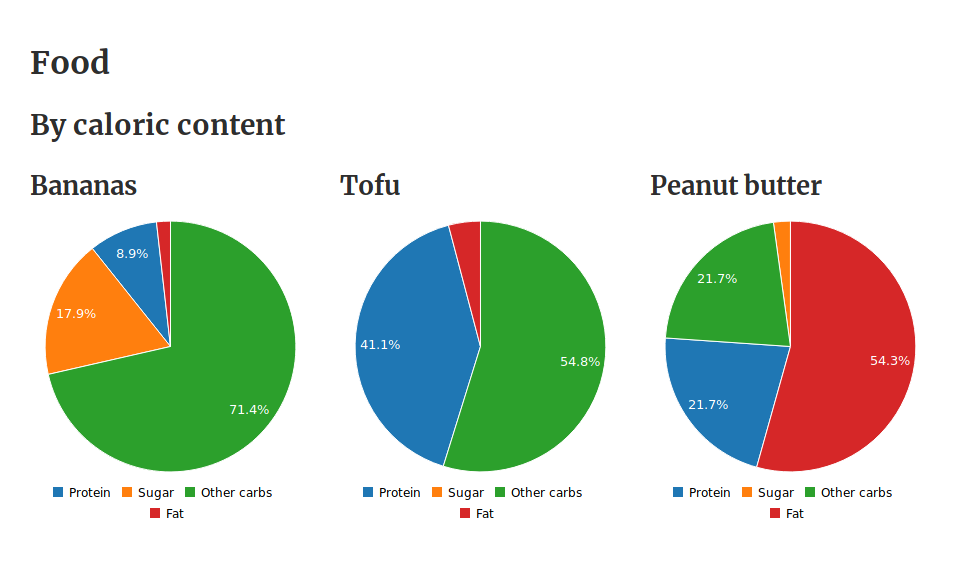
just-dashboard turns this:
dashboard "Food":
  - h1 text: Food
  - h2 text: By caloric content
  - 3 columns:
    - rows:
      - h3 text: Bananas
      - pie chart: {
          "columns": [
            ["Protein", 5], ["Sugar", 10], ["Other carbs", 40], ["Fat", 1]
          ]
        }
    - rows:
      - h3 text: Tofu
      - pie chart: {
          "columns": [
            ["Protein", 30], ["Sugar", 0], ["Other carbs", 40], ["Fat", 3]
          ]
        }
    - rows:
      - h3 text: Peanut butter
      - pie chart: {
          "columns": [
            ["Protein", 20], ["Sugar", 2], ["Other carbs", 20], ["Fat", 50]
          ]
}
Into this:
To host your dashboard, you can roll your own backend, or:
- Create a public GitHub gist with a file named dashboard.yml or dashboard.json (depending on your preferred format)
- Access it as a shareable dashboard at:
http://bottoml.in/e/{Github username}/{Gist ID}
In fact, I've created a Gist with the example above: https://gist.github.com/kantord/2973bdd4ad689642562018bb4091ffbd; thus it's accessible as a dashboard at: http://bottoml.in/e/kantord/2973bdd4ad689642562018bb4091ffbd
Explore related projects
Asabeneh/30-Days-Of-Python
The 30 Days of Python programming challenge is a step-by-step guide to learn the Python programming language in 30 days. This challenge may take more than 100 days. Follow your own pace. These videos may help too: https://www.youtube.com/channel/UC7PNRuno1rzYPb1xLa4yktw
78,370 starsgrafana/grafana
The open and composable observability and data visualization platform. Visualize metrics, logs, and traces from multiple sources like Prometheus, Loki, Elasticsearch, InfluxDB, Postgres and many more.
77,763 starsredis/redis
For developers, who are building real-time data-driven applications, Redis is the preferred, fastest, and most feature-rich cache, data structure server, and document and vector query engine.
77,288 starsapache/superset
Apache Superset is a Data Visualization and Data Exploration Platform
75,453 stars