juju35/ha-system-hub
juju35/ha-system-hub has 7 GitHub stars and 1 forks. GitHot measured 0 stars in 24 hours. Last checked 2026-11-19 03:12 UTC. Last push 2026-11-18.
What you can do
- Resources: CPU, memory, disks, network and temperatures from the System Monitor integration, with Restart Home Assistant (once the configuration is checked), Reload configuration and, with Home Assistant OS or Supervised, Reboot the host, each confirmed first; on a dashboard, the System Monitor card offers them too with show_actions: true.
- Containers: Home Assistant Core, the Supervisor and every add-on, monitored on their own — state, version, CPU and memory, with their history. Monitoring only: nothing is restarted.
- Security: refused logins (kept 7 days, a notification for each one from the Internet), accounts and 2FA, long-lived tokens (revoked from the panel), exposure (HTTPS, trusted proxies, IP ban, Home Assistant Cloud), add-ons not protected and credentials written in clear in the YAML files.
- Logs: Home Assistant's log grouped by integration — errors and warnings, how many times each came, its source and traceback, by level and period; Reload an integration, Ignore a message, Clear the log.
Measured star growth
- in 24h
- 0
- in 7 days
- Collecting history
- in 15 days
- Collecting history
- in 1 month
- Collecting history
Net star changes over overlapping periods, not daily totals. Missing measurements are left blank. Stars measure attention, not software quality.
About
Home Assistant admin hub in one sidebar panel: System Monitor, Home Assistant's Docker containers, Marketplace updates, Integration Watchdog, batteries, Git Sync, failed automations and orphaned entities, as optional modules, with their Lovelace cards.
Developer ToolsREADME.md
Originalha-system-hub





Home Assistant integration that brings the care of your Home Assistant system together in one configurable admin panel: system resources, Home Assistant's own containers, Marketplace updates, the integration watchdog, battery levels, Git sync of your configuration and orphaned entities. Each feature is a module you can turn on or off.
System Hub replaces ha-system-monitor-card, ha-marketplace-refresh, ha-integration-watchdog, ha-battery-monitor, ha-git-sync and ha-orphan-entities: see Migrating to move over.
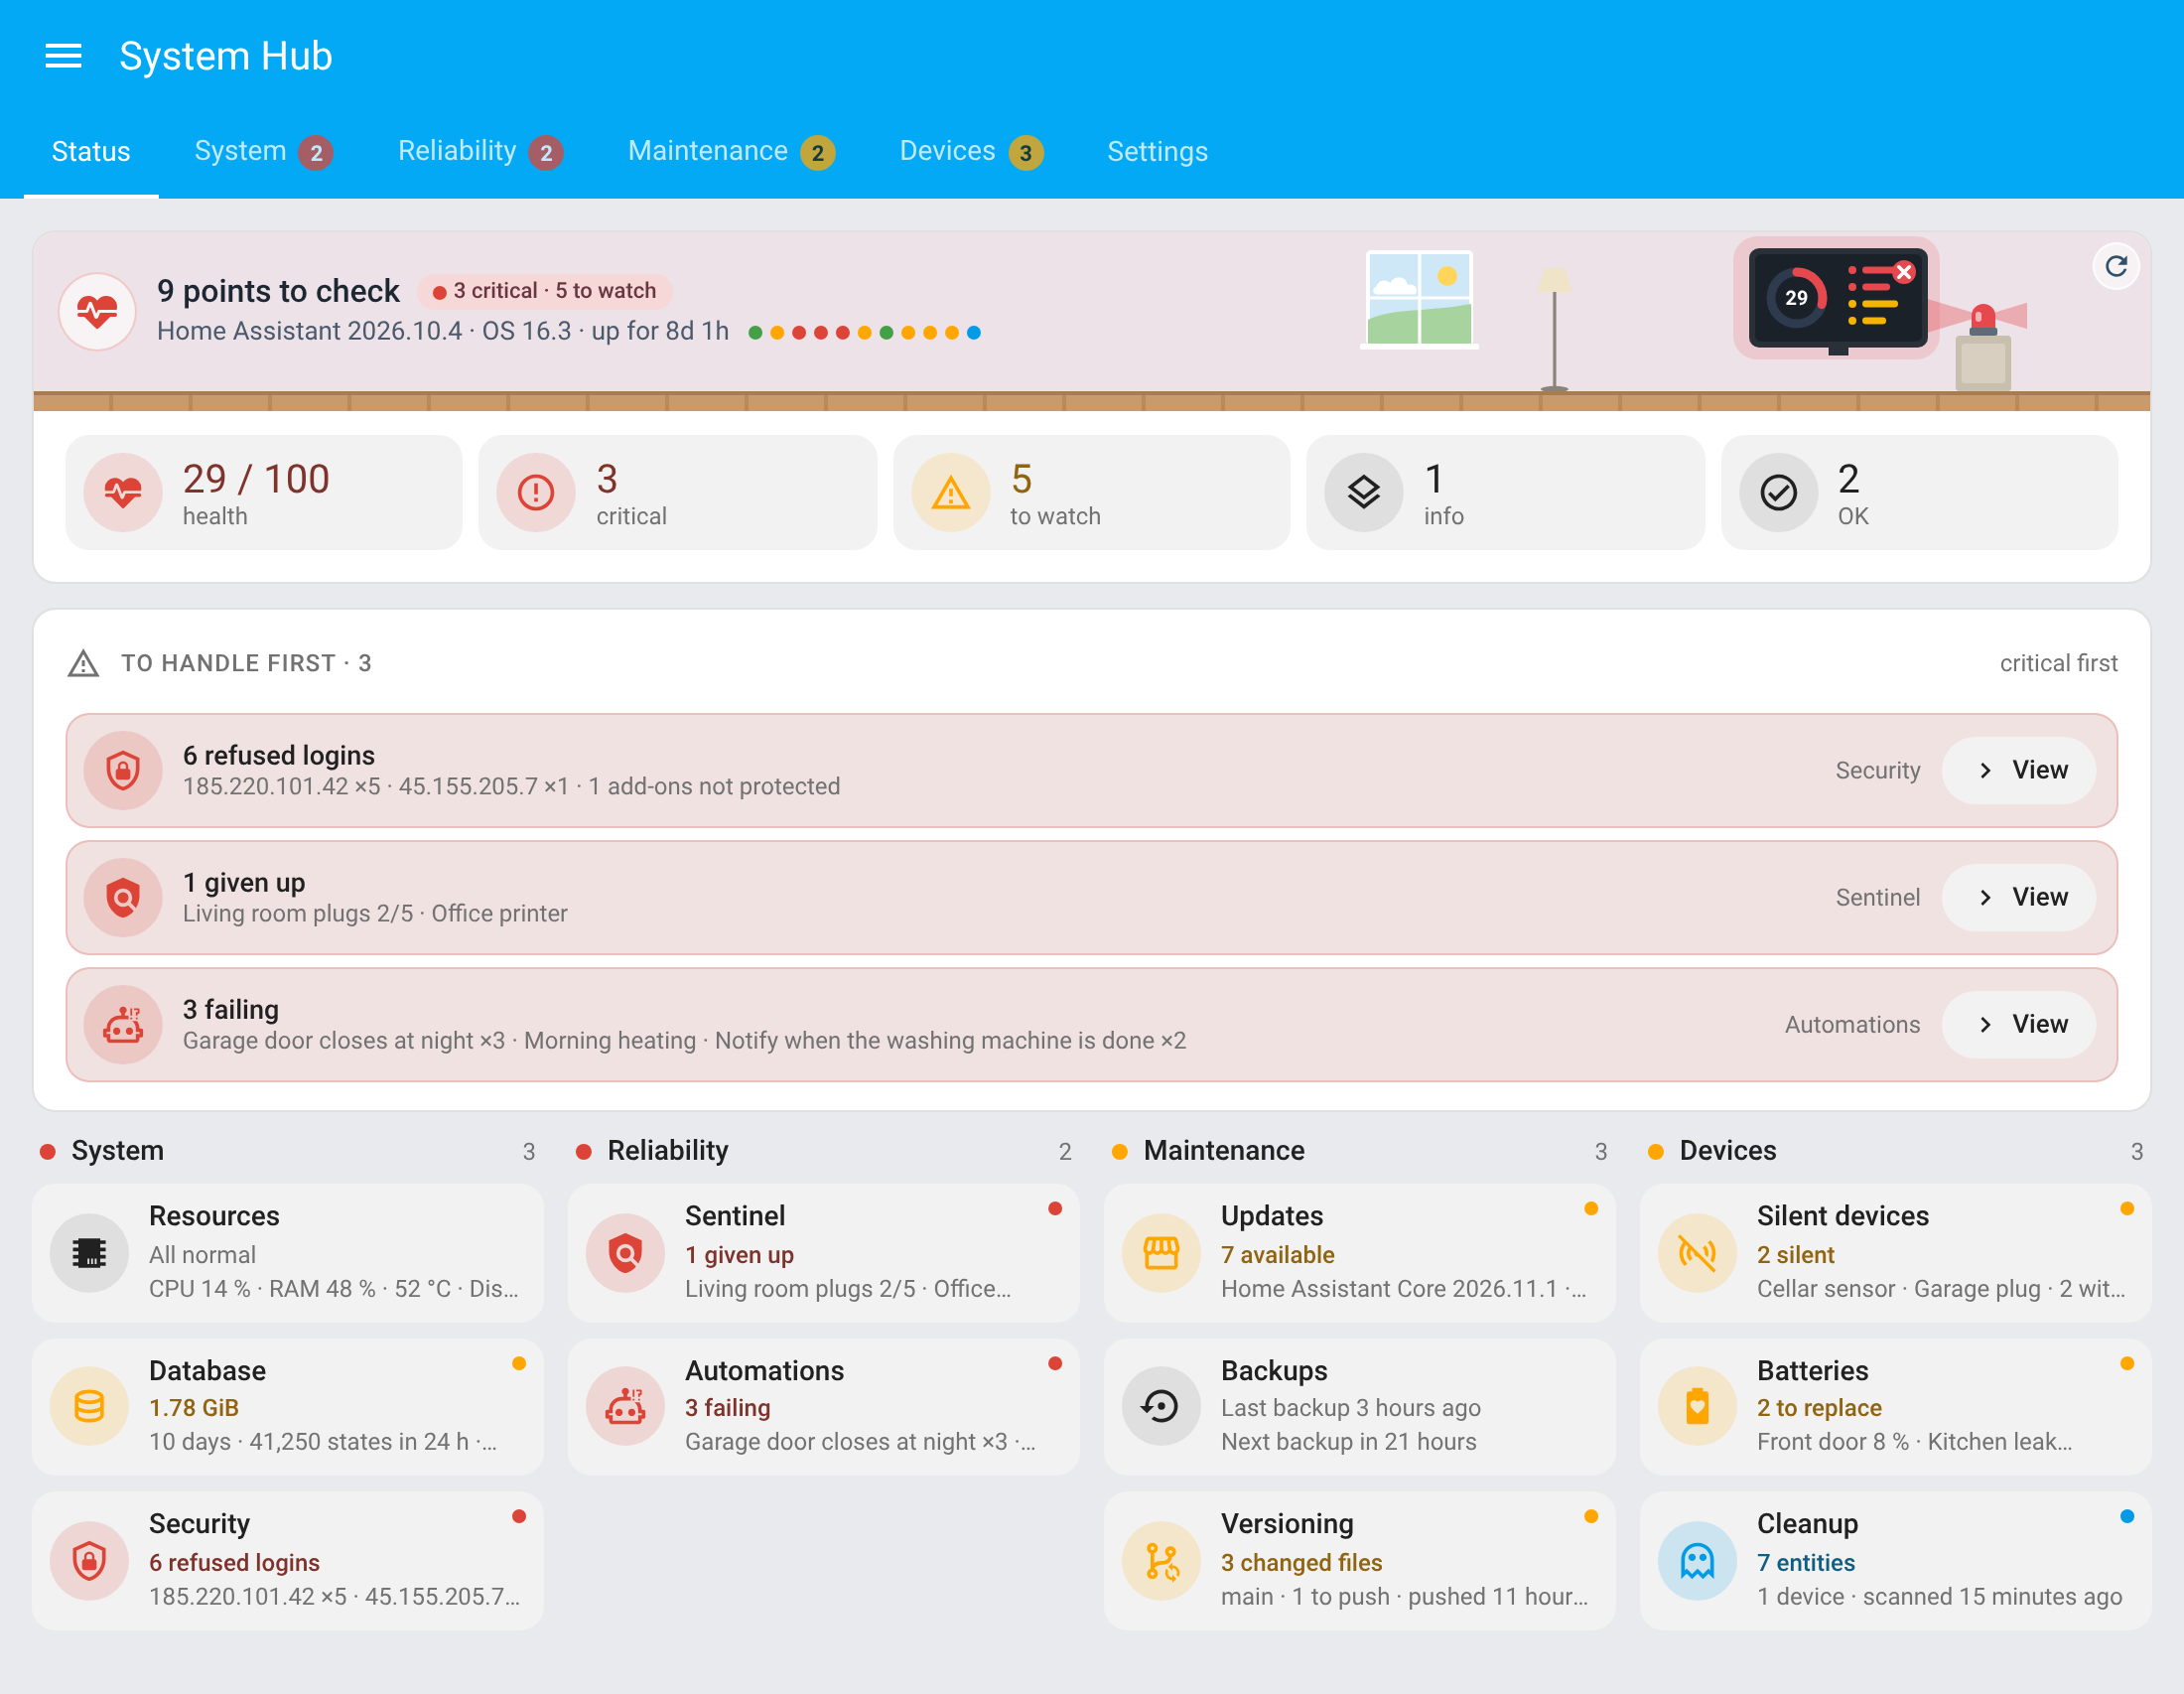
The hero of the Status tab scores the home's health out of 100 — 100 minus a weight for every area to watch — with the ring, the emblem and the count in the tone of the worst area:


The sidebar entry carries a badge with the number of points to check, in the Status tone (green when healthy, amber to watch, red for a problem), like the notifications count:
| System Monitor | Watchdog | Marketplace Refresh |
|---|---|---|
 |
 |
 |
| Battery Monitor | Git Sync | Orphan Entities |
|---|---|---|
 |
 |
 |
| Automation Monitor | ||
|---|---|---|
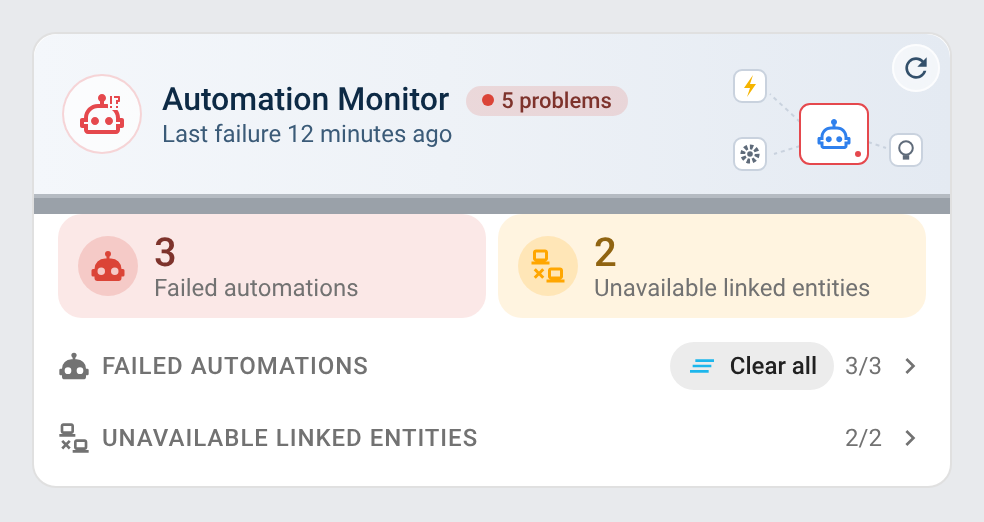 |
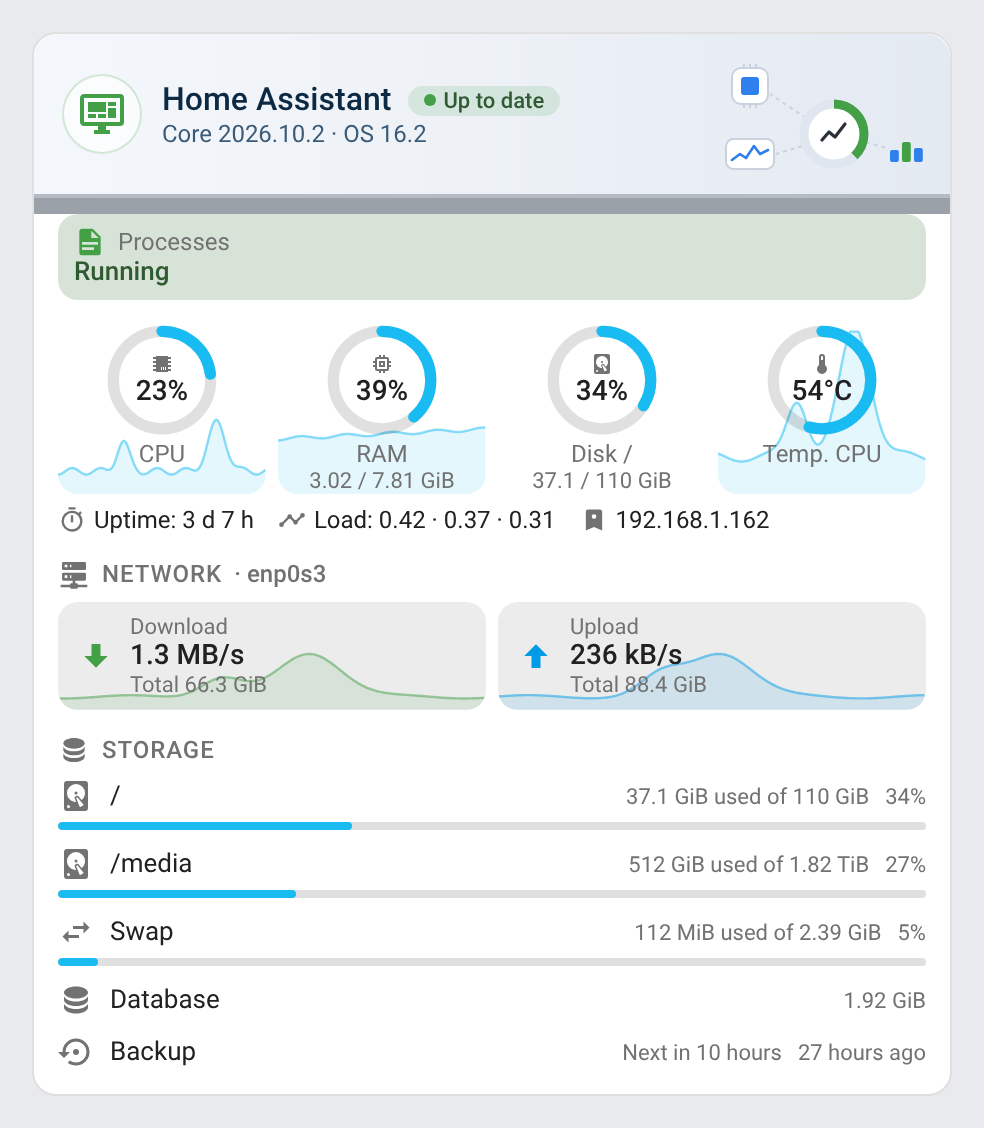
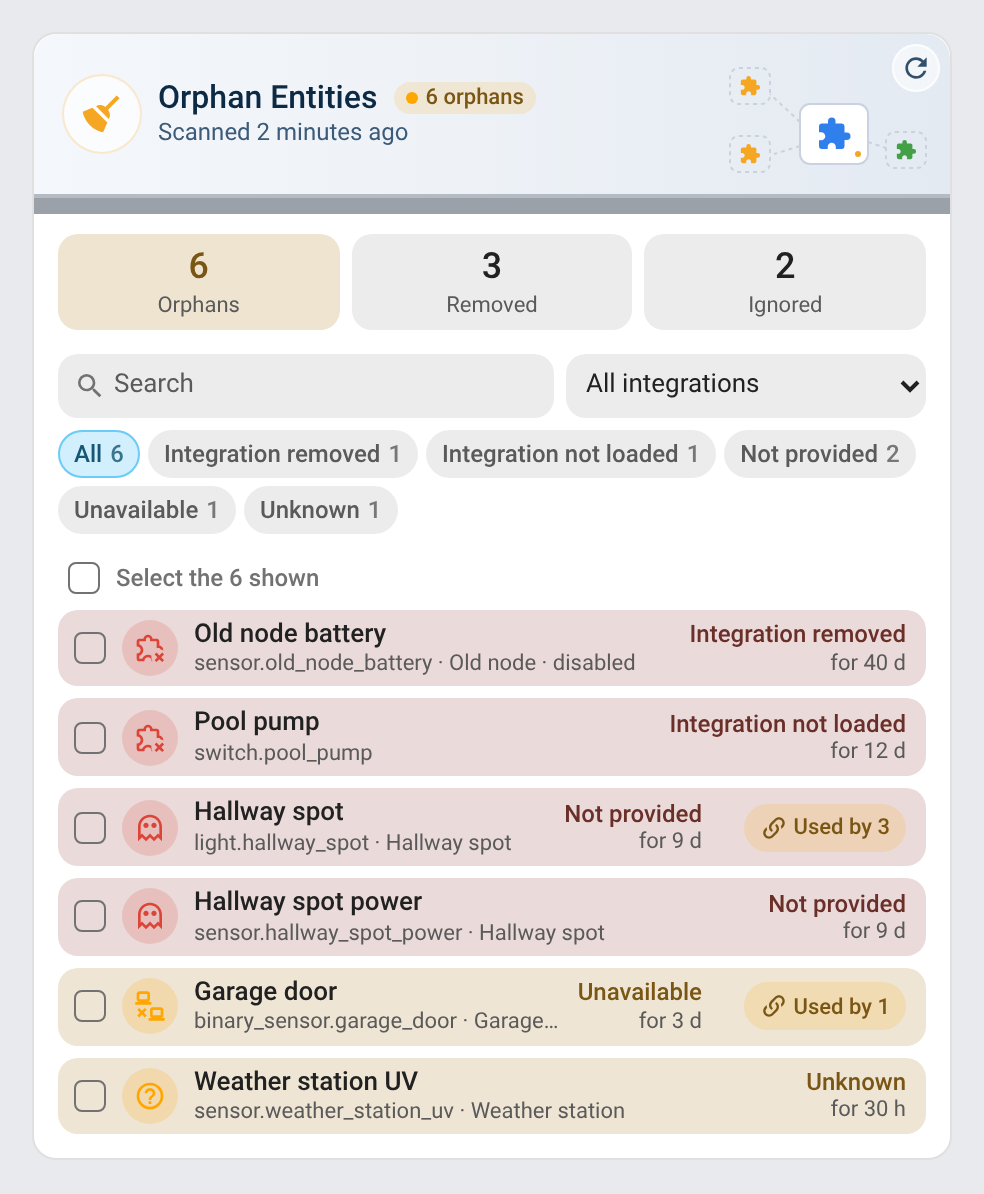
The Lovelace cards served by System Hub; each card's section shows its mini card, its states and its dark theme.
Features
- Resources: CPU, memory, disks, network and temperatures from the System Monitor integration, with Restart Home Assistant (once the configuration is checked), Reload configuration and, with Home Assistant OS or Supervised, Reboot the host, each confirmed first; on a dashboard, the System Monitor card offers them too with
show_actions: true. - Containers: Home Assistant Core, the Supervisor and every add-on, monitored on their own — state, version, CPU and memory, with their history. Monitoring only: nothing is restarted.
- Database: the recorder's database, SQLite, MariaDB / MySQL or PostgreSQL — its size against a limit you set and its growth (a size sensor the recorder keeps the history of), its tables (rows and size), the space a repack would free, its retention, the states written in 24 hours and the entities that write the most; purge their history, copy the YAML that leaves them out of the recorder, Purge and repack.
- Security: refused logins (kept 7 days, a notification for each one from the Internet), accounts and 2FA, long-lived tokens (revoked from the panel), exposure (HTTPS, trusted proxies, IP ban, Home Assistant Cloud), add-ons not protected and credentials written in clear in the YAML files.
- Logs: Home Assistant's log grouped by integration — errors and warnings, how many times each came, its source and traceback, by level and period; Reload an integration, Ignore a message, Clear the log.
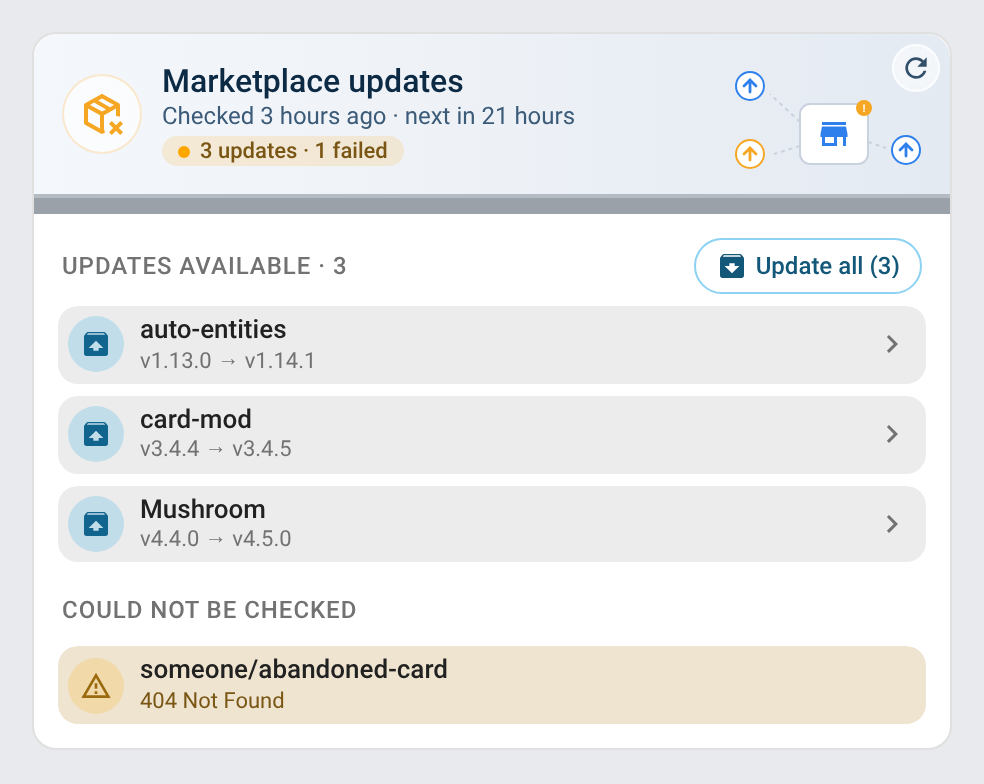
- Updates (formerly Marketplace): every update in one tab — Home Assistant (Core, Supervisor, OS), the add-ons, the devices and services (firmware of a Zigbee or ESPHome device…) and the Marketplace repositories, with a server-side check of the Marketplace at an interval you choose.
- Backups: Home Assistant's own backups at a glance — the last successful one, the next one, each location (local, network storage, cloud) with its last copy and its failures, the last 30 days and the backups kept; Back up now. A problem on the Status tab when the last attempt failed, a location fails or the last success is older than the age you set.
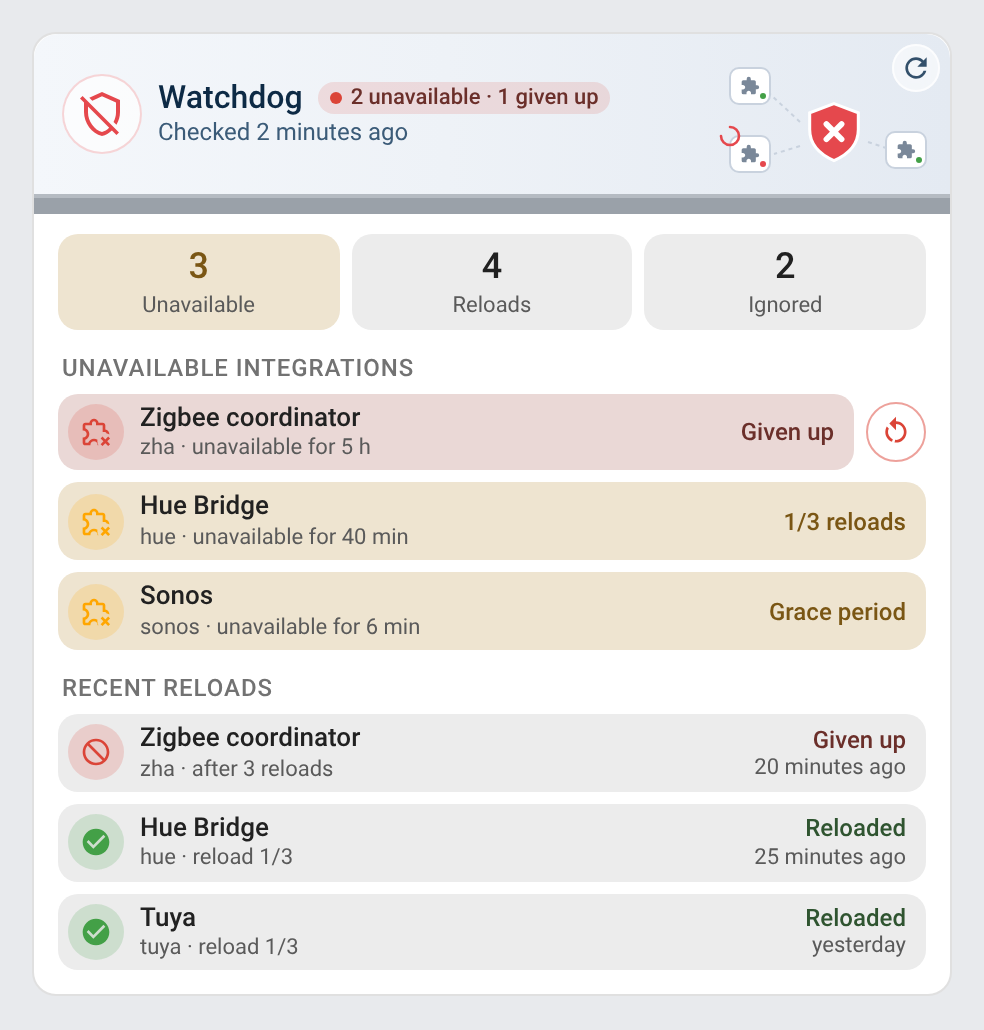
- Sentinel (formerly Watchdog): reloads the integrations whose entities are all unavailable, with ignored integrations, power cycles through a smart plug and a notification on each reload.
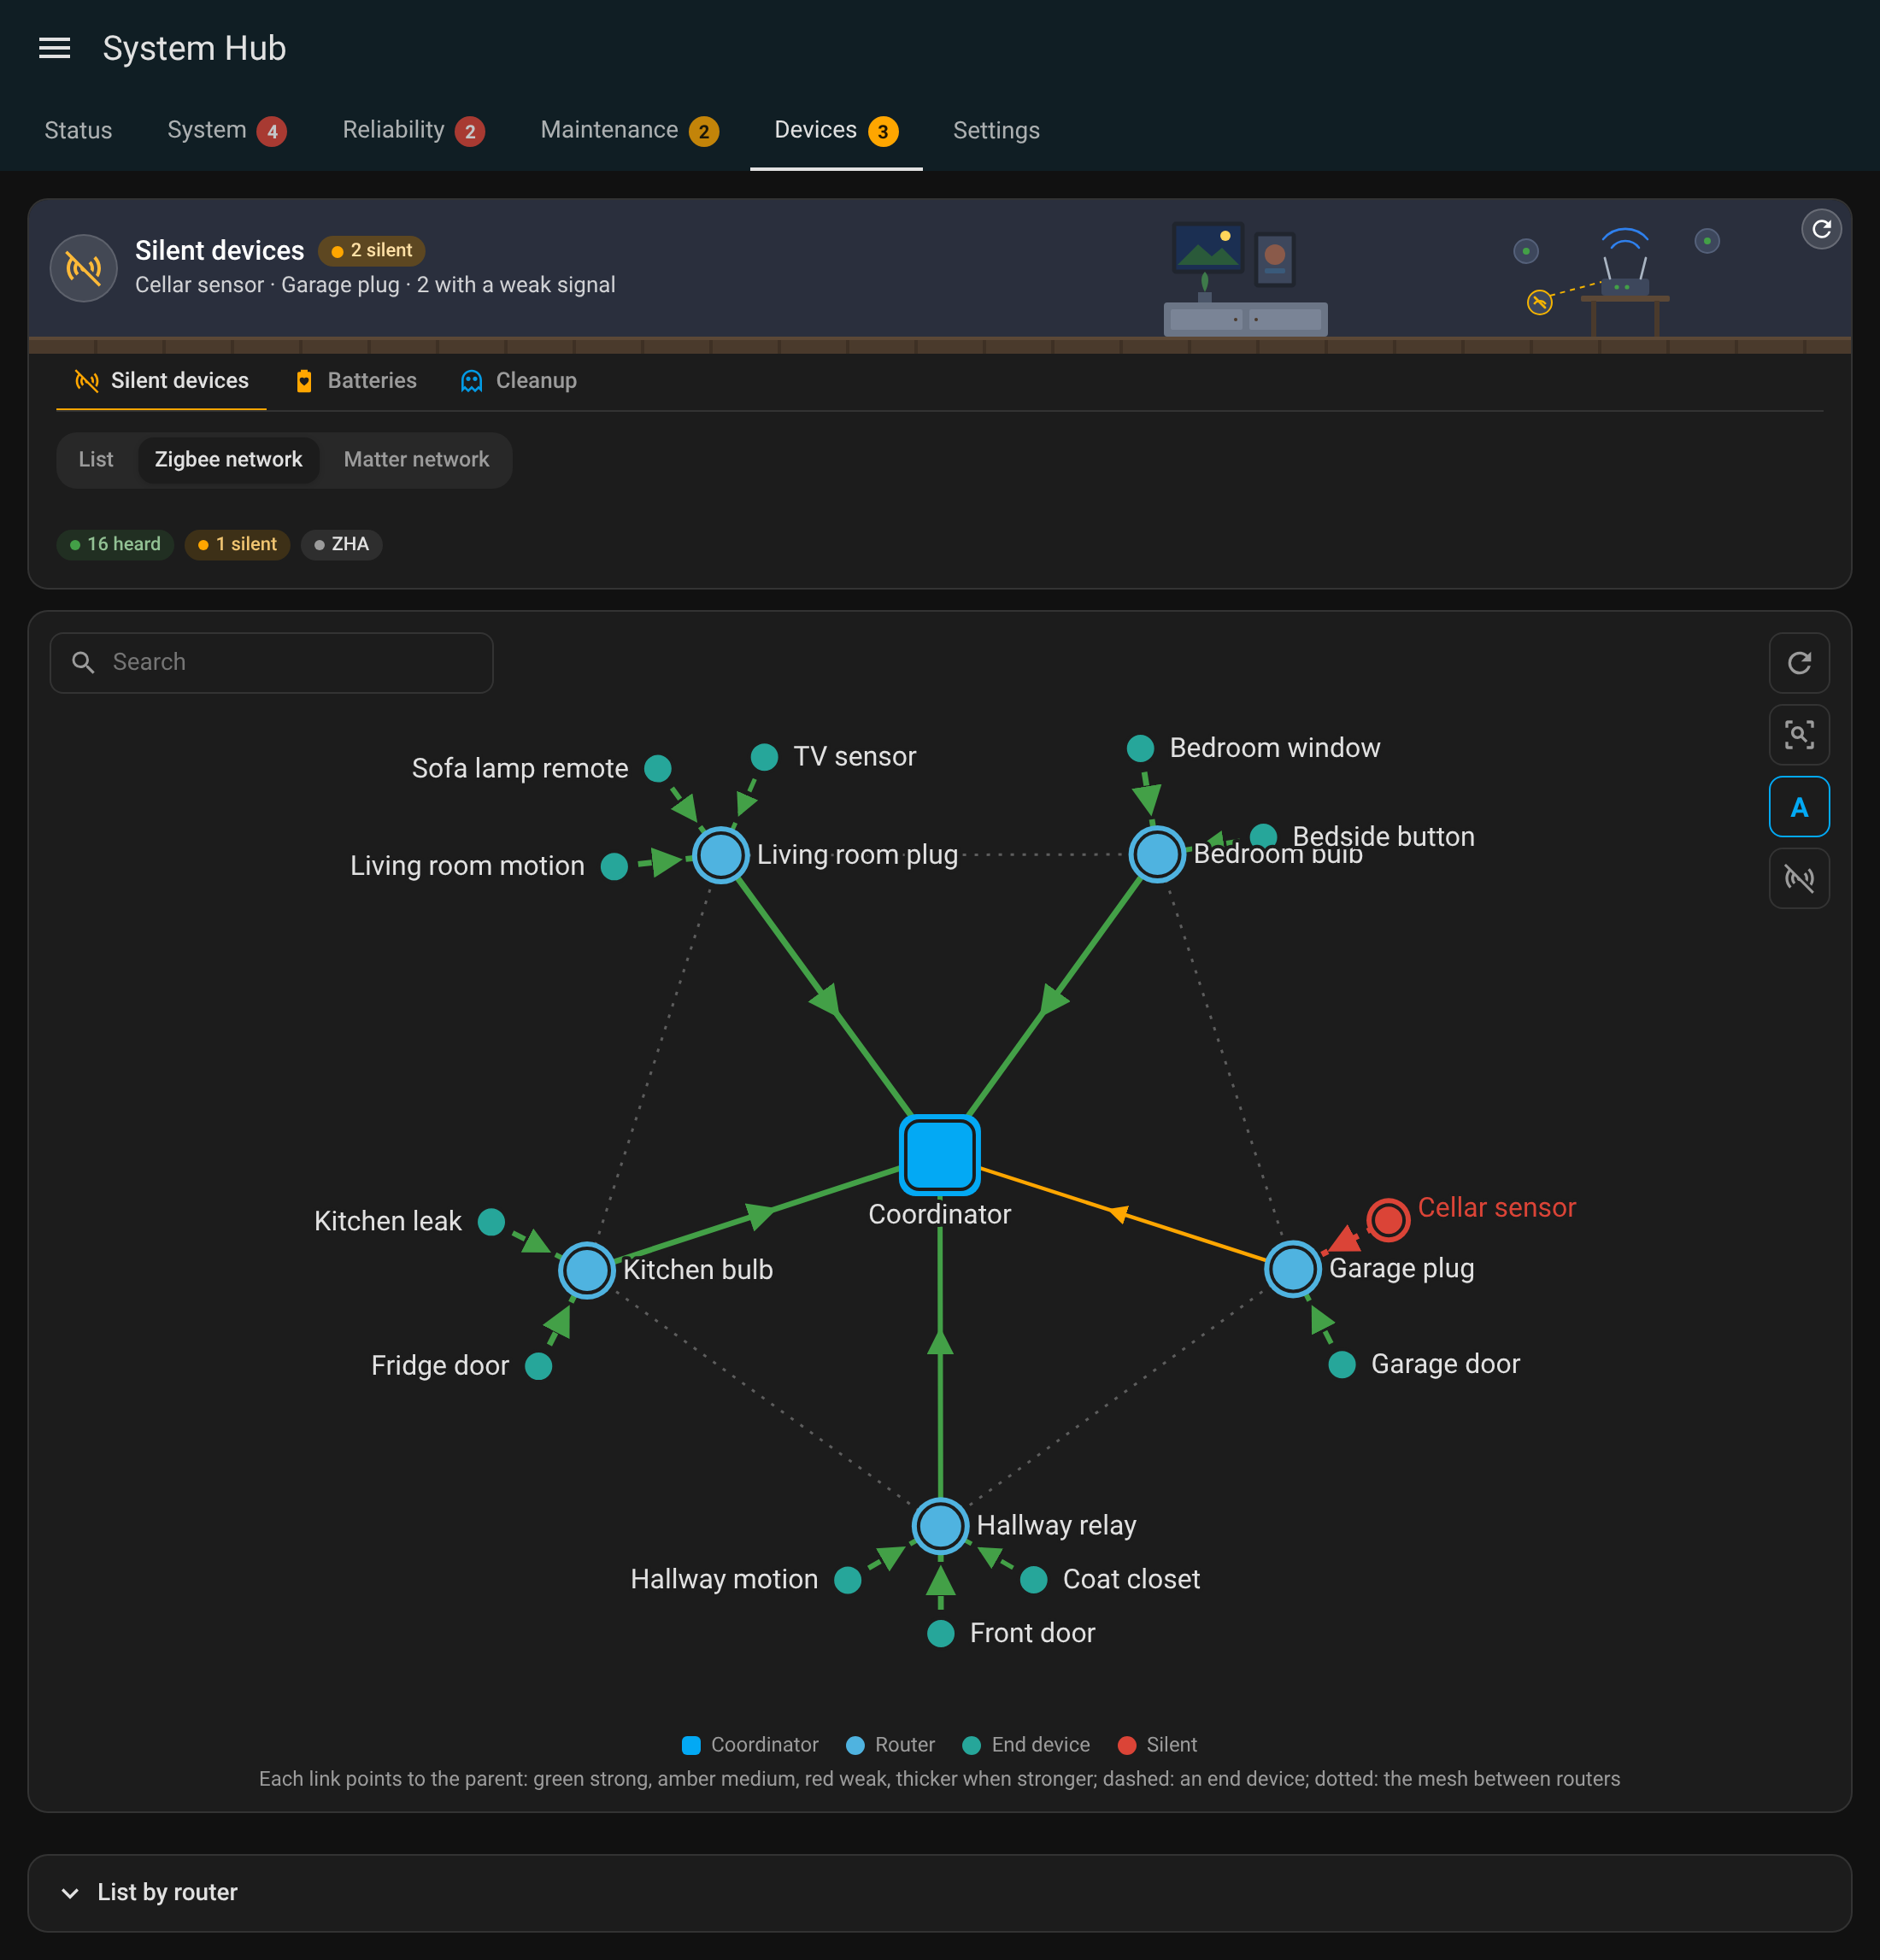
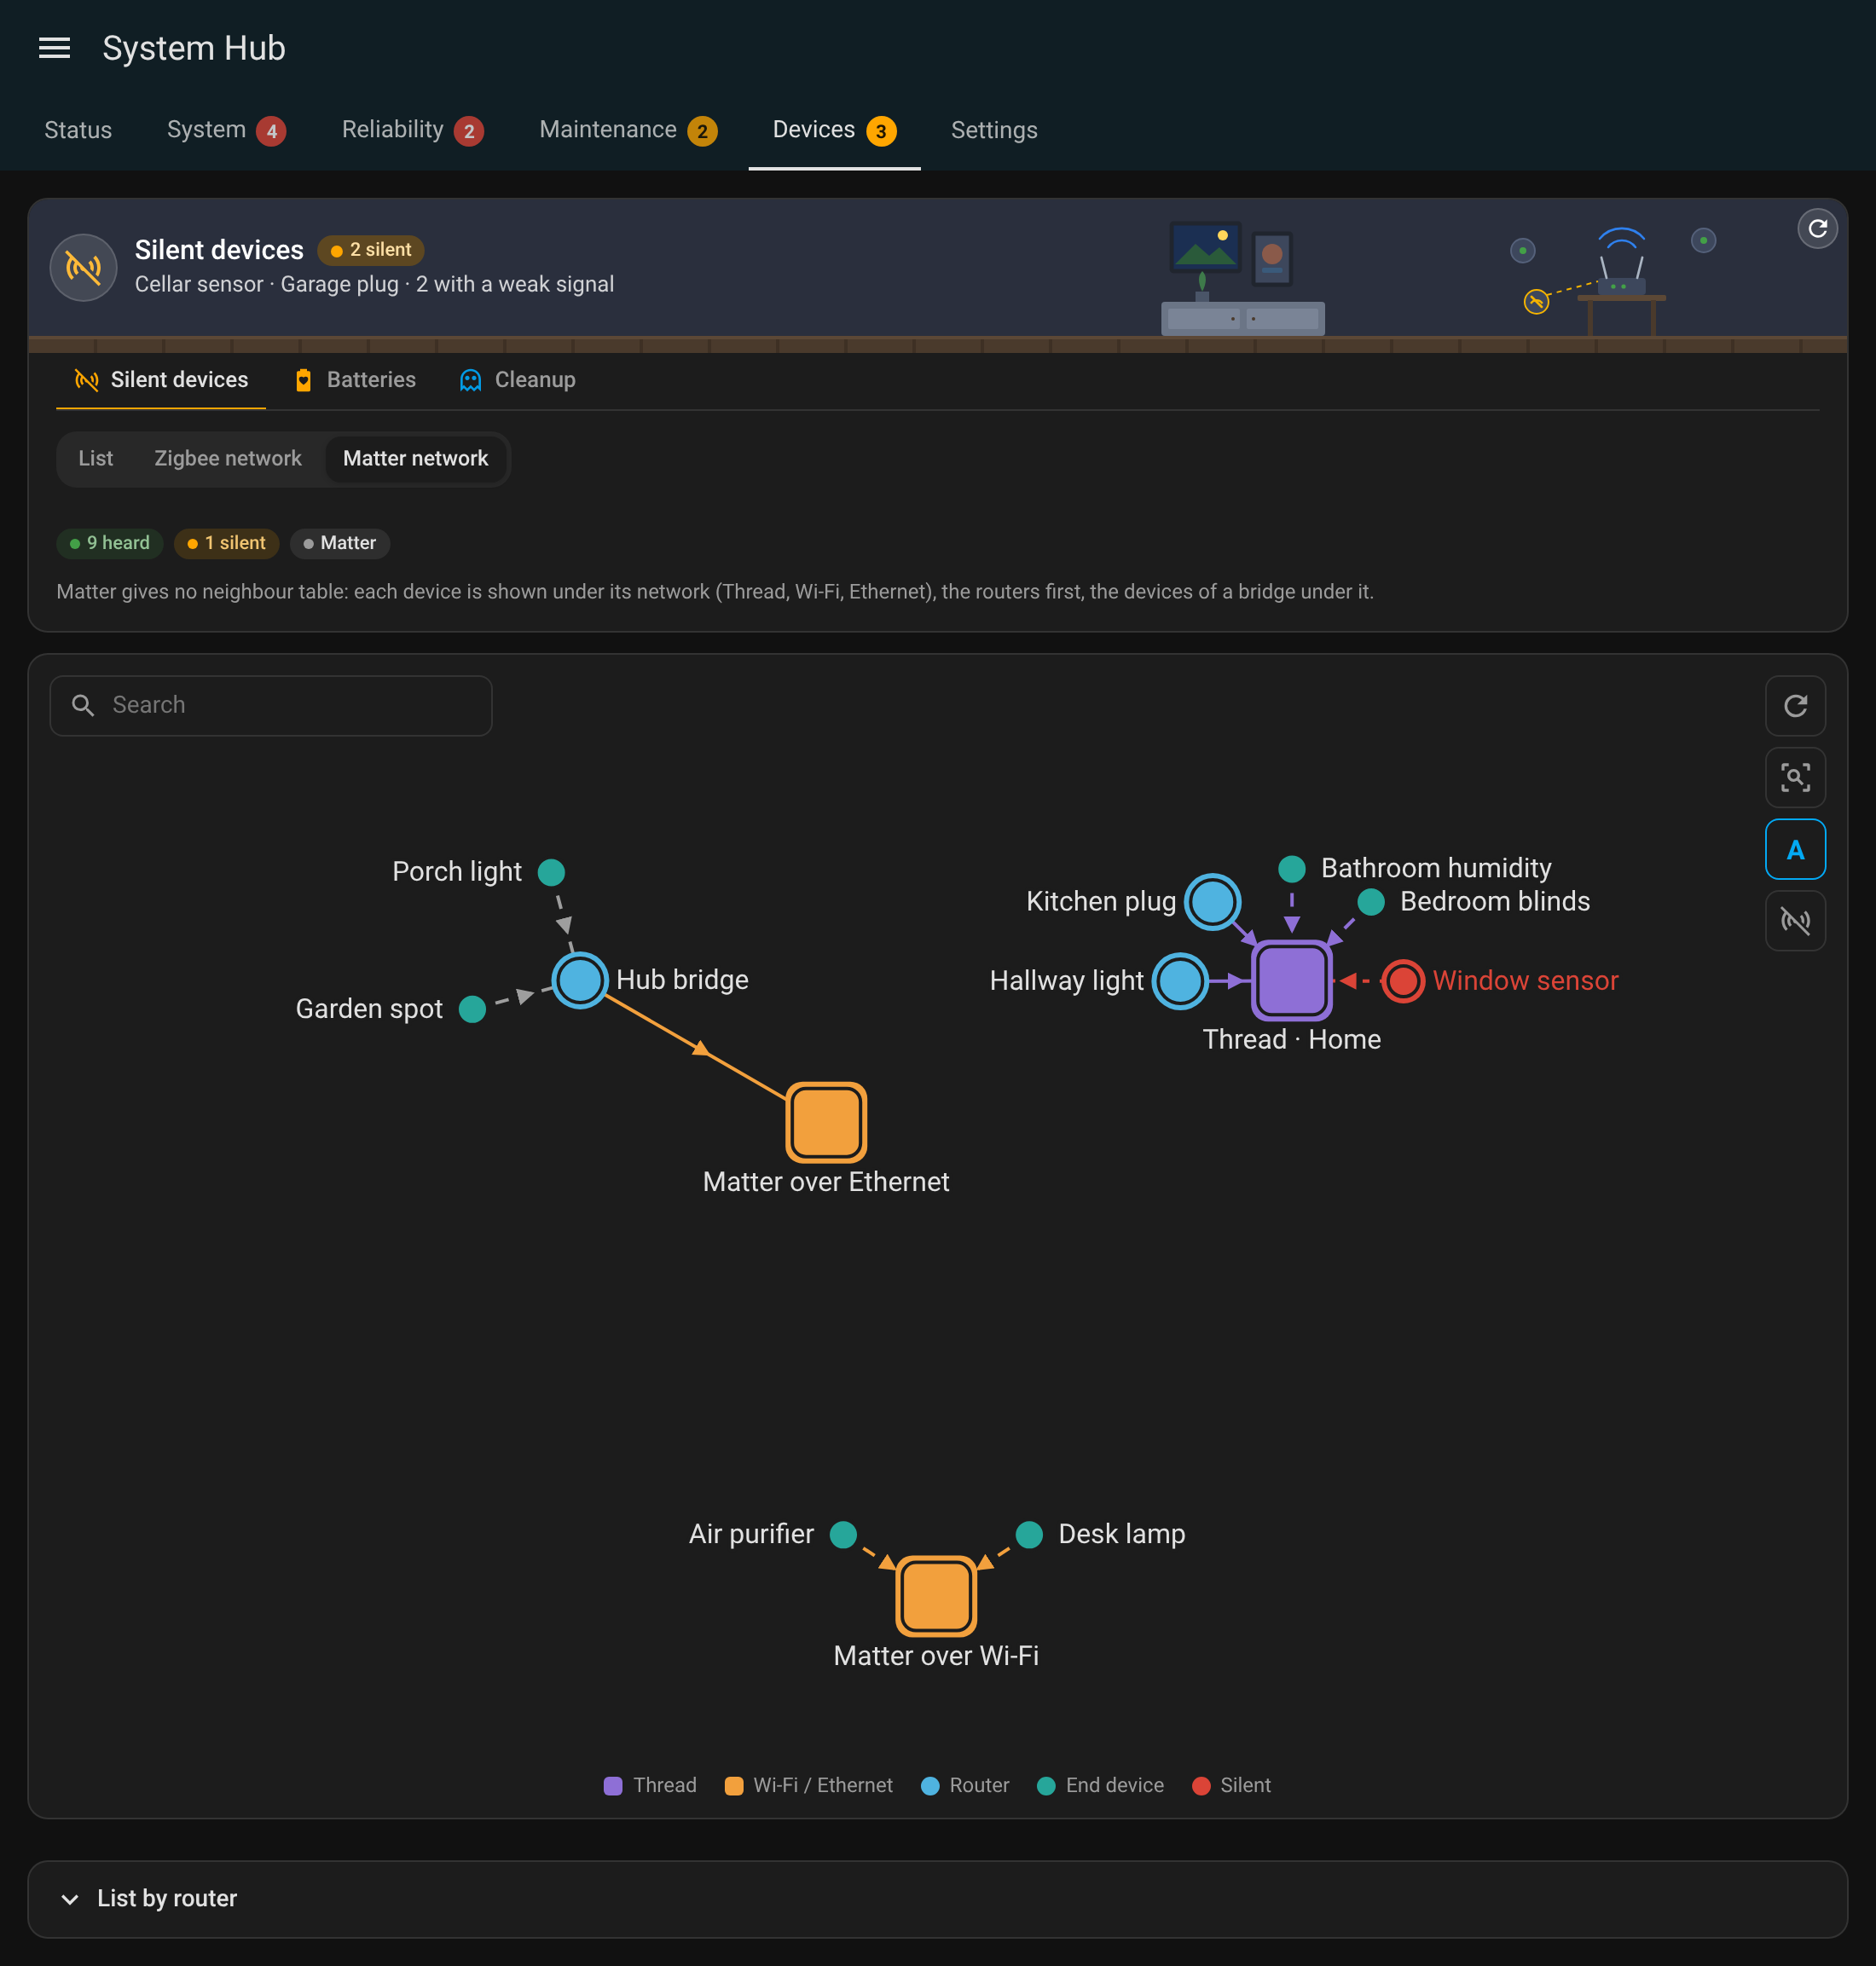
- Silent devices: the devices of ZHA, Zigbee2MQTT, Z-Wave, Matter, ESPHome and deCONZ not heard from beyond the hours you set (on a battery and on mains), or unavailable, then the weak signals (LQI below 50, RSSI below −80 dBm); each with its room, when it was last heard, its signal and its battery; a filter per integration, Ignore in one click; the Zigbee network (ZHA or Zigbee2MQTT) and the Matter network drawn as an interactive map (search, zoom, details on hover), the silent devices in red on their last link.
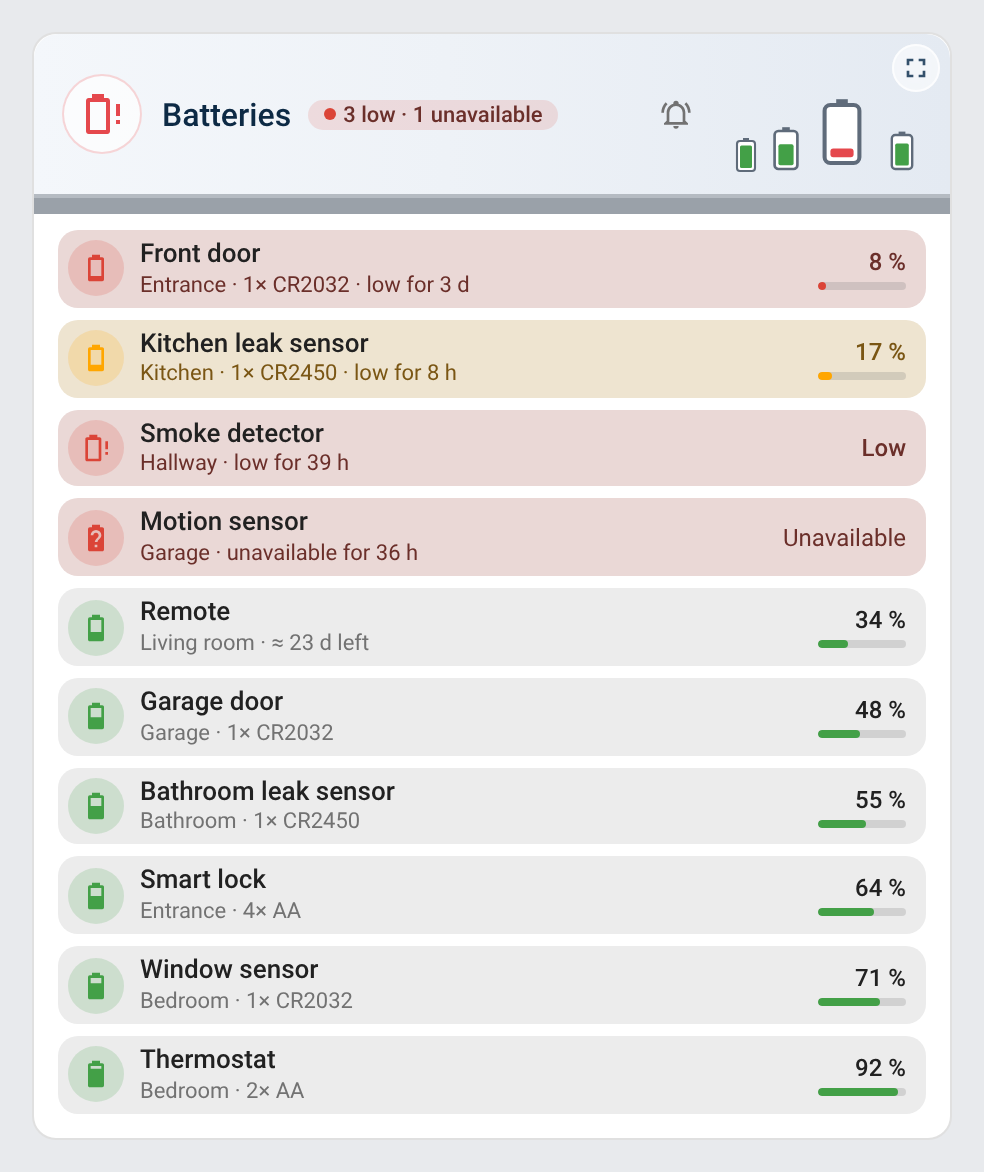
- Batteries: battery levels of every device, low-battery notifications.
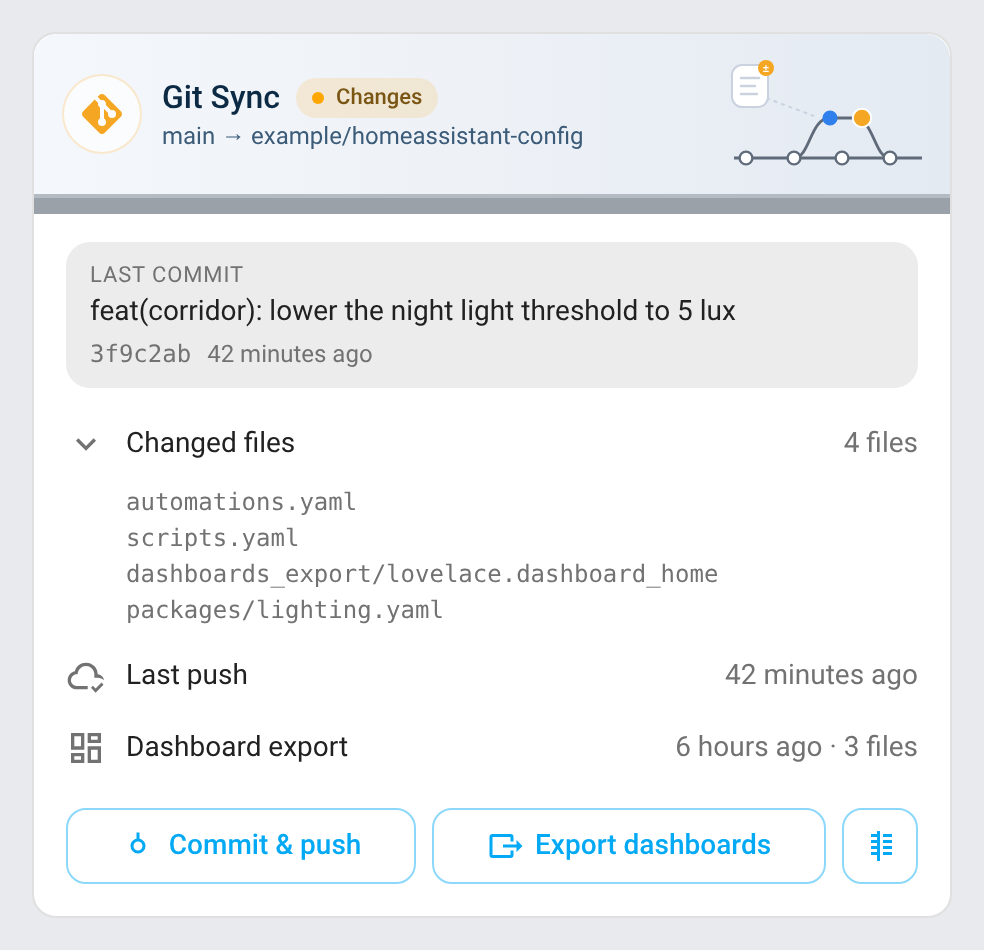
- Versioning (formerly Git Sync): commit and push your configuration and export the dashboards to a Git repository.
- Automations: the failed automations and the unavailable entities they use, as reported by Automation Monitor, with their trace and editor.
- Cleanup (formerly Orphans): the entities their integration no longer provides and the devices left behind, with what still uses them, removed or ignored in bulk.
- Modules: Containers, Database, Security, Logs, Updates, Backups, Silent devices, Sentinel, Batteries, Versioning, Automations and Cleanup can each be turned on or off; a module turned off stops its checks, removes its entities and hides its tab.
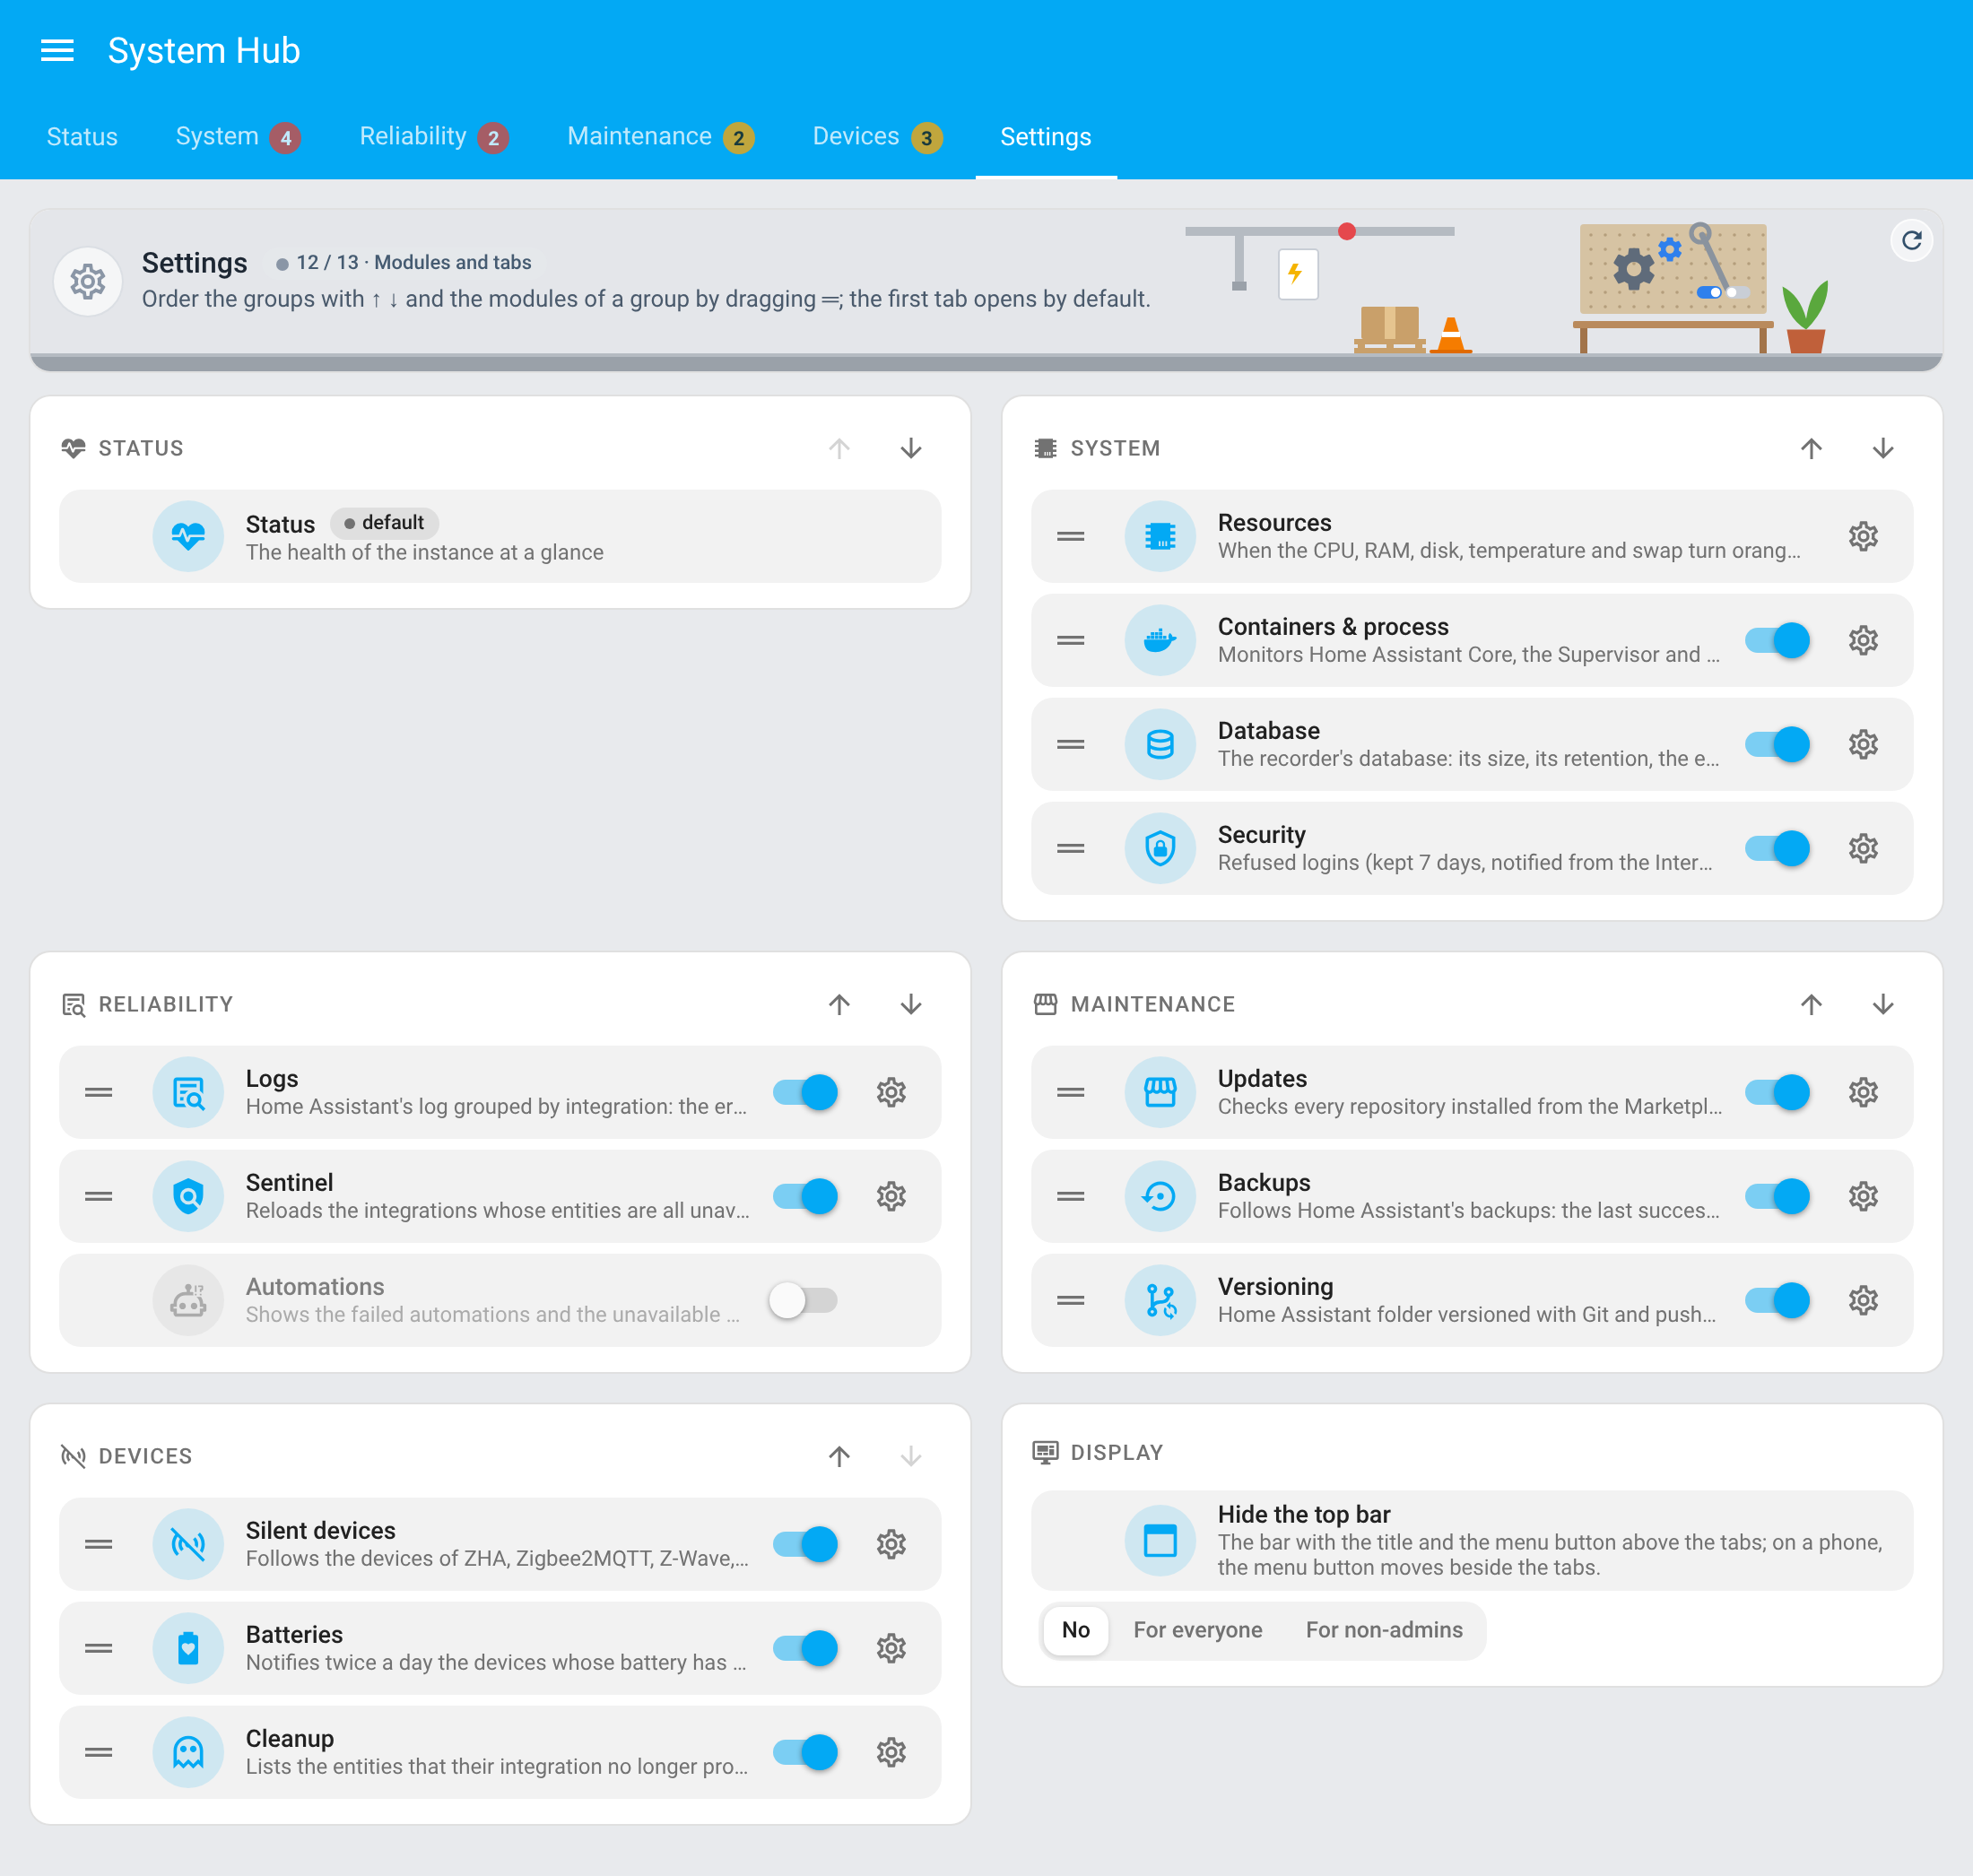
- Admin panel: one sidebar panel with a Status tab and the modules in four groups, each a tab with its modules as sub-tabs: System (Resources, Containers, Database, Security), Reliability (Logs, Sentinel, Automations), Maintenance (Updates, Backups, Versioning) and Devices (Silent devices, Batteries, Cleanup); the groups and the modules inside them can be ordered.
Supported integrations
| Integration | Used for |
|---|---|
| System Monitor | System tab of the panel |
| Supervisor | Containers module (Home Assistant OS and Supervised installations) |
| Marketplace | Updates module |
| Backup | Backups module |
| Recorder (SQLite, MariaDB / MySQL or PostgreSQL) | Database module |
| System Log | Logs module |
| ZHA, MQTT (Zigbee2MQTT), Z-Wave, Matter, ESPHome, deCONZ | Silent devices module (the integrations followed can be chosen) |
| AI Task | Commit messages of the Git Sync module (optional) |
| Automation Monitor (custom integration) | Automations module |
Prerequisites
- Home Assistant 2024.12 or newer. The Marketplace module needs Home Assistant 2026.11 or newer (the Marketplace came with it); the other modules work from 2024.12
Installation
Via the Marketplace (recommended)
Click the button below to add the repository directly:

Then click Install and restart Home Assistant.
Or manually:
- Open Settings → Marketplace → Add from link (top right; this needs a GitHub account connected)
- Add
https://github.com/juju35/ha-system-hub— Type: Integration - Open System Hub and click Install
- Restart Home Assistant
Before Home Assistant 2026.11, add it the same way as a custom repository of HACS (HACS → ⋮ → Custom repositories, Type: Integration).
Manual
Copy custom_components/system_hub/ to /config/custom_components/system_hub/, then restart Home Assistant.
Configuration

Settings → Devices & services → Add integration → System Hub, then choose the modules to turn on. The Containers module needs the Supervisor (Home Assistant OS or a Supervised installation), the Marketplace module Home Assistant's Marketplace.
Everything else is set in the panel's Settings tab (System Hub in the sidebar): the modules turned on or off, the order of the tabs and every module's settings. Configure on the integration's page opens the same settings, as a menu; the link of every System Hub device opens this tab.
Modules
| Module | Default | What it does |
|---|---|---|
| Containers | on with Home Assistant OS or Supervised | Monitors Home Assistant Core, the Supervisor and the add-ons: state, version, CPU, memory. Monitoring only, nothing is restarted |
| Watchdog | on | Reloads the integrations whose entities are all unavailable, power cycles devices through their smart plug |
| Marketplace | on when the Marketplace is loaded | Checks every repository installed from the Marketplace for updates, on the server, and installs them on demand |
| Batteries | on | Notifies the low batteries twice a day, forecasts the replacements, counts the spare batteries |
| Git Sync | off (needs a repository) | Commits and pushes the configuration to Git with AI commit messages, exports the dashboards |
| Automations | on when Automation Monitor is loaded | Shows the failed automations and the unavailable linked entities reported by Automation Monitor; no entities of its own |
| Orphans | on | Lists the entities their integration no longer provides and the orphan devices, with what still uses them; removes or ignores them in bulk |
A module turned off is not set up: its checks stop, its entities and its device are removed, its actions fail with The … module is turned off, and the Watchdog's Repairs issues and notifications are dismissed. Its settings and saved state (the Watchdog's history and reload counts, the Marketplace's last check, the Batteries' low-battery times and spare stock) are kept, so turning it back on picks up where it left off.
Every module has its own device, named in the language of Home Assistant (System Hub Containers, System Hub Sentinel, System Hub Updates, System Hub Batteries, System Hub Versioning, System Hub Cleanup in English) holding its entities. The entity IDs below are those of a new installation in English (sensor.system_hub_sentinel_…); they follow the device's name when the entities are created, so an installation made before 2.0 keeps its own (sensor.system_hub_watchdog_…, …_marketplace_…, …_git_sync_…, …_orphans_…), and the cards find their entities whatever their IDs.
Module settings
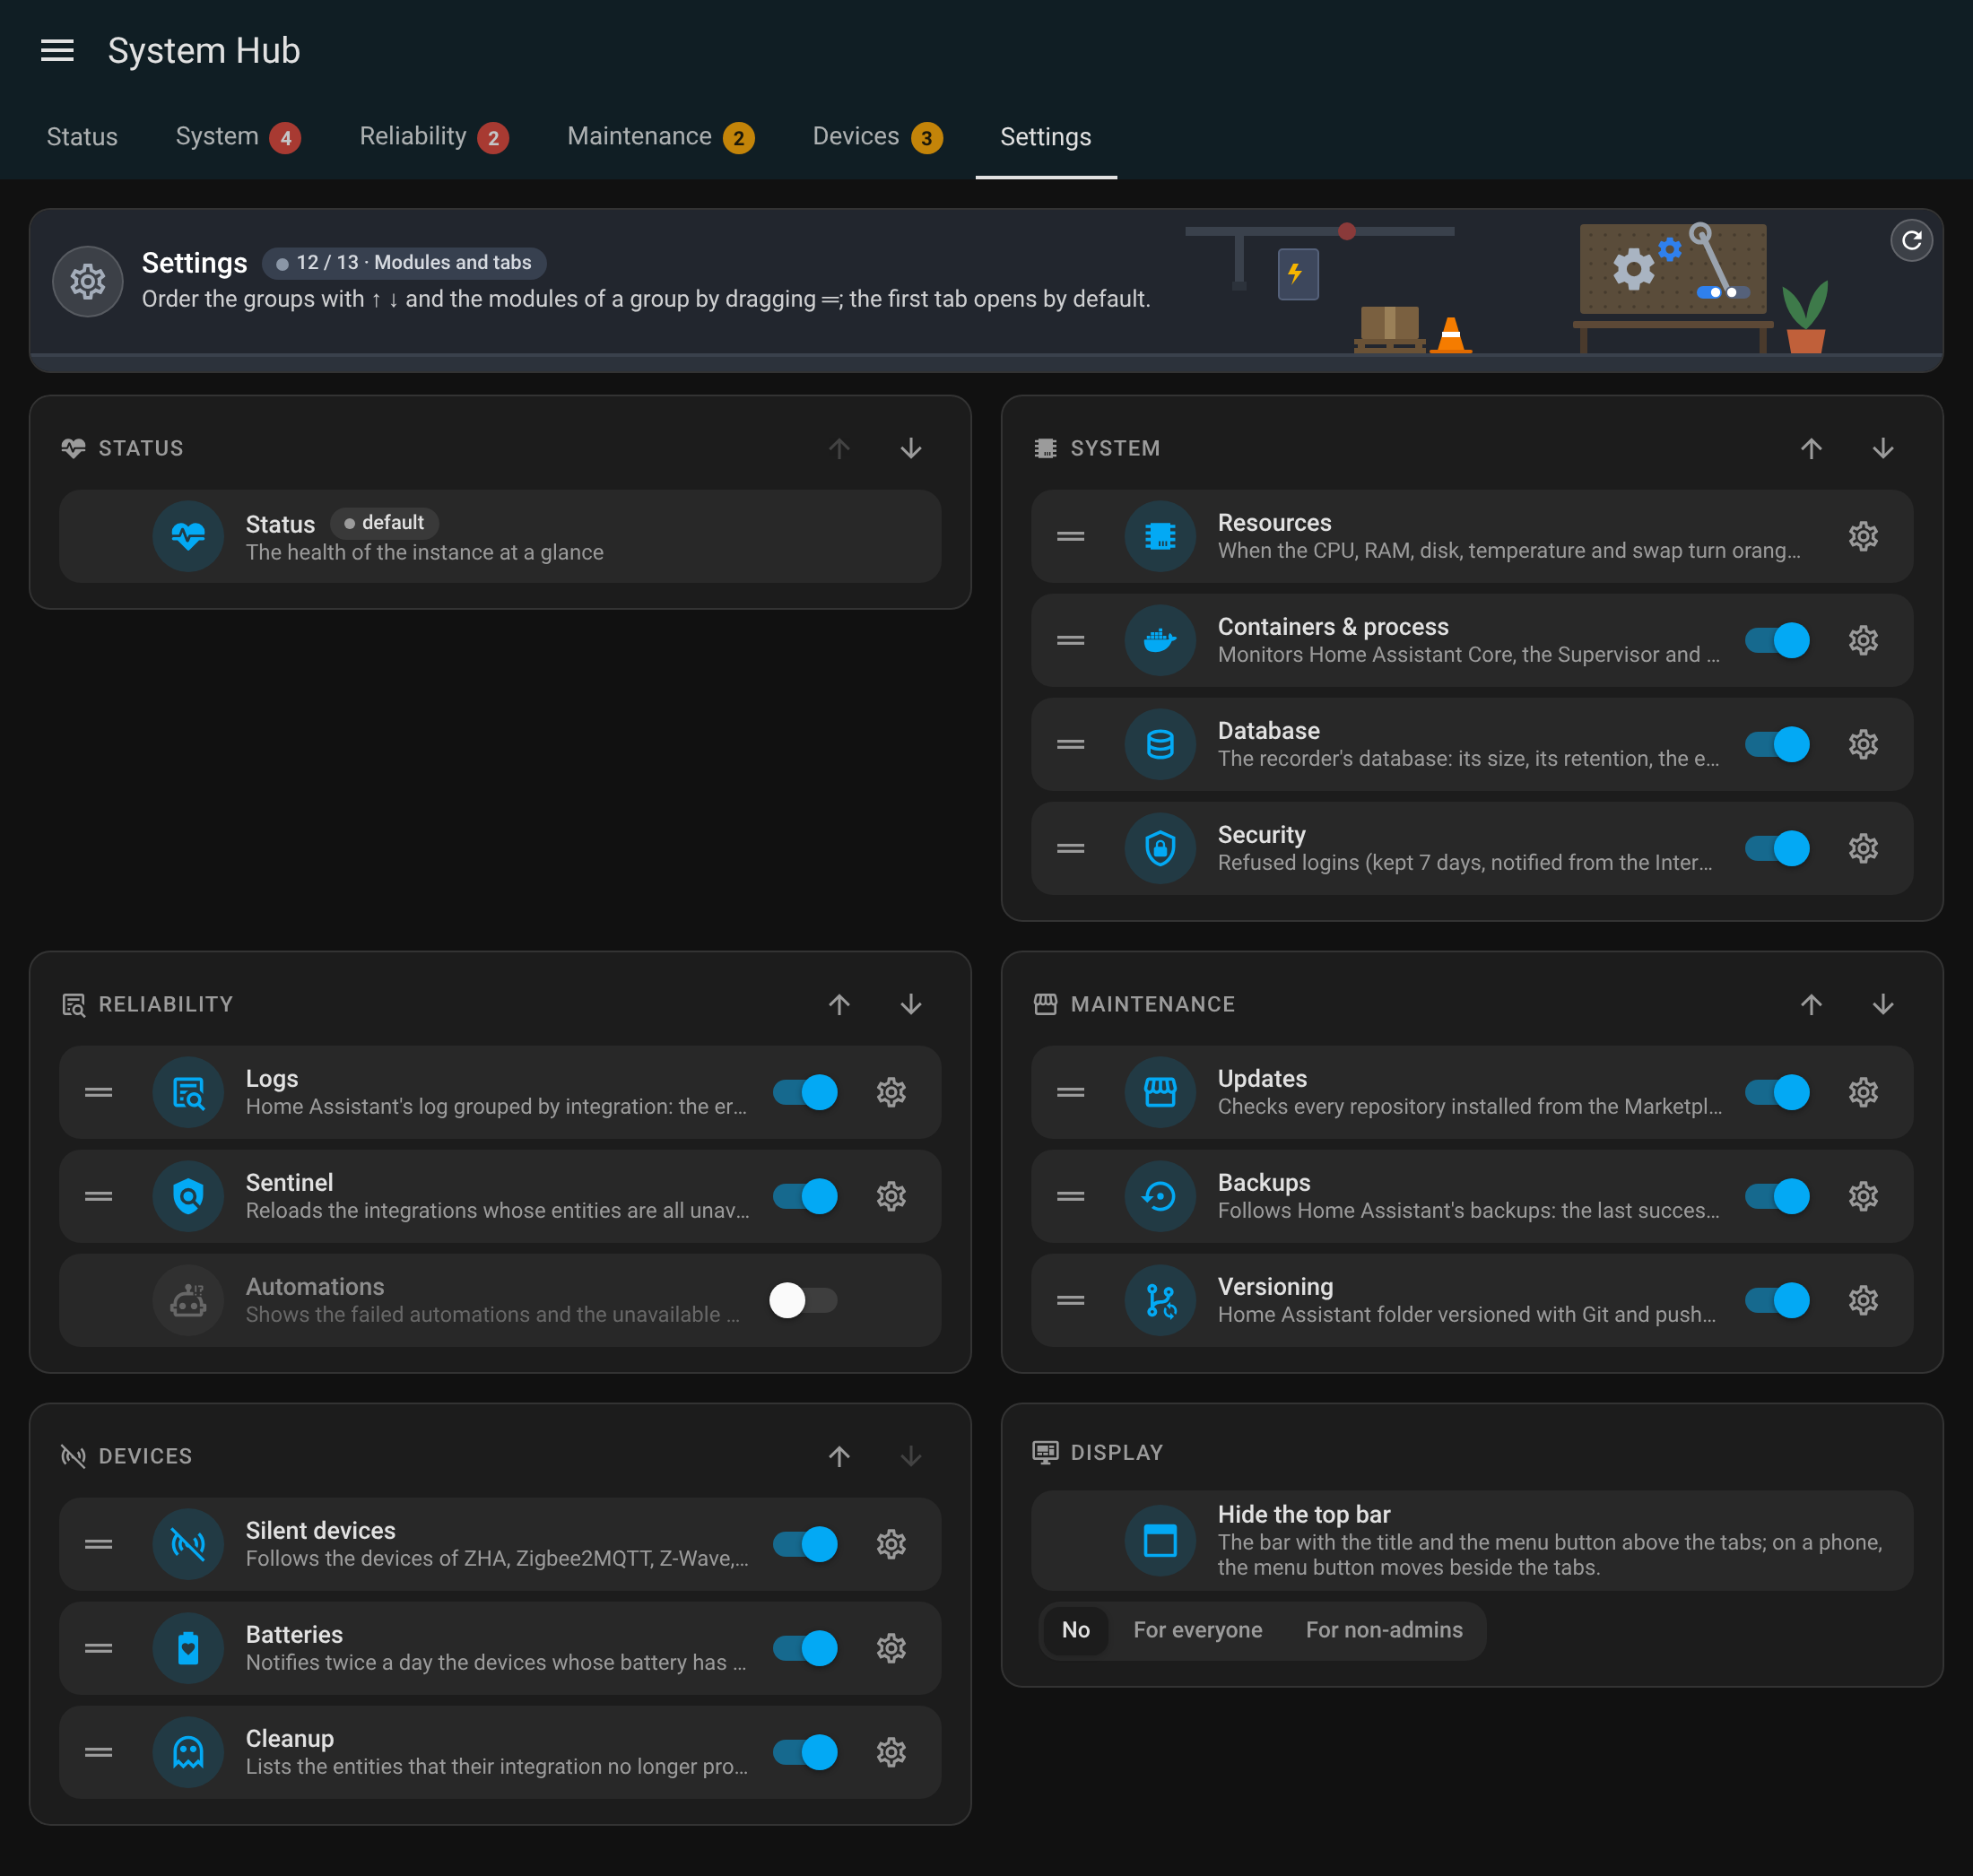
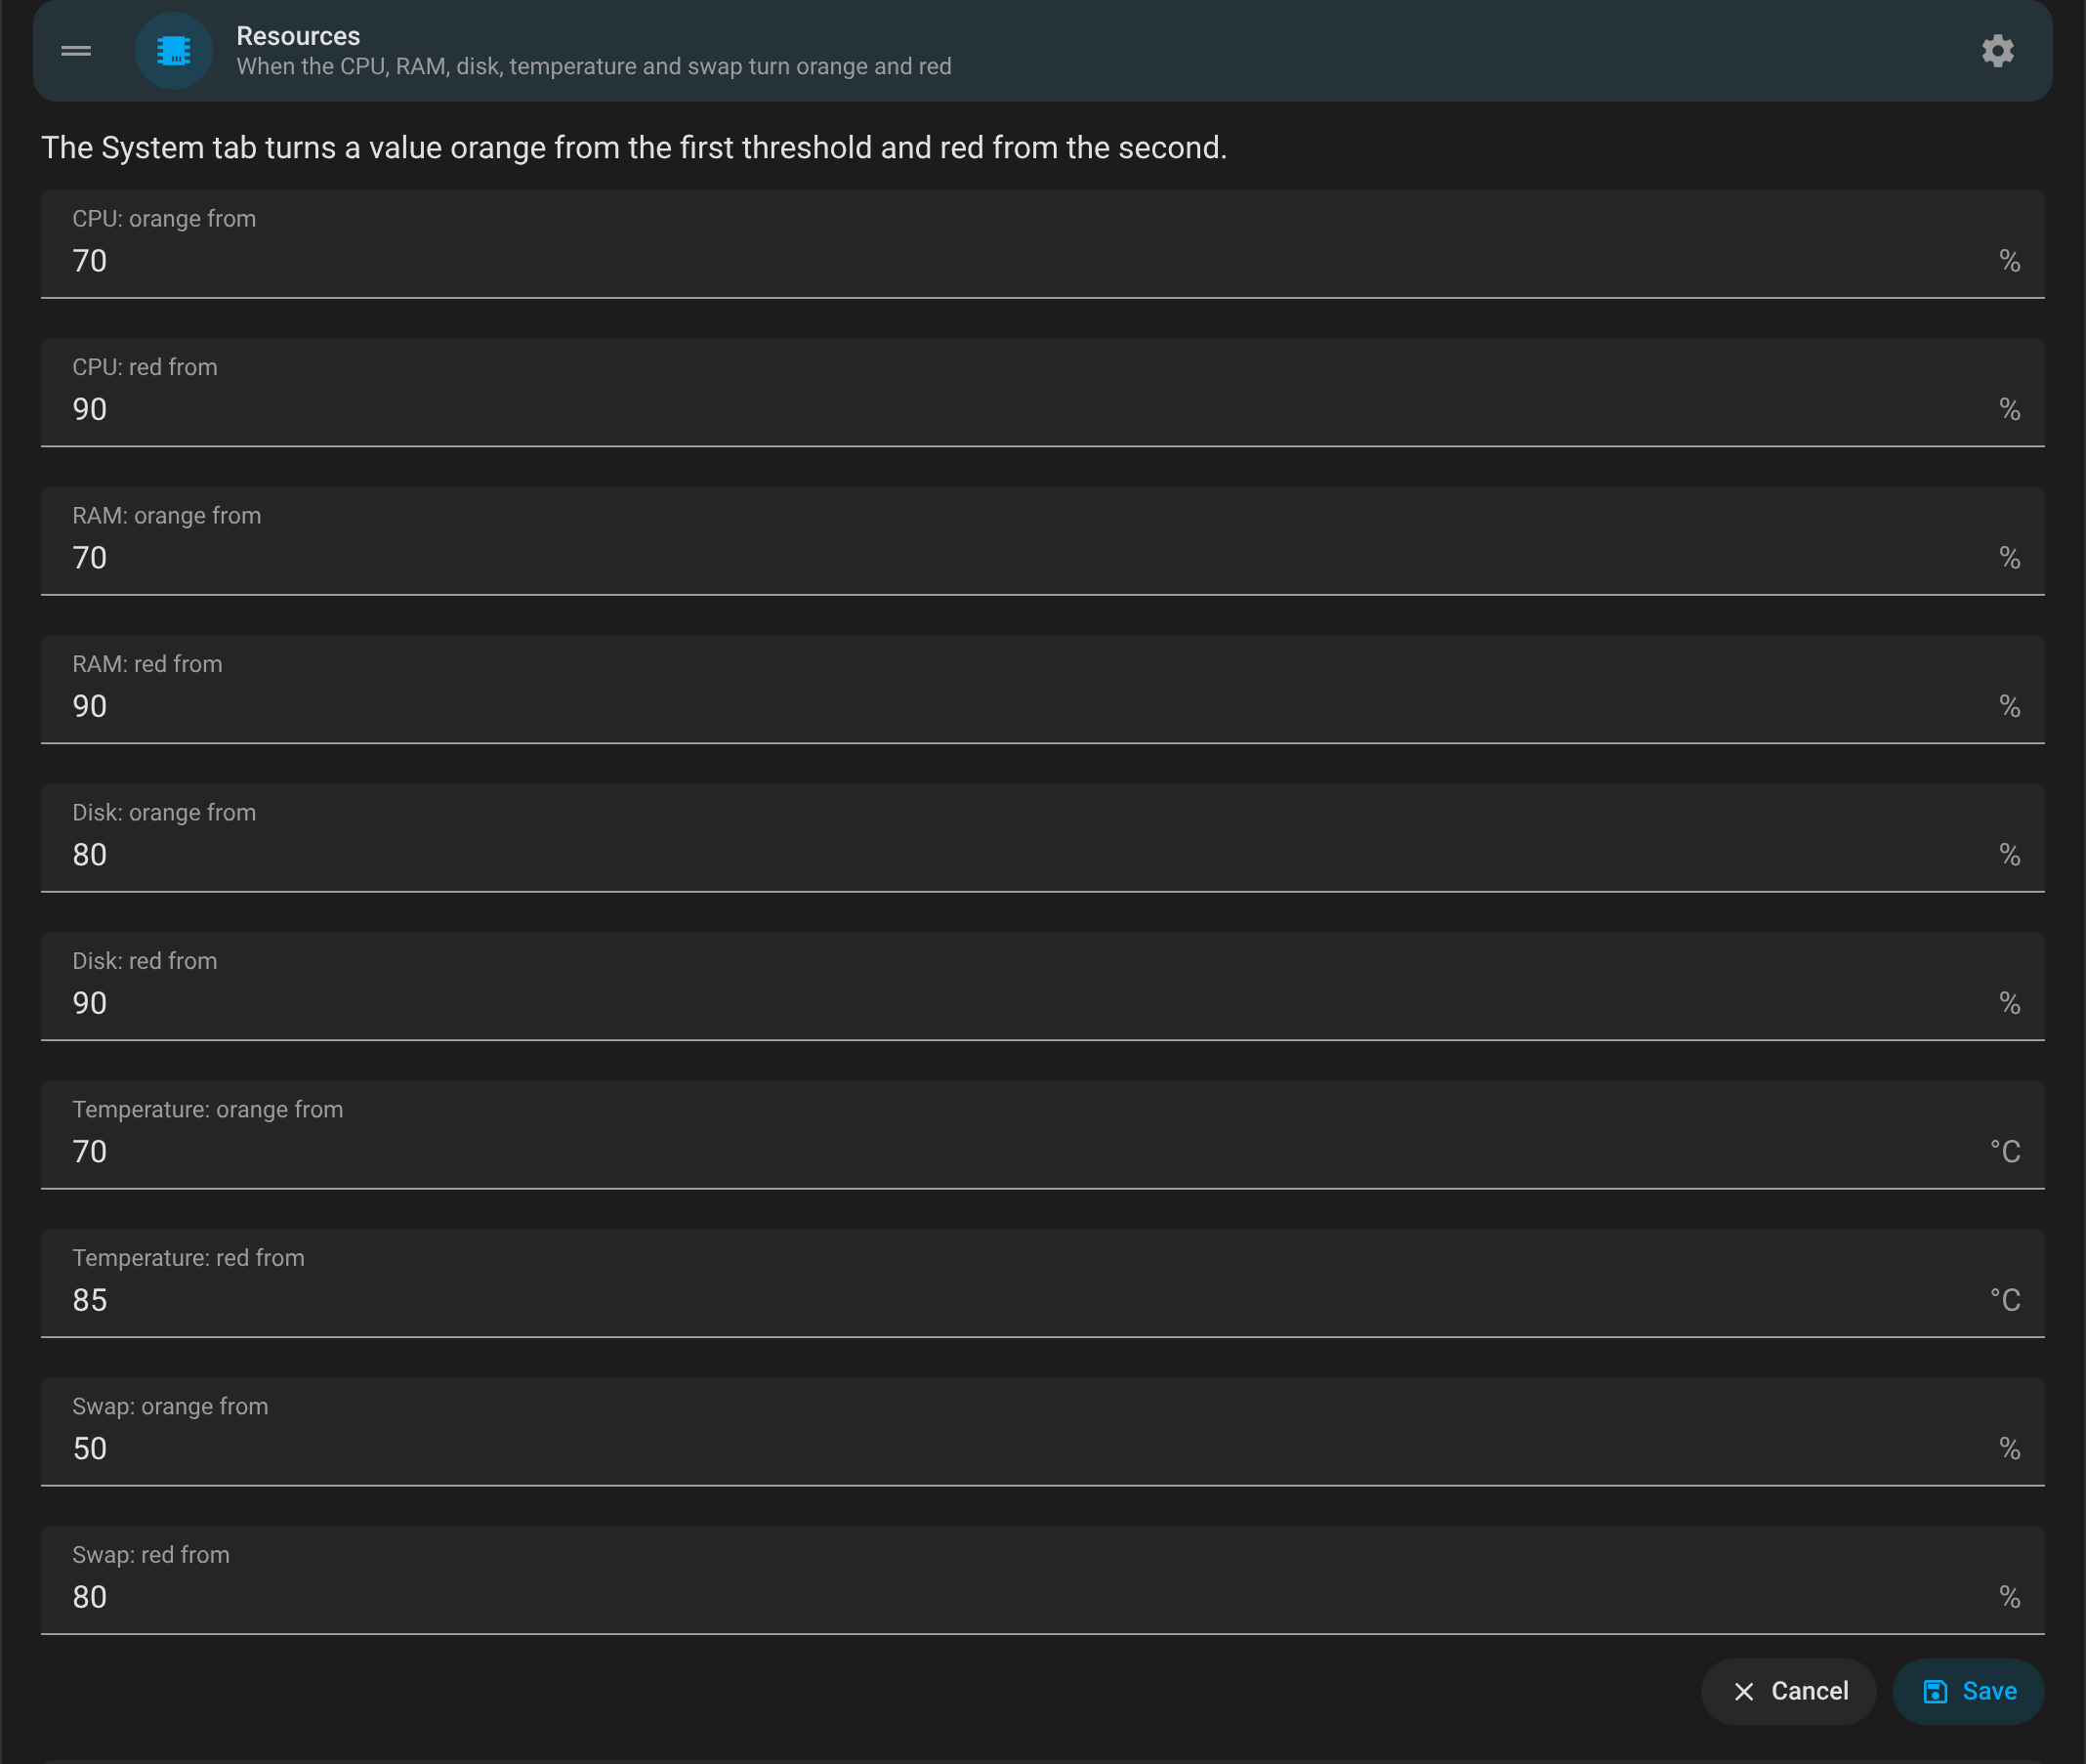
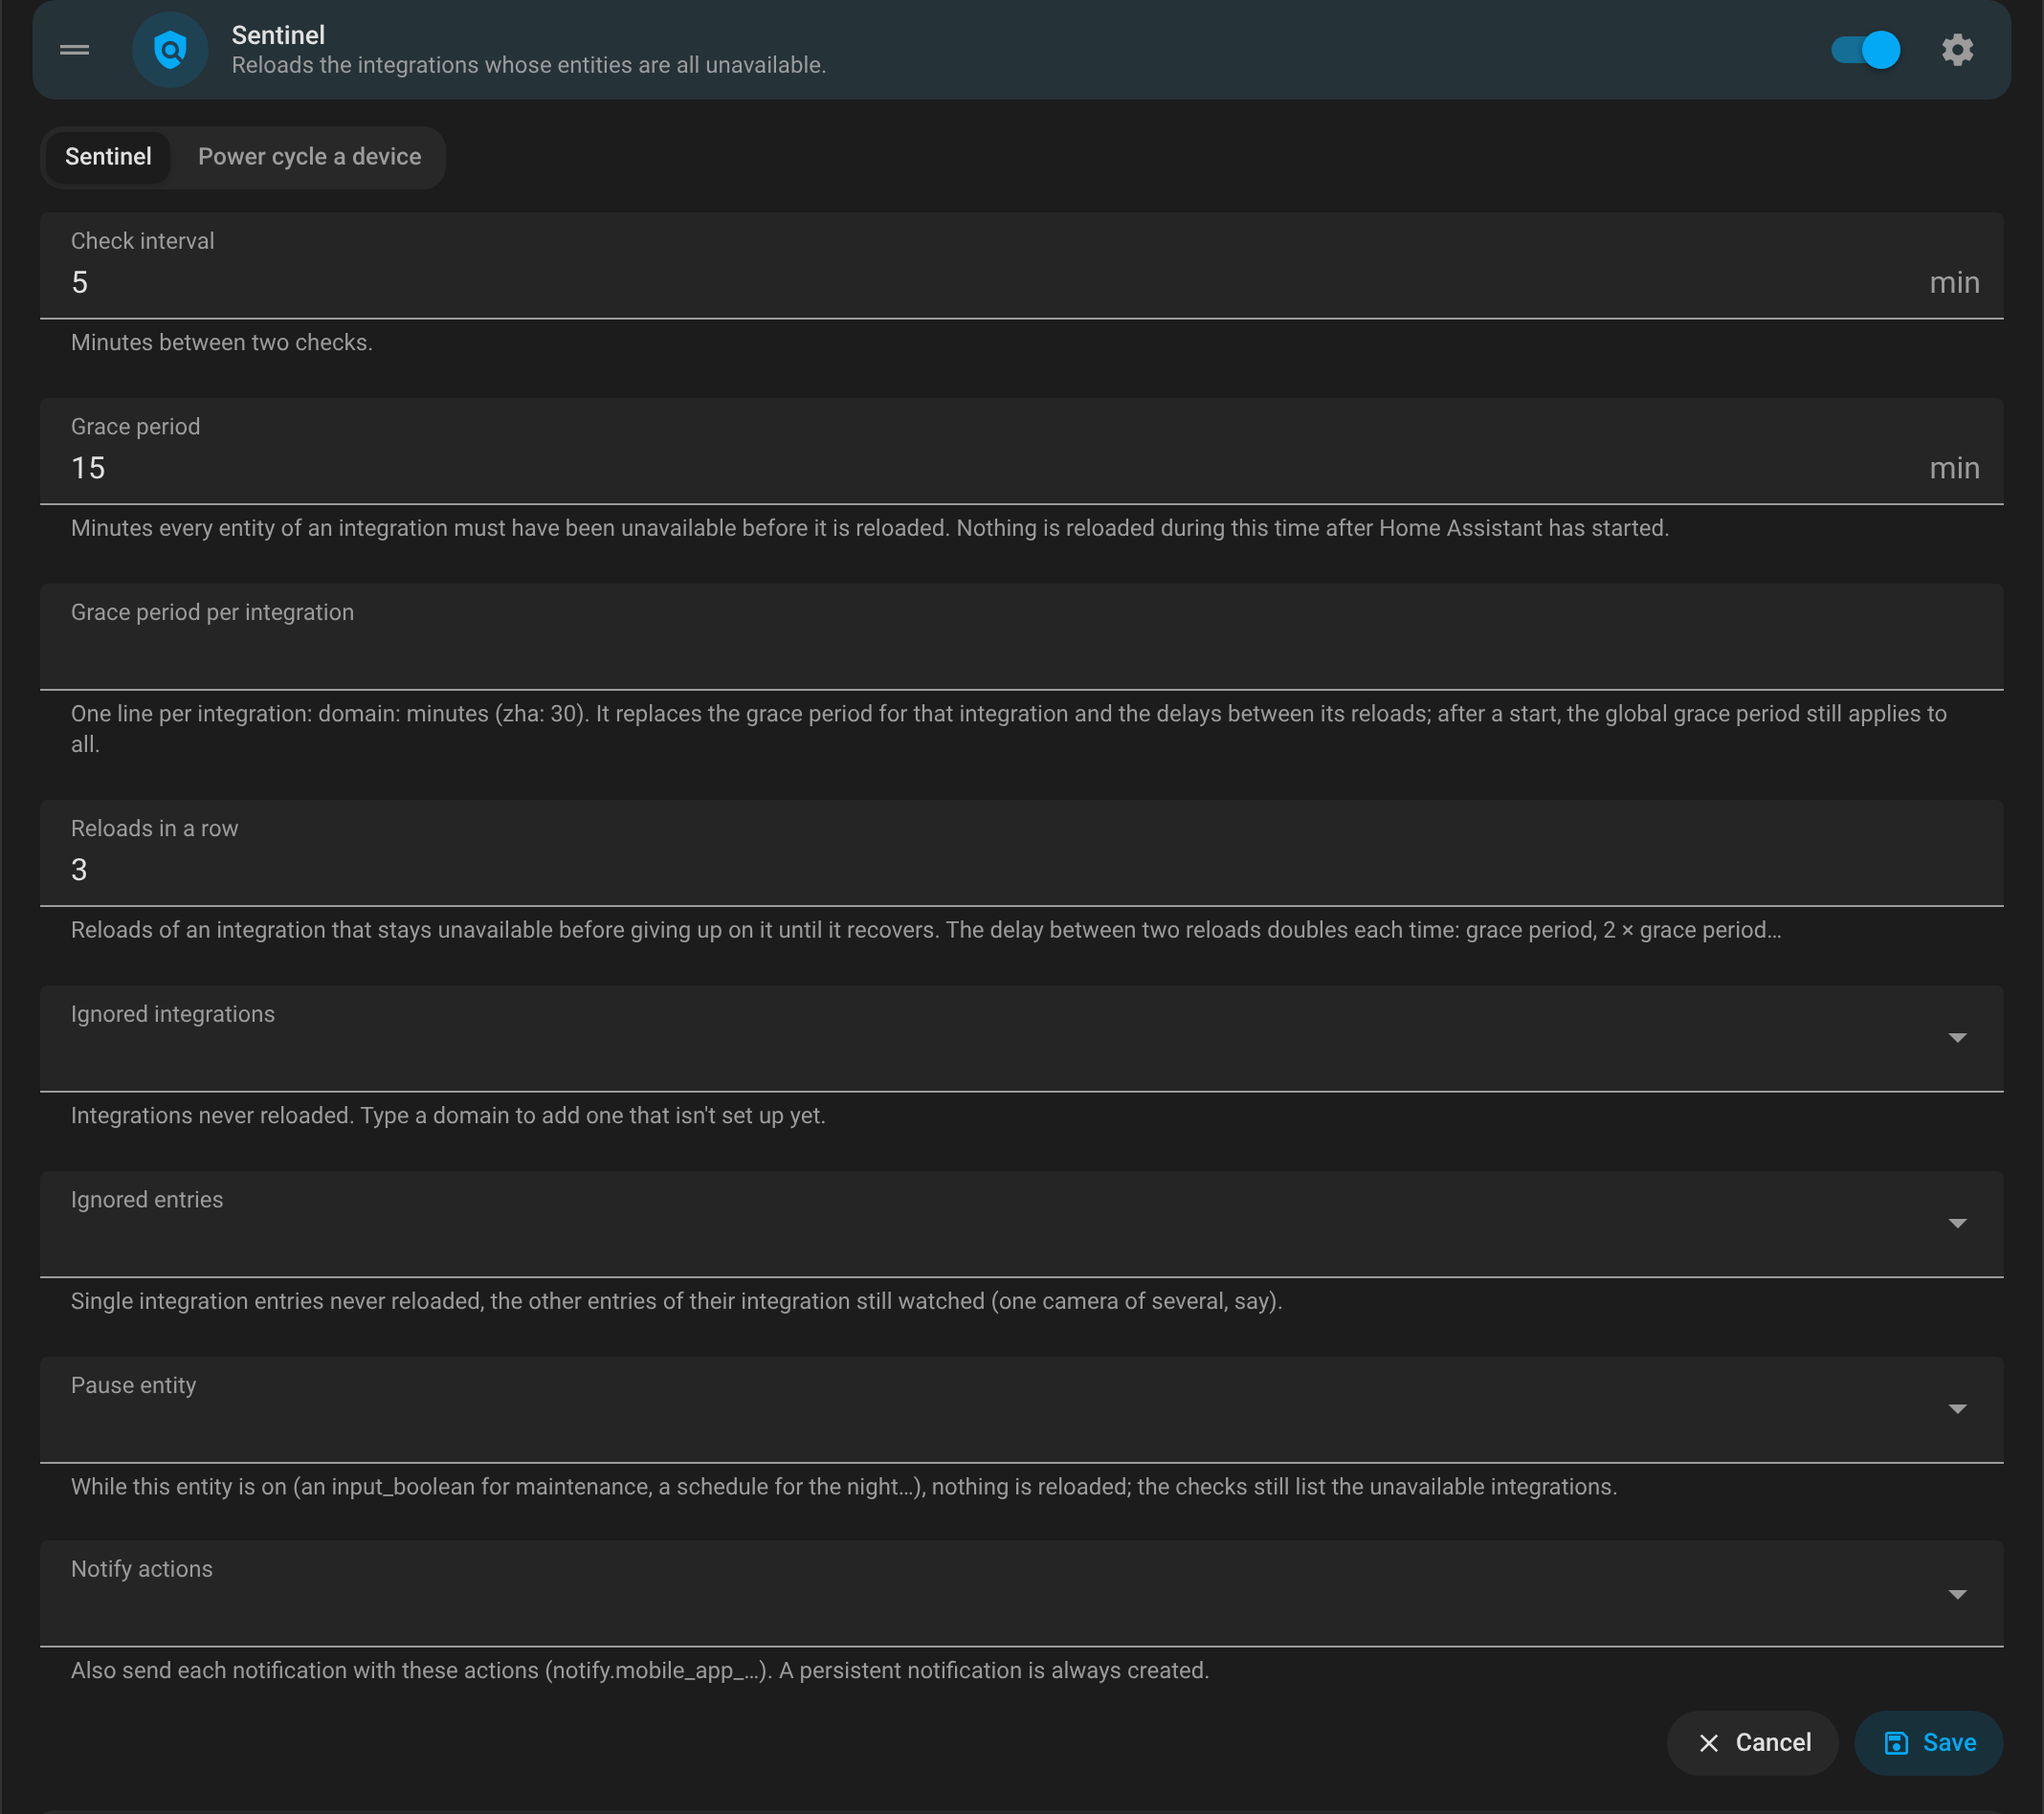
The Settings tab lists the modules and the tabs: Enabled then Disabled, a handle ═ to drag a row (or ↑ ↓ from it) to set the order of the tabs, the first one opening by default, and a switch per module; Save or Discard once changed. A module's ⚙ opens its settings in place (the System thresholds in the System row), with its further steps: the power cycles of the Watchdog, the battery types and the import from Battery Monitor, the Git repository. They are Home Assistant's own forms, with the same checks as the integration's options; Module settings in a module's tab opens its section.
| Light | Dark |
|---|---|
 |
 |
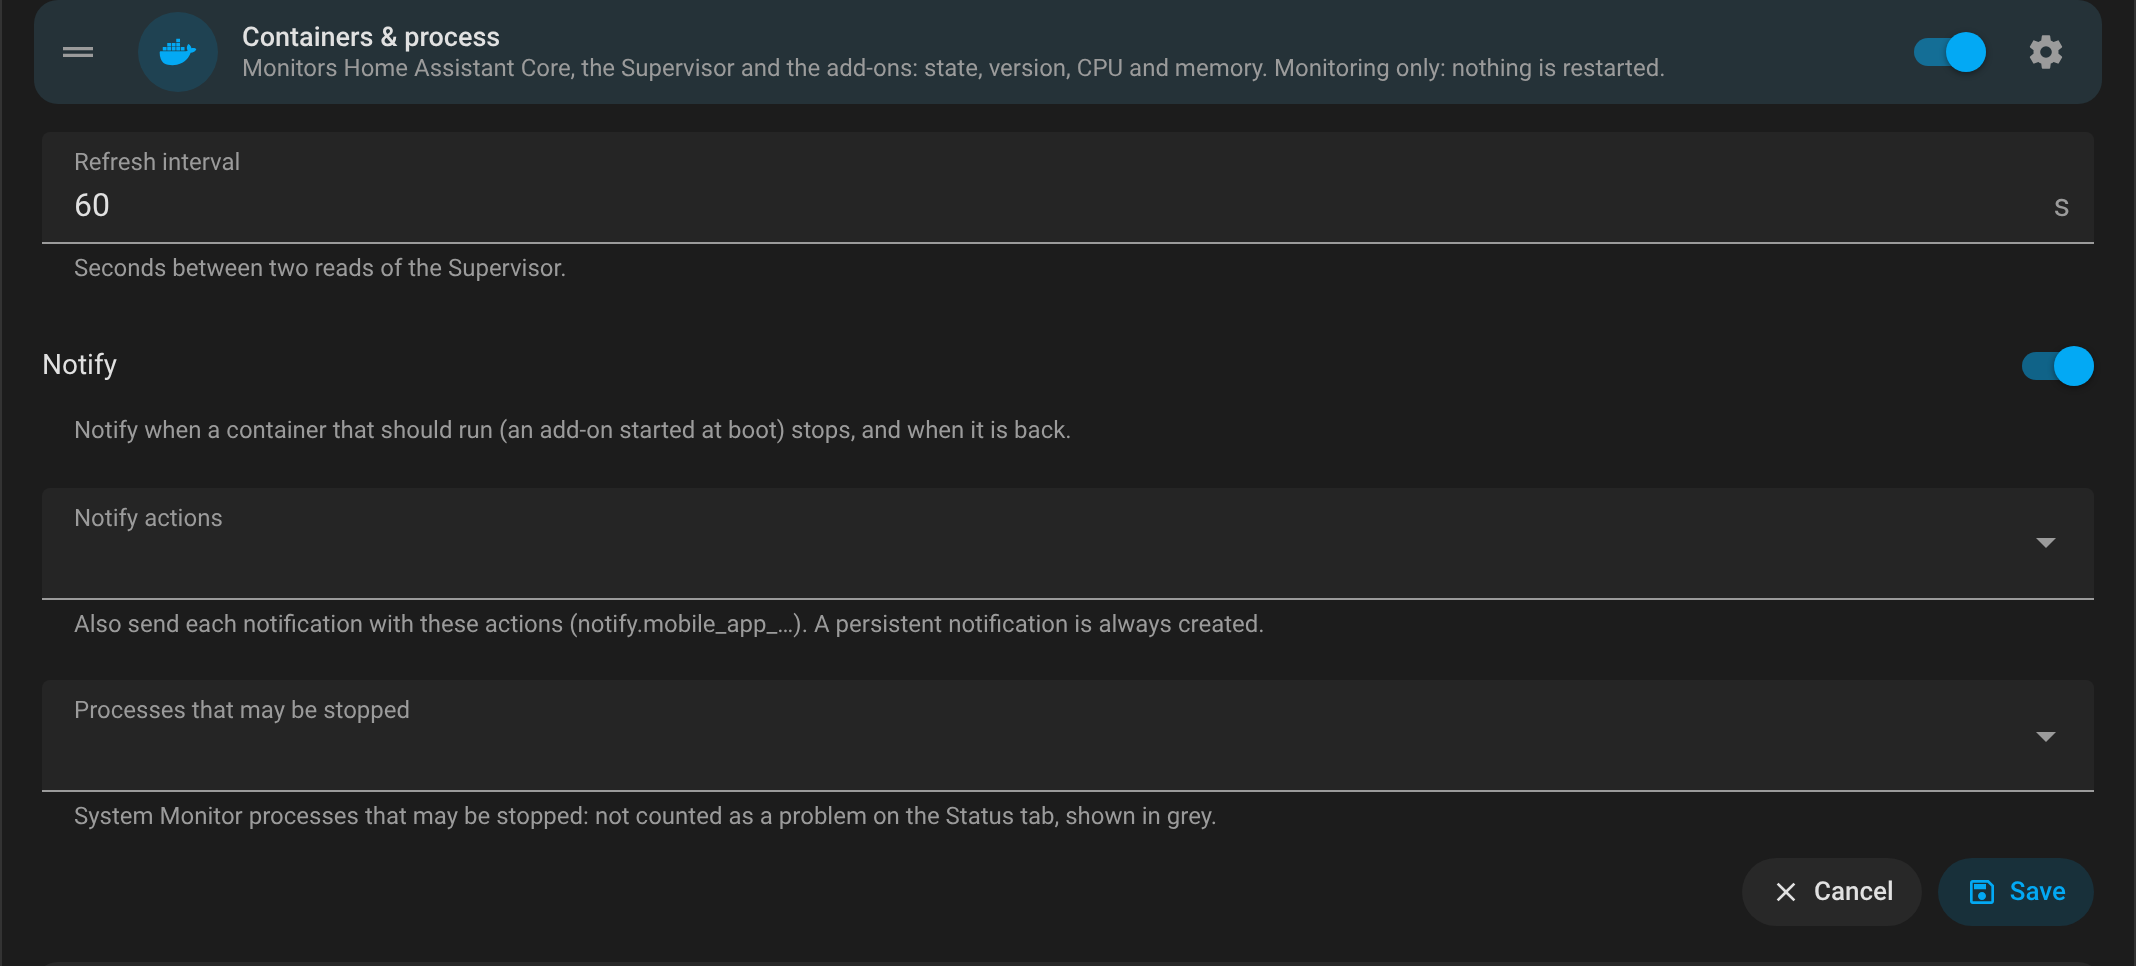
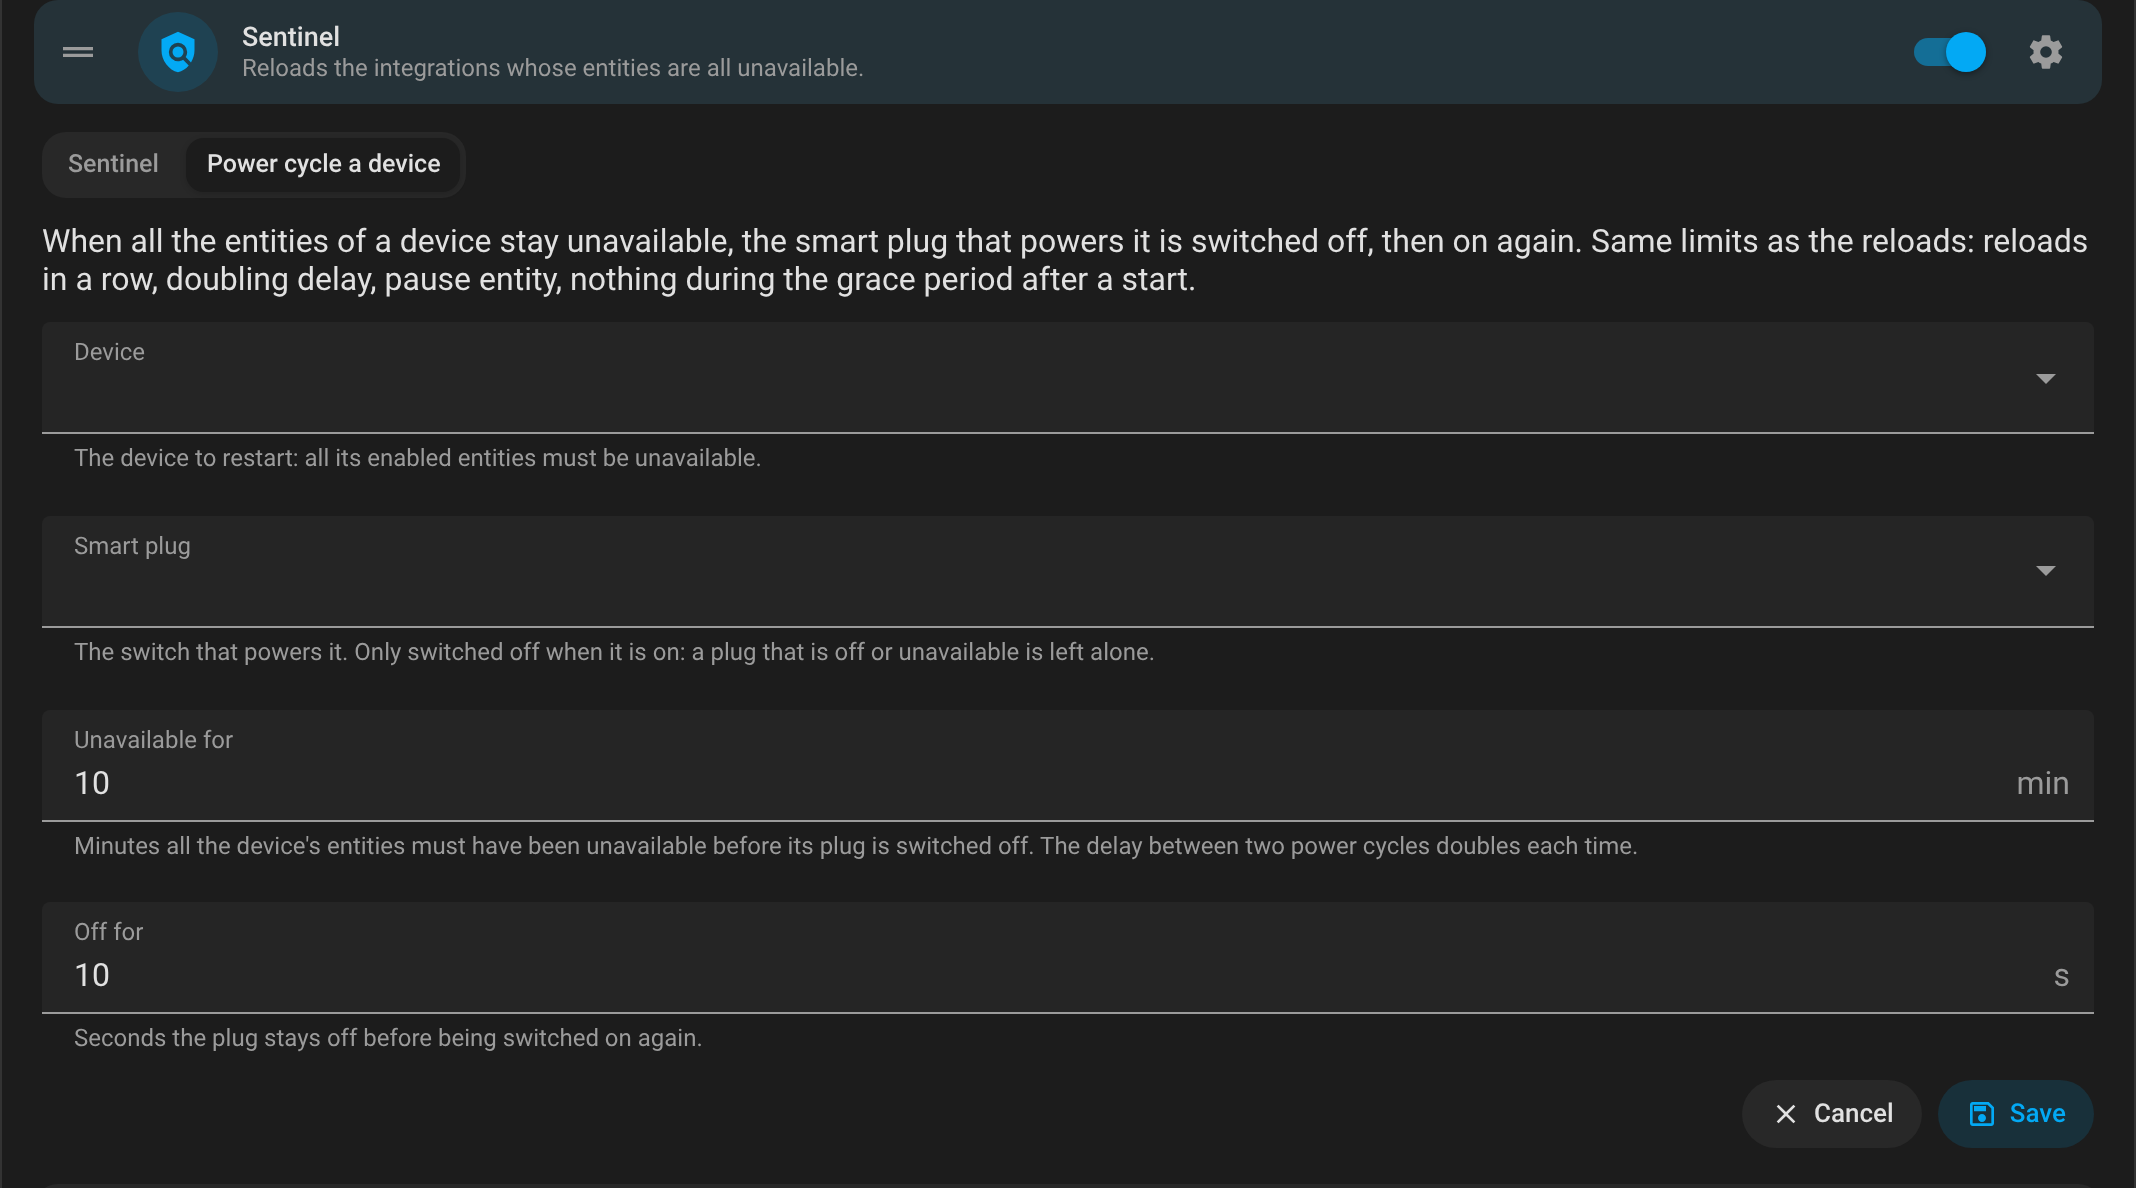
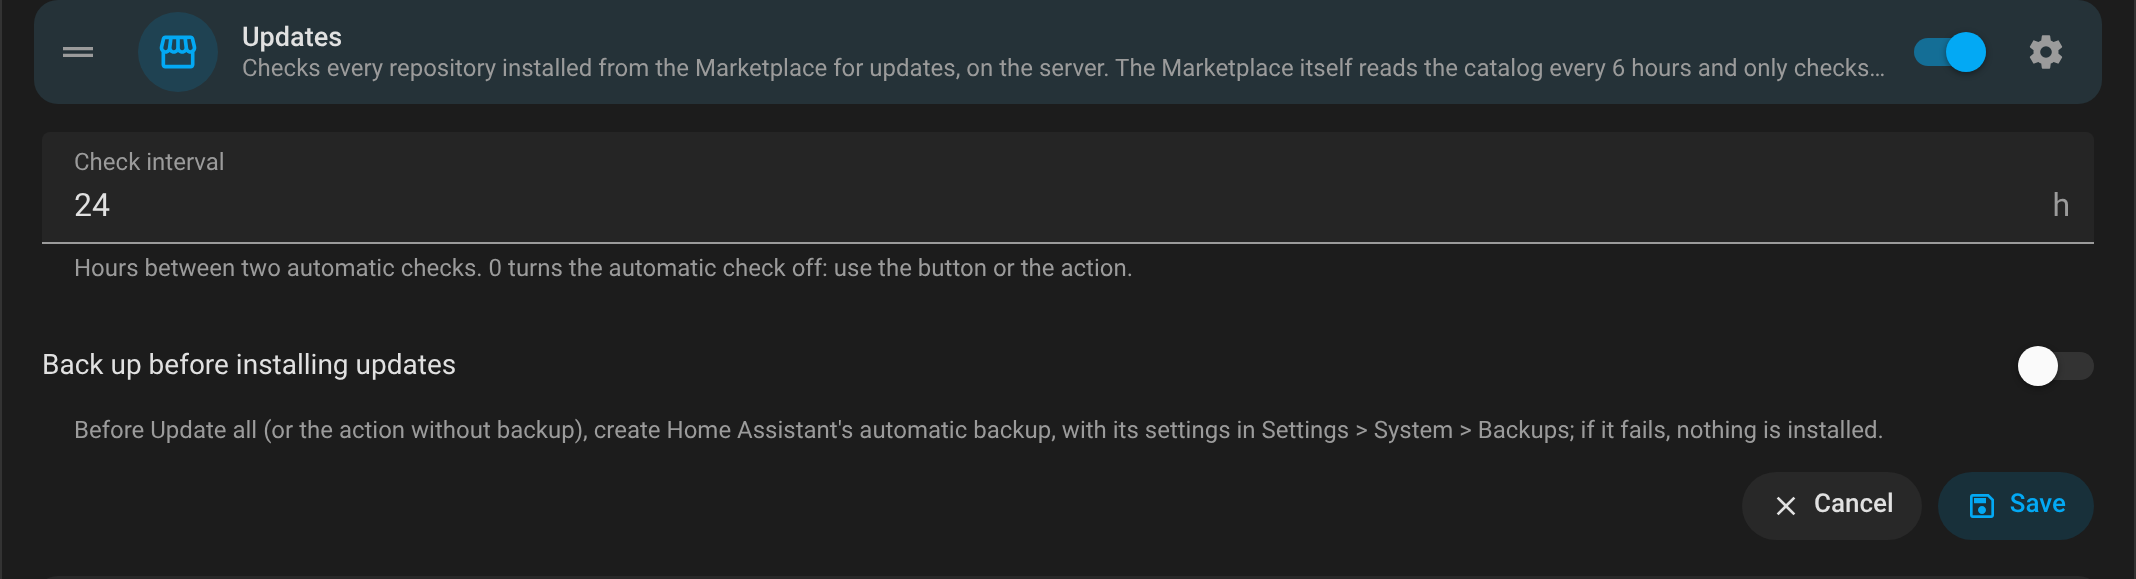
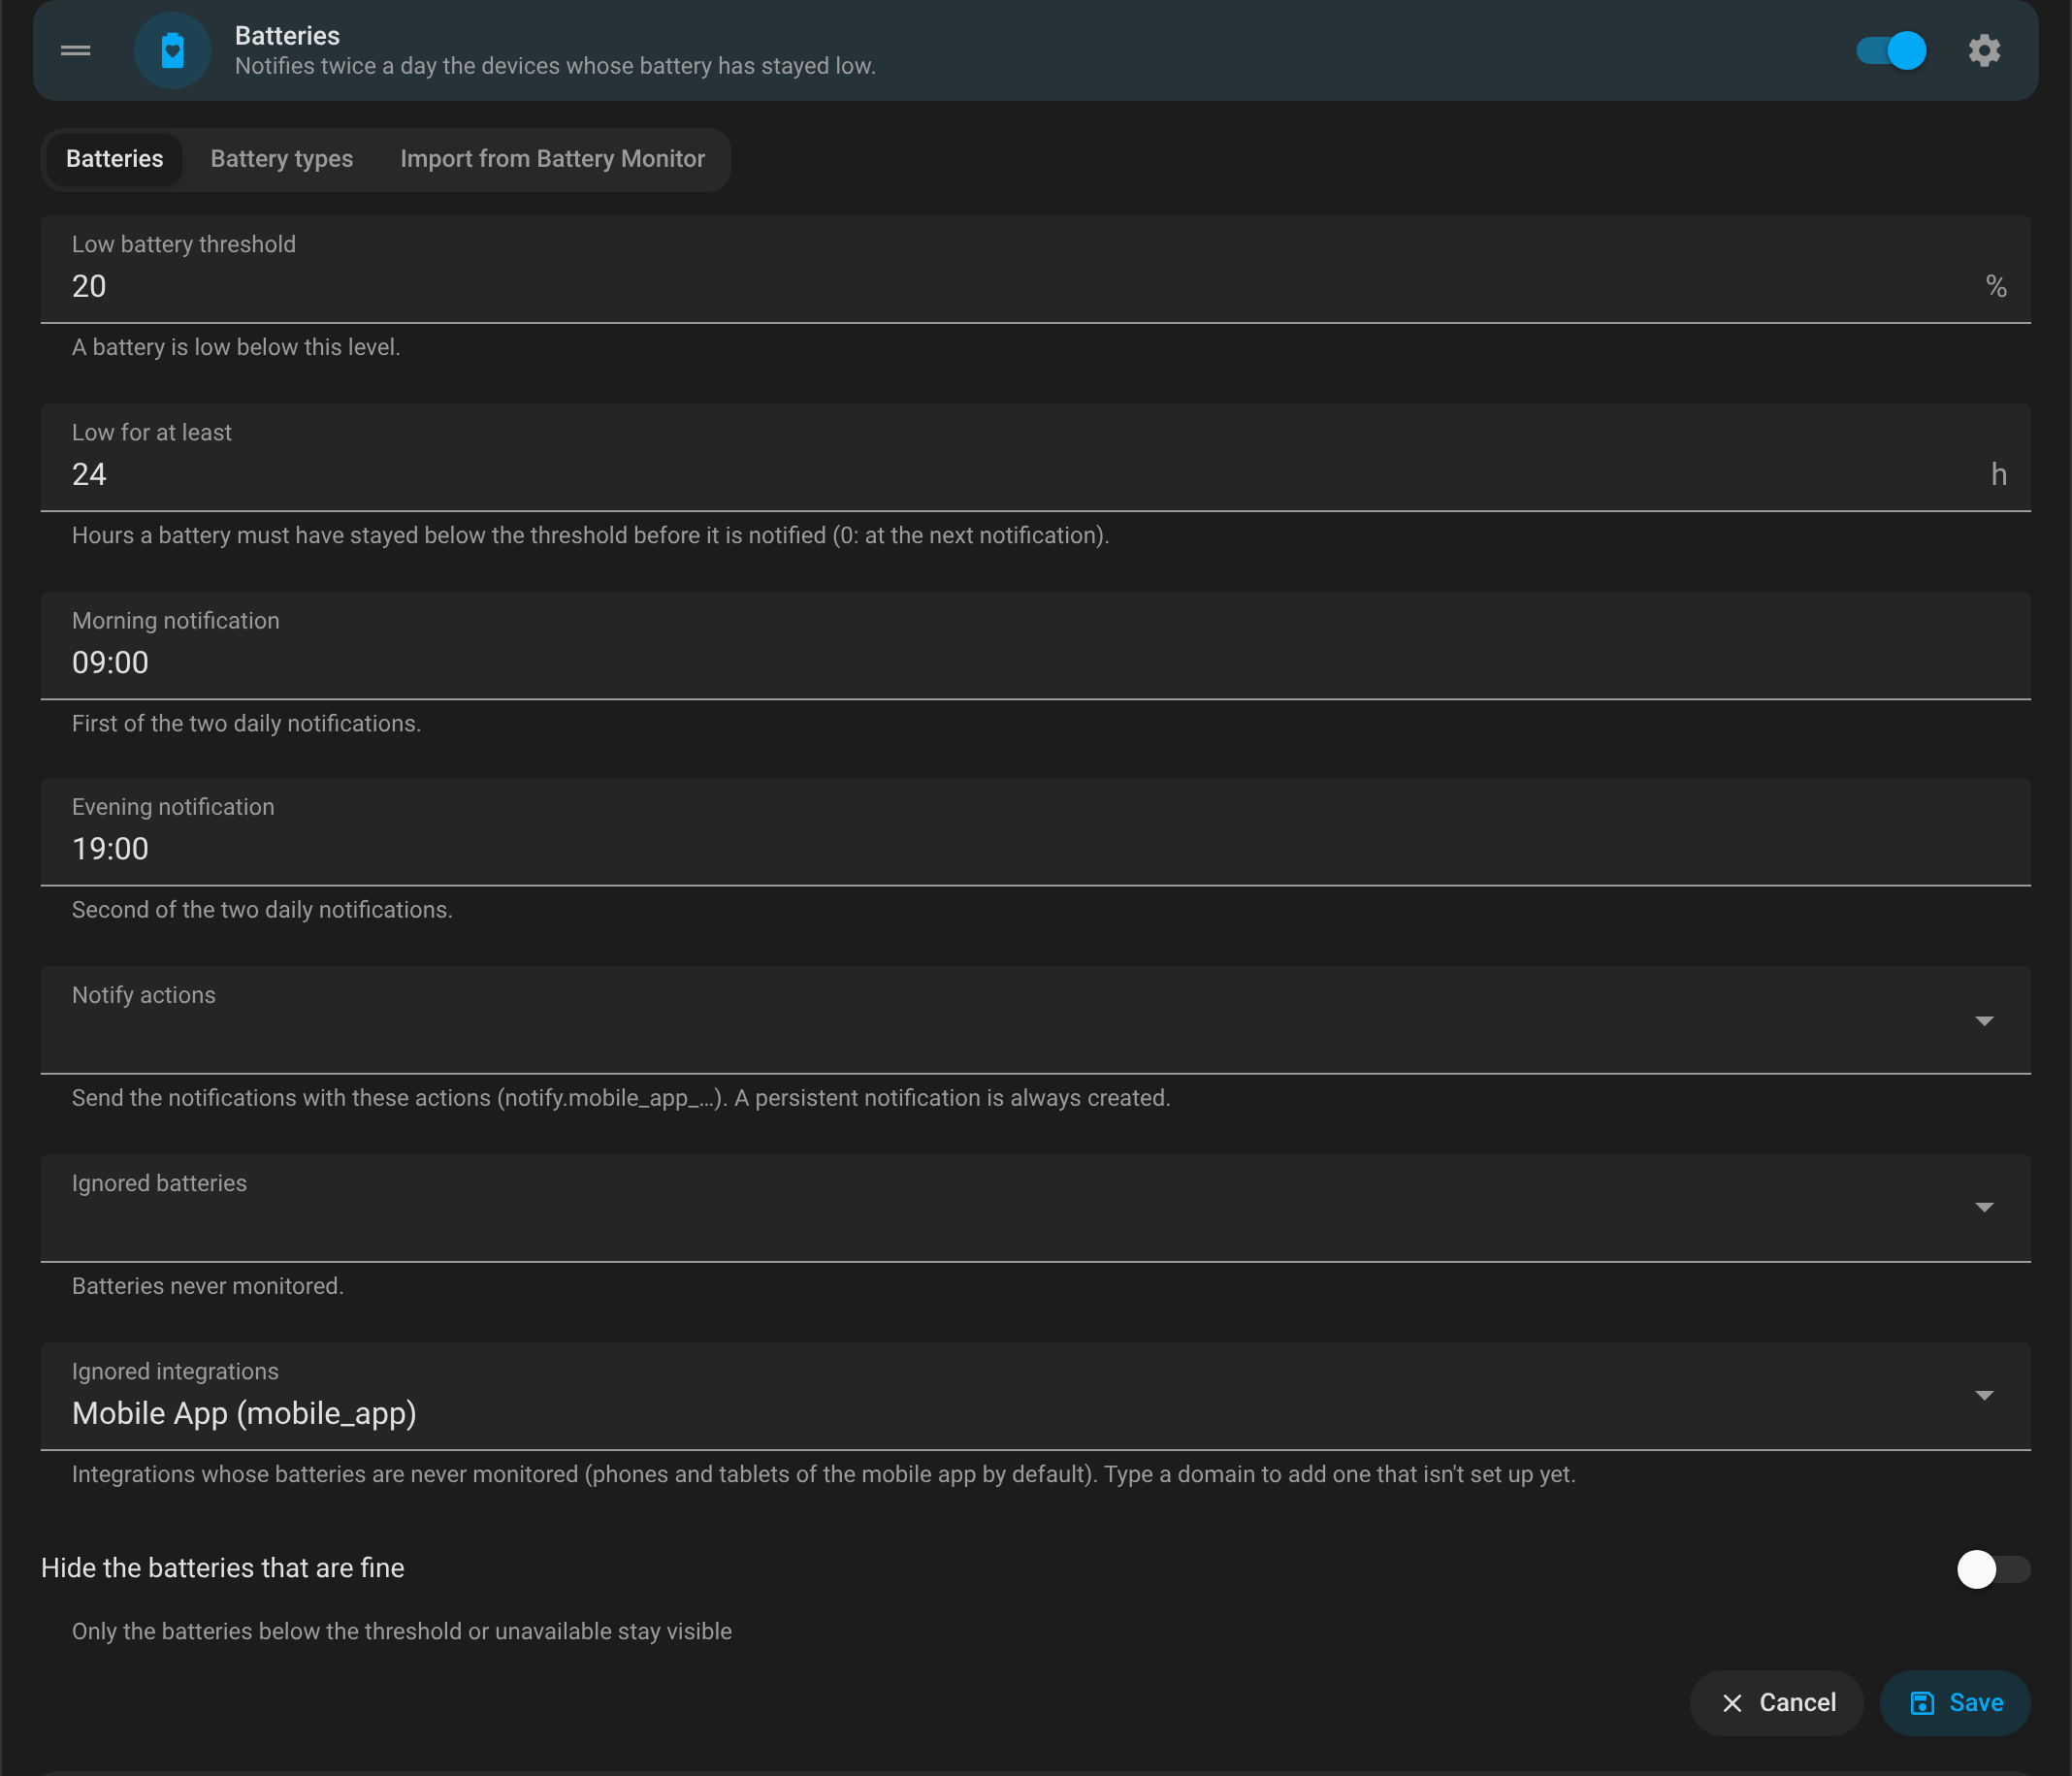
Each module's settings, opened in place:
| Settings | Light | Dark |
|---|---|---|
| System thresholds | 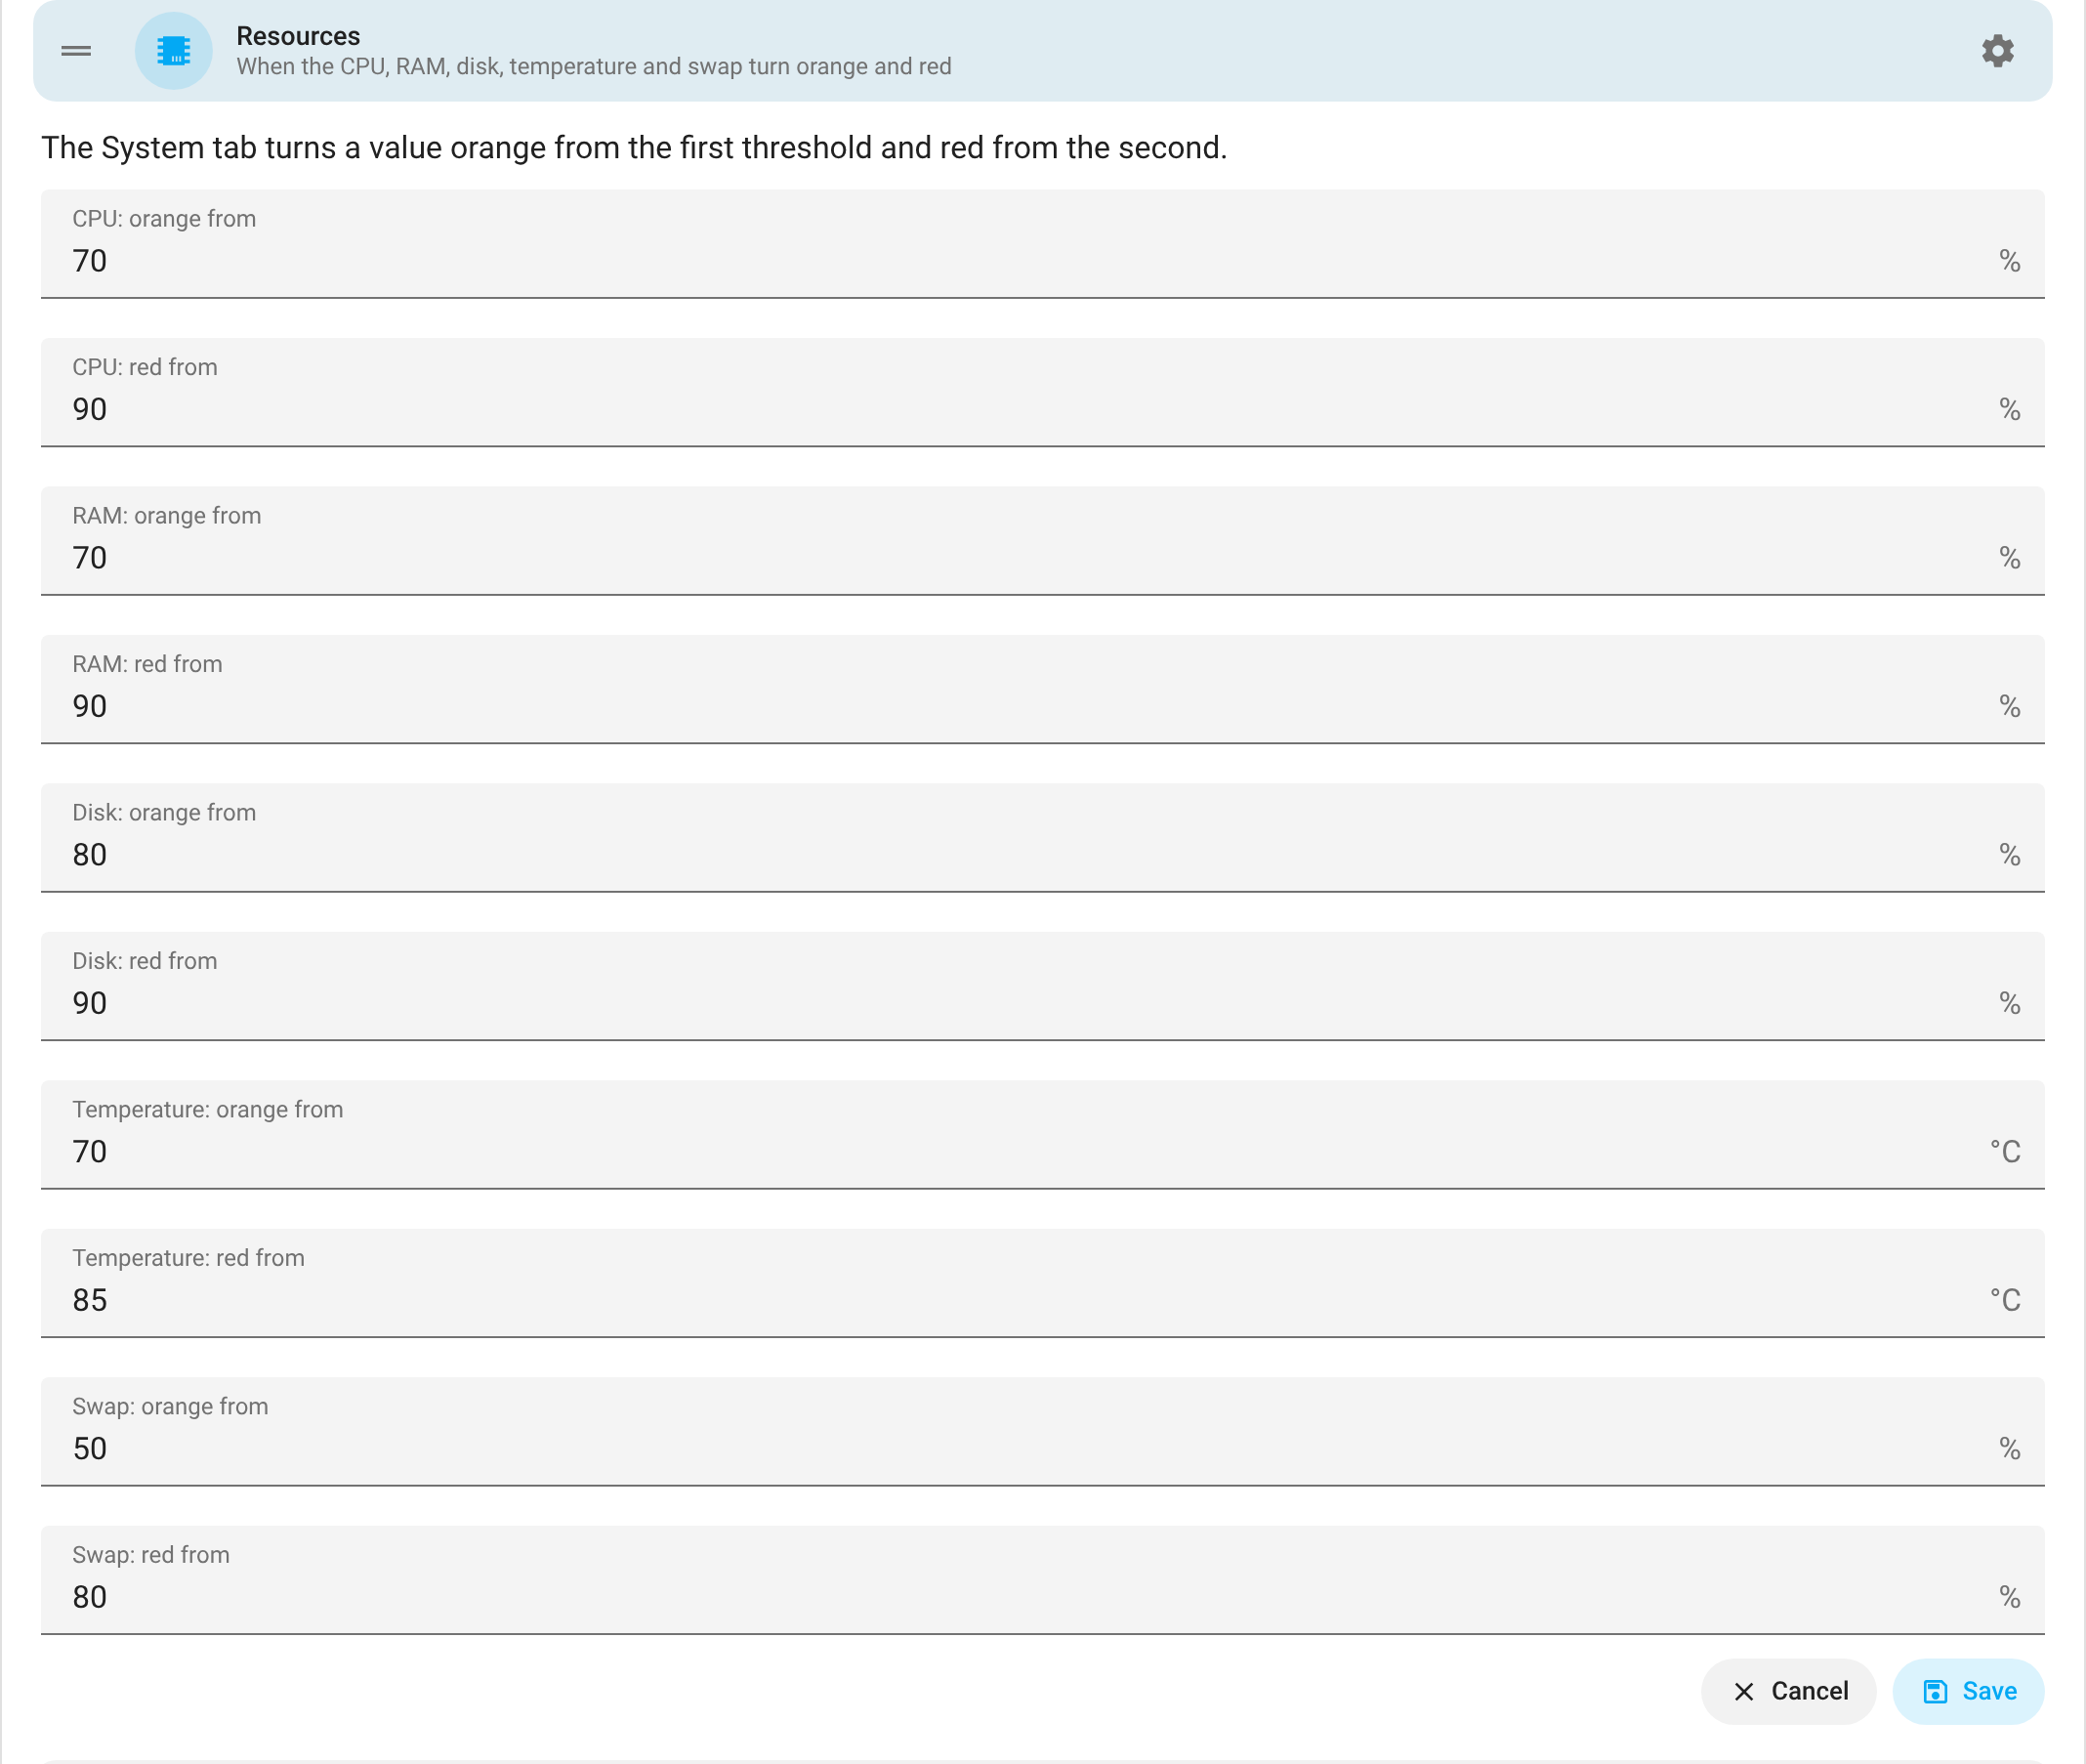 |
 |
| Containers | 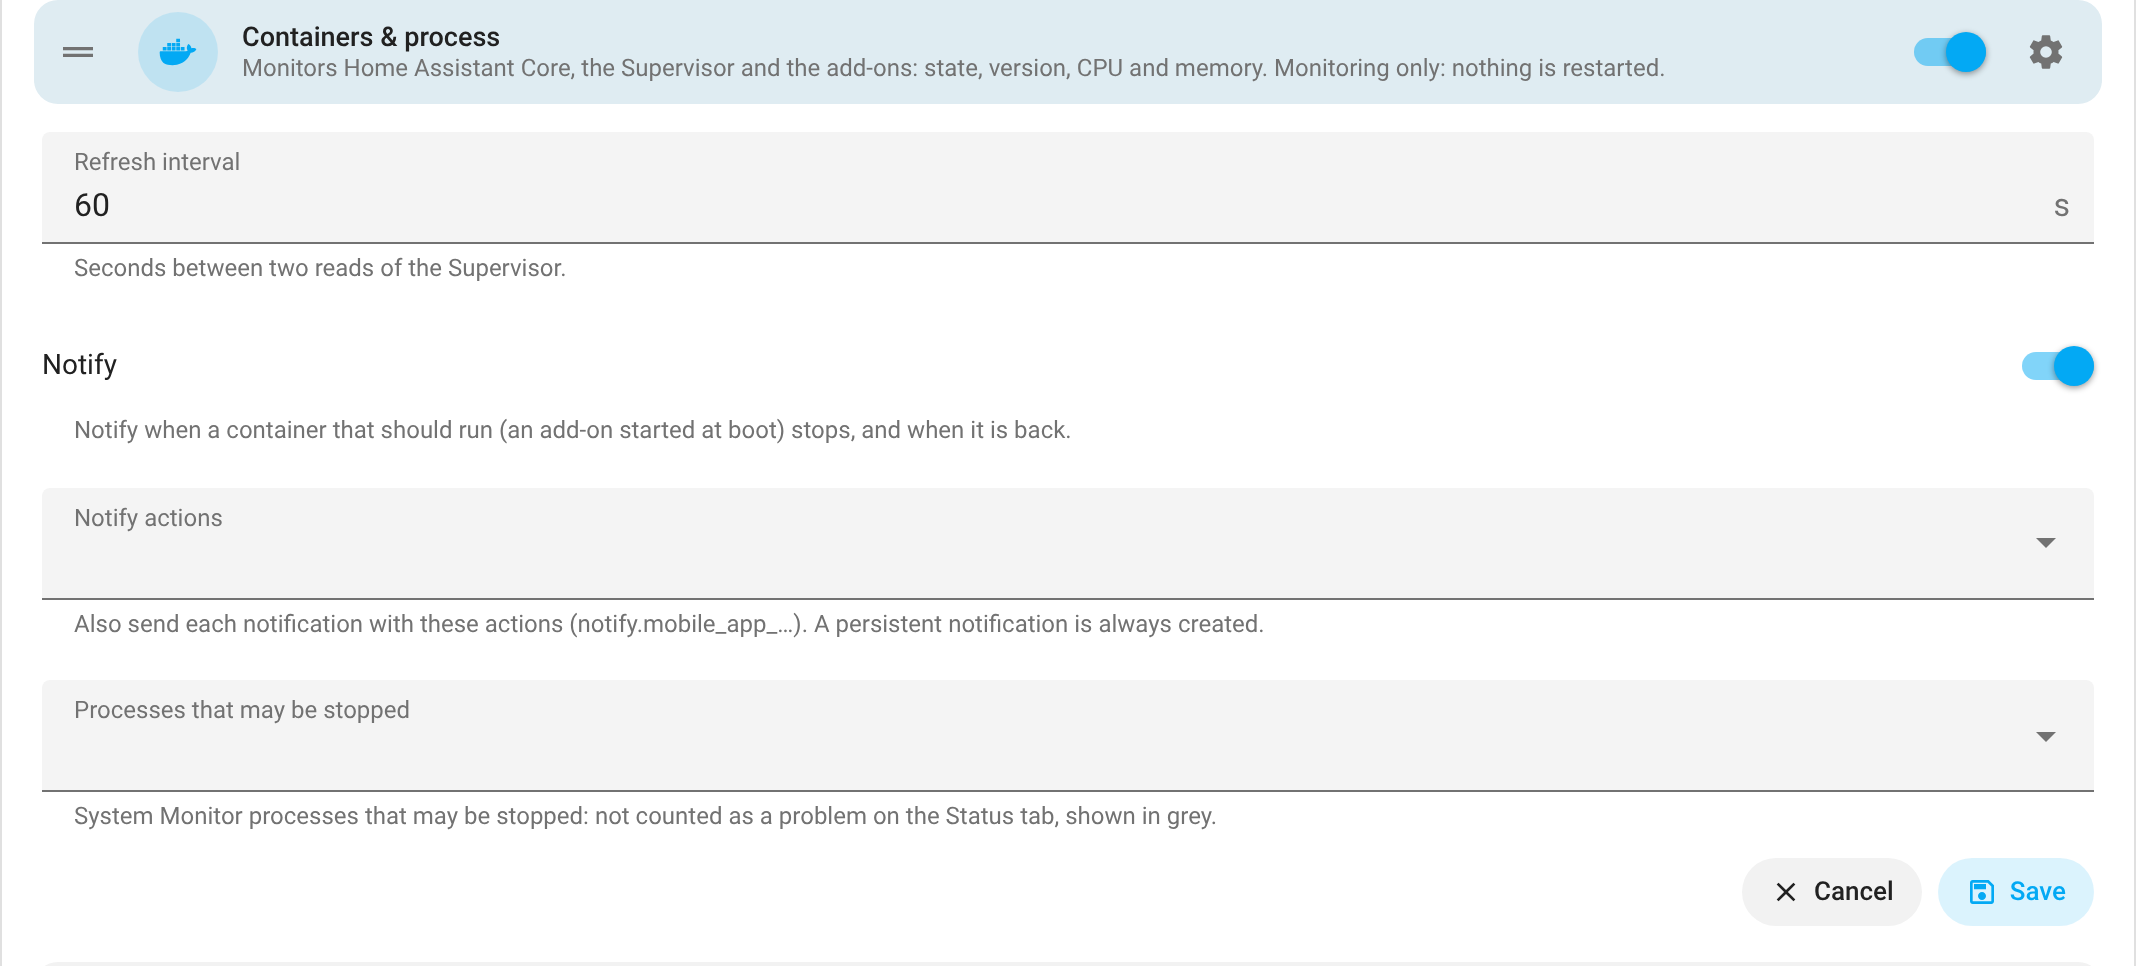 |
 |
| Watchdog | 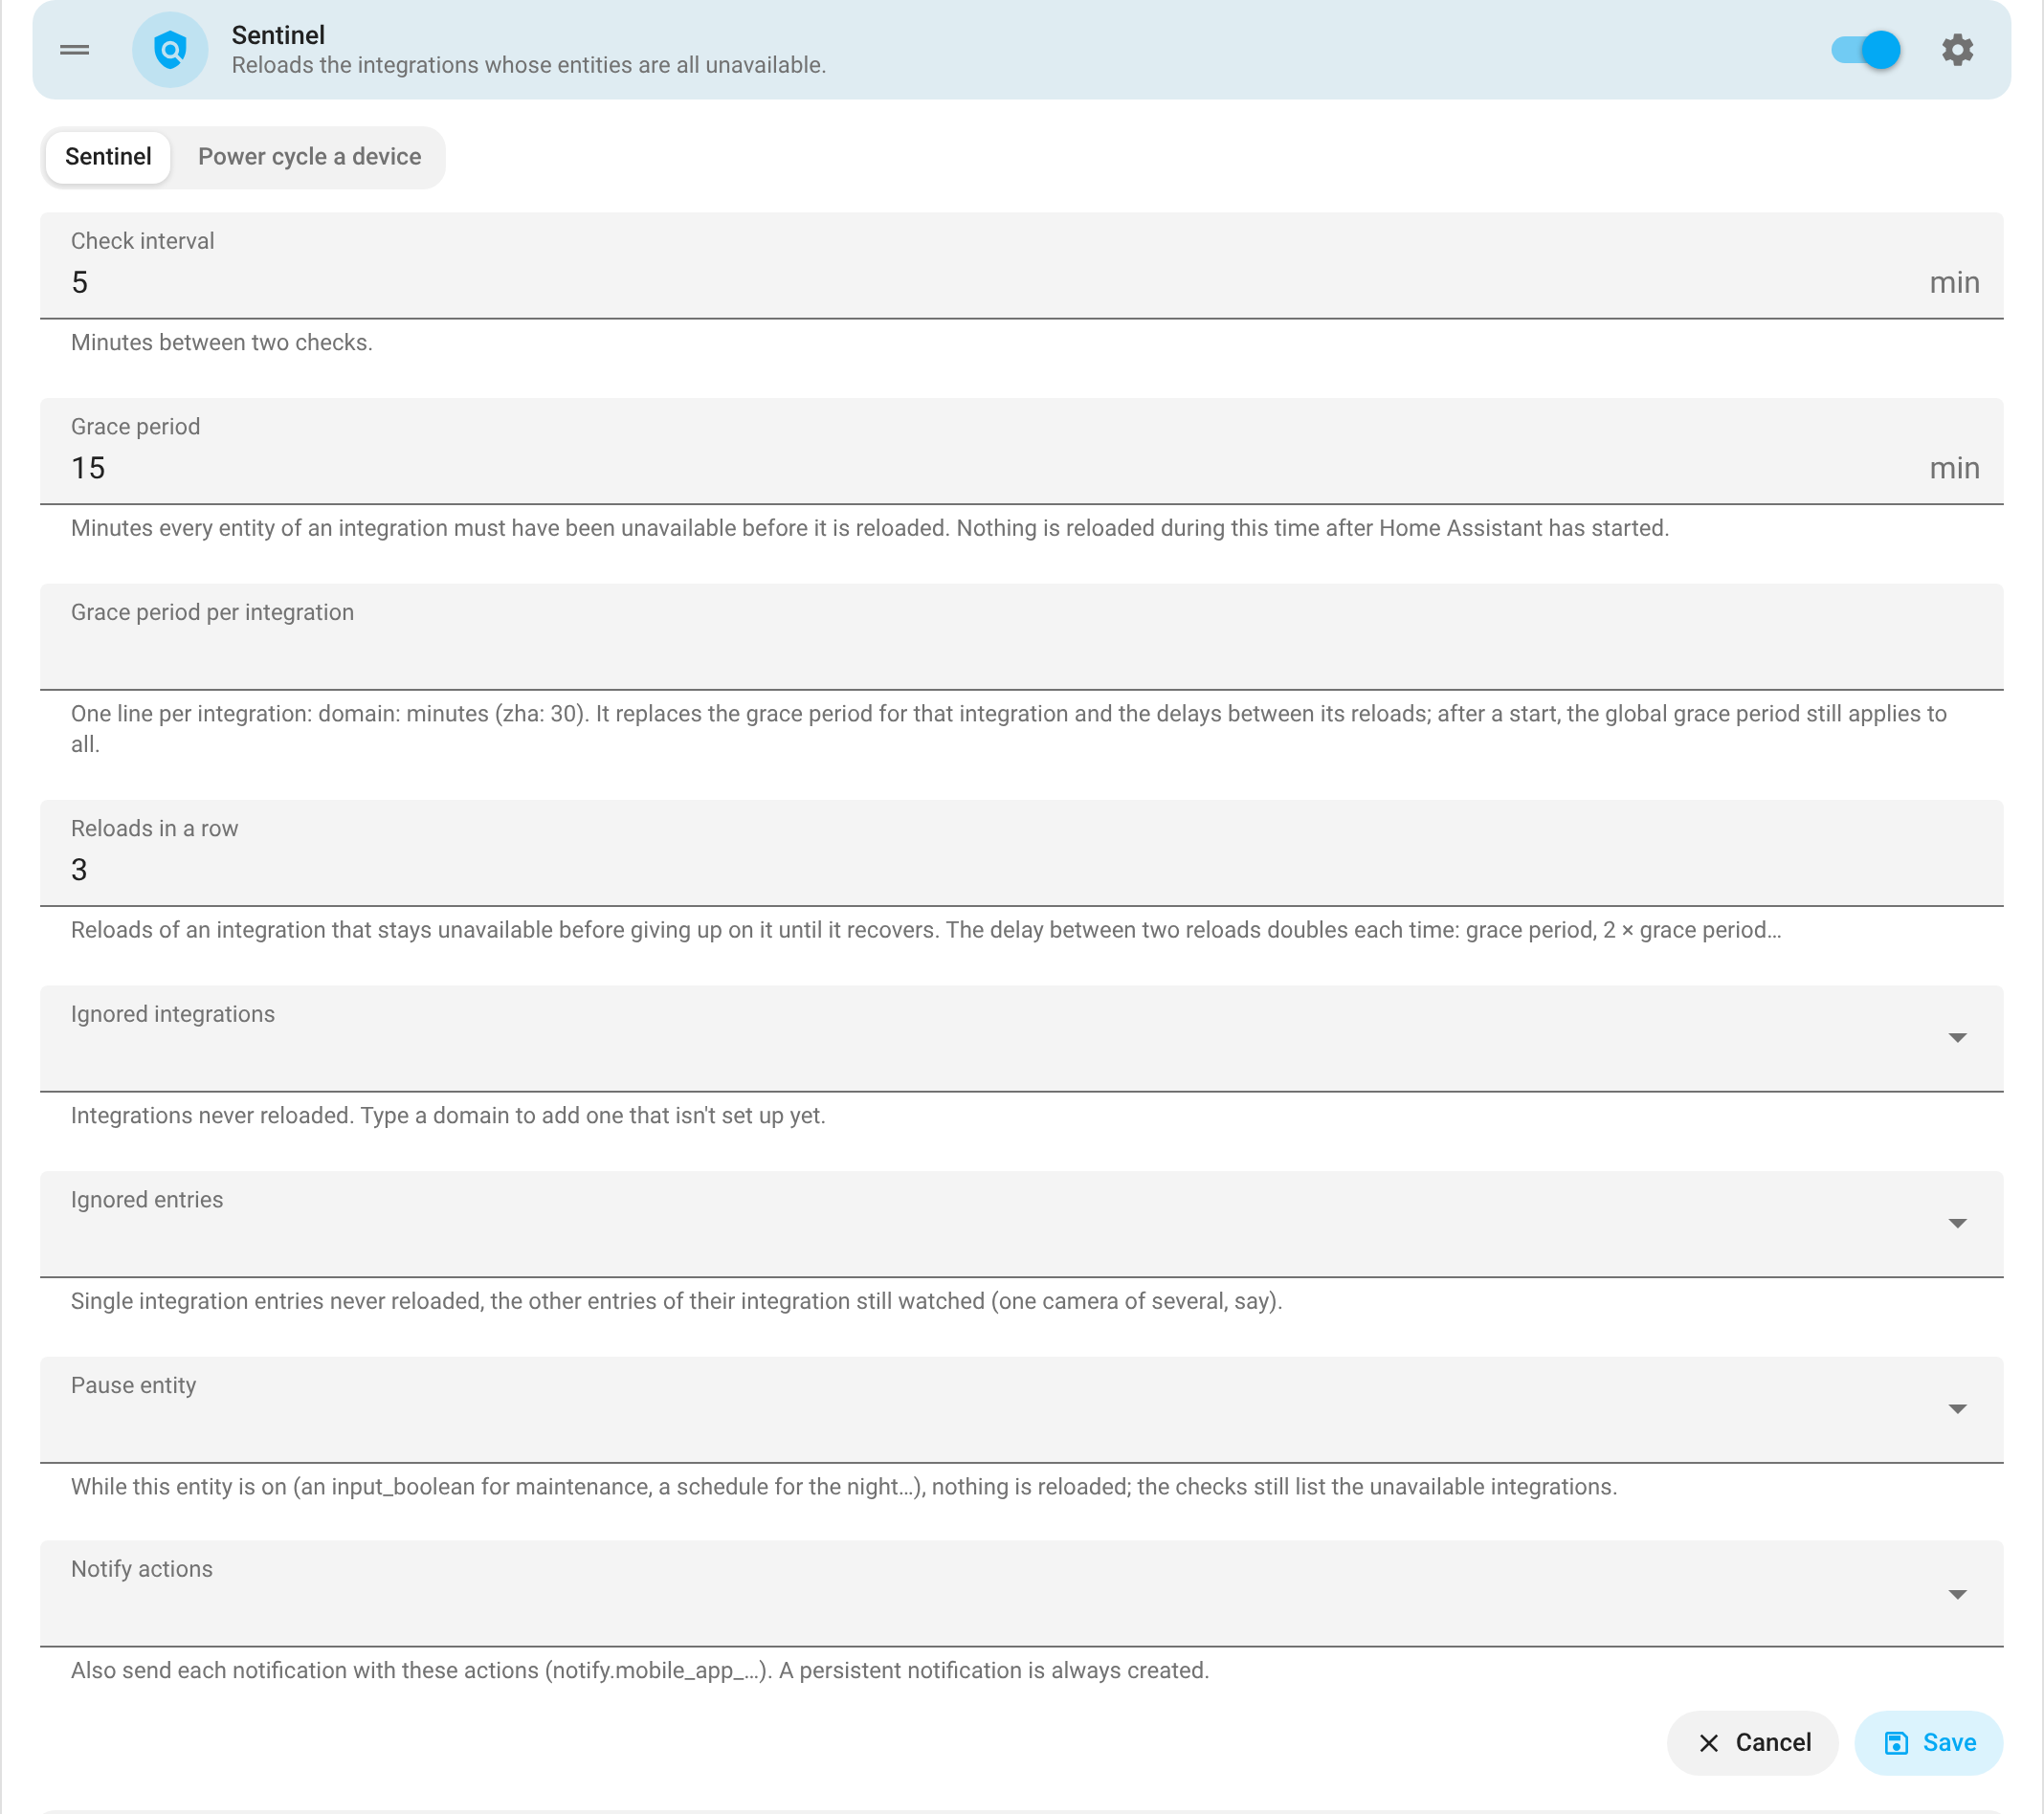 |
 |
| Watchdog: Power cycle a device | 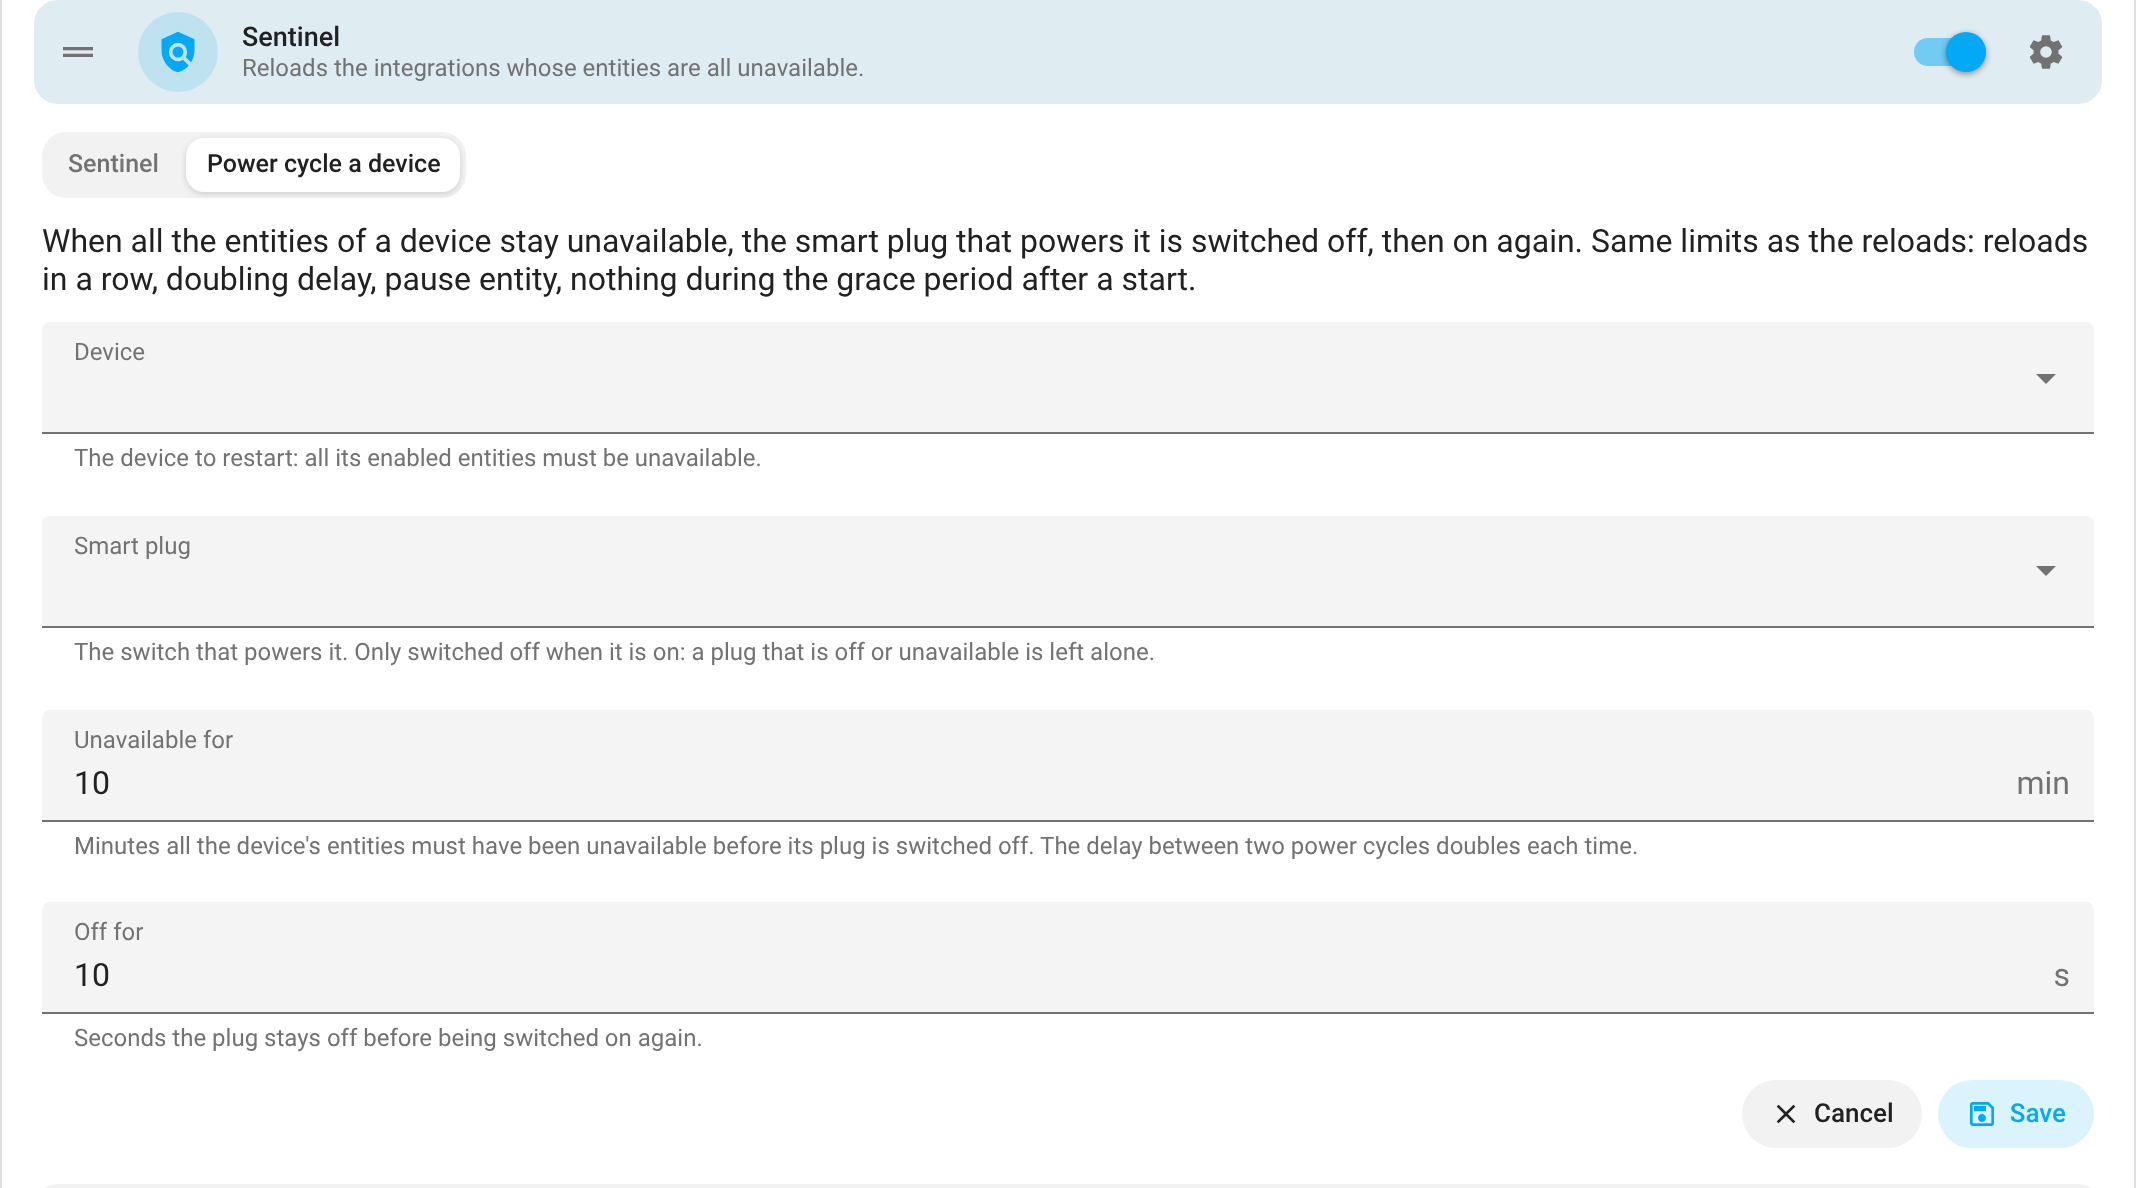 |
 |
| Marketplace | 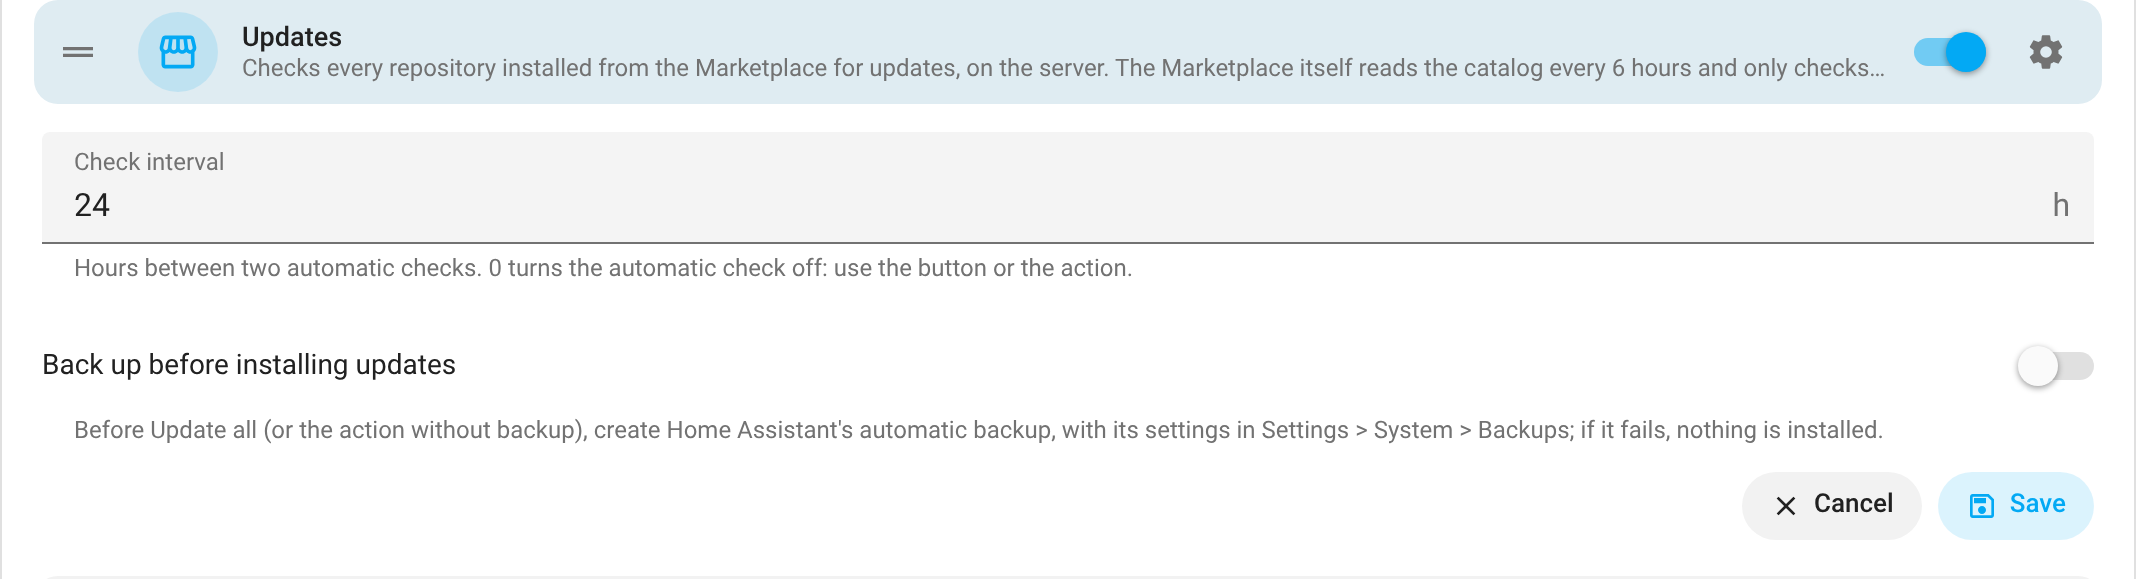 |
 |
| Batteries | 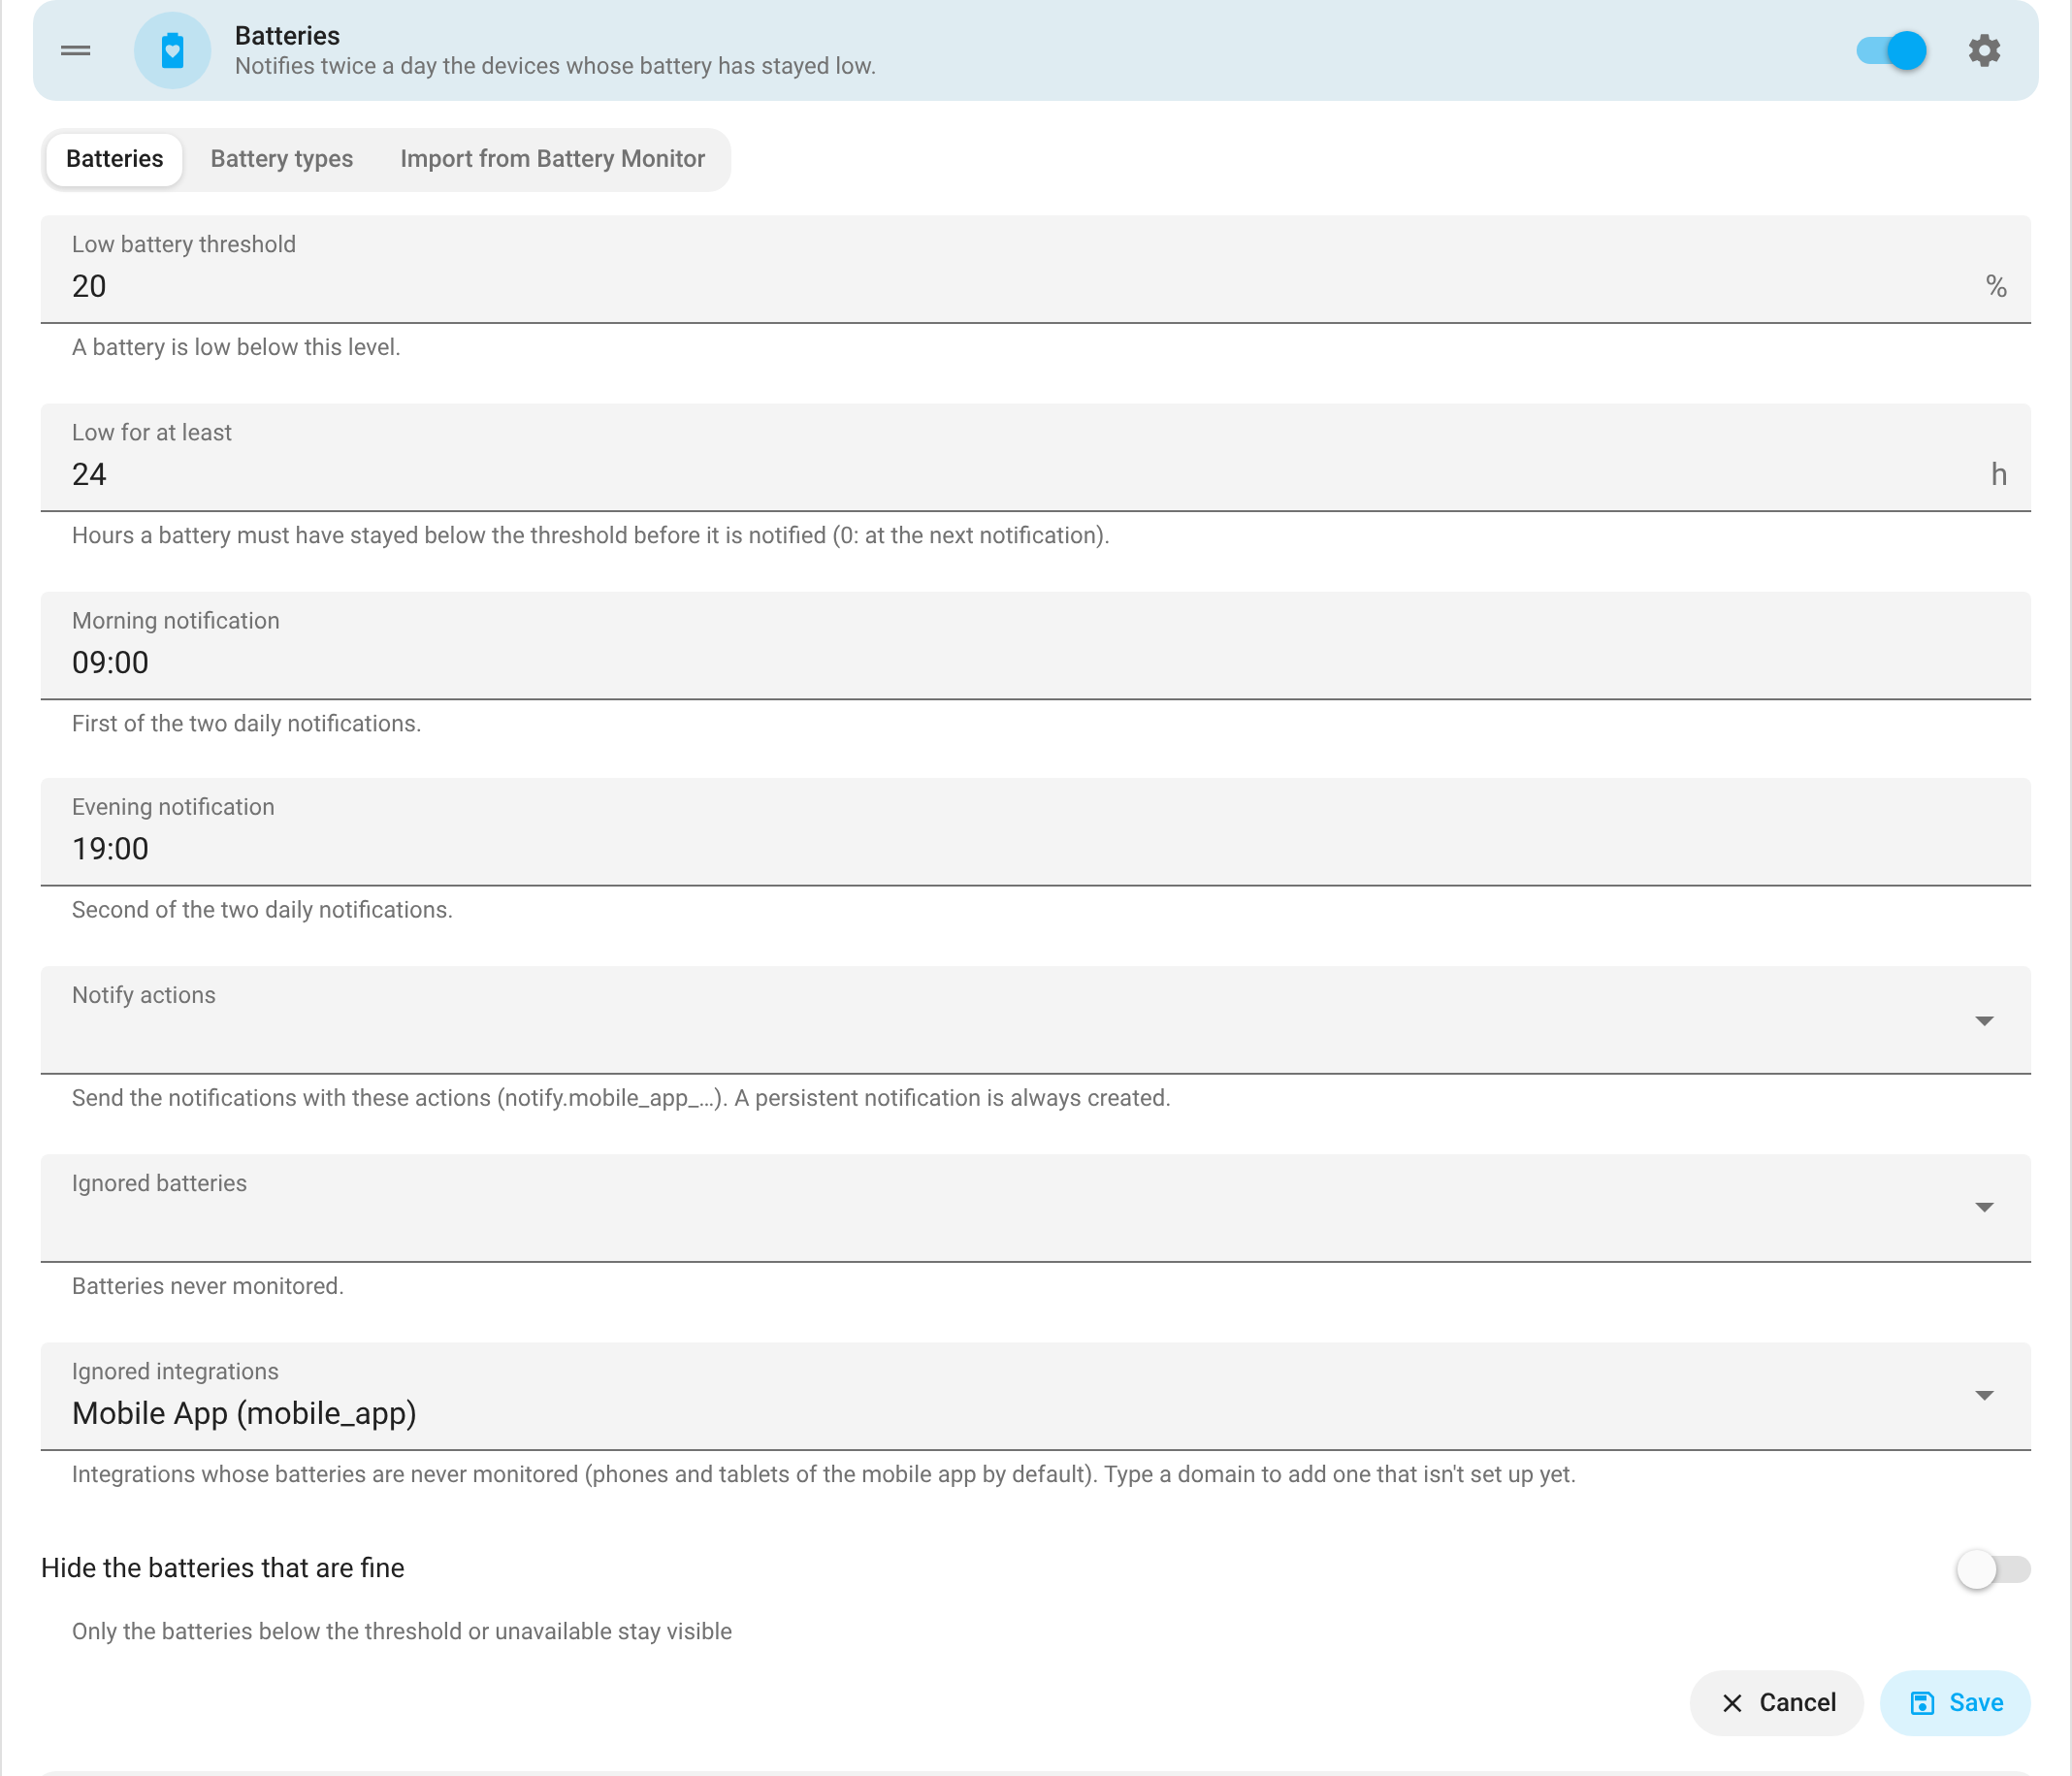 |
 |
| Batteries: Battery types | 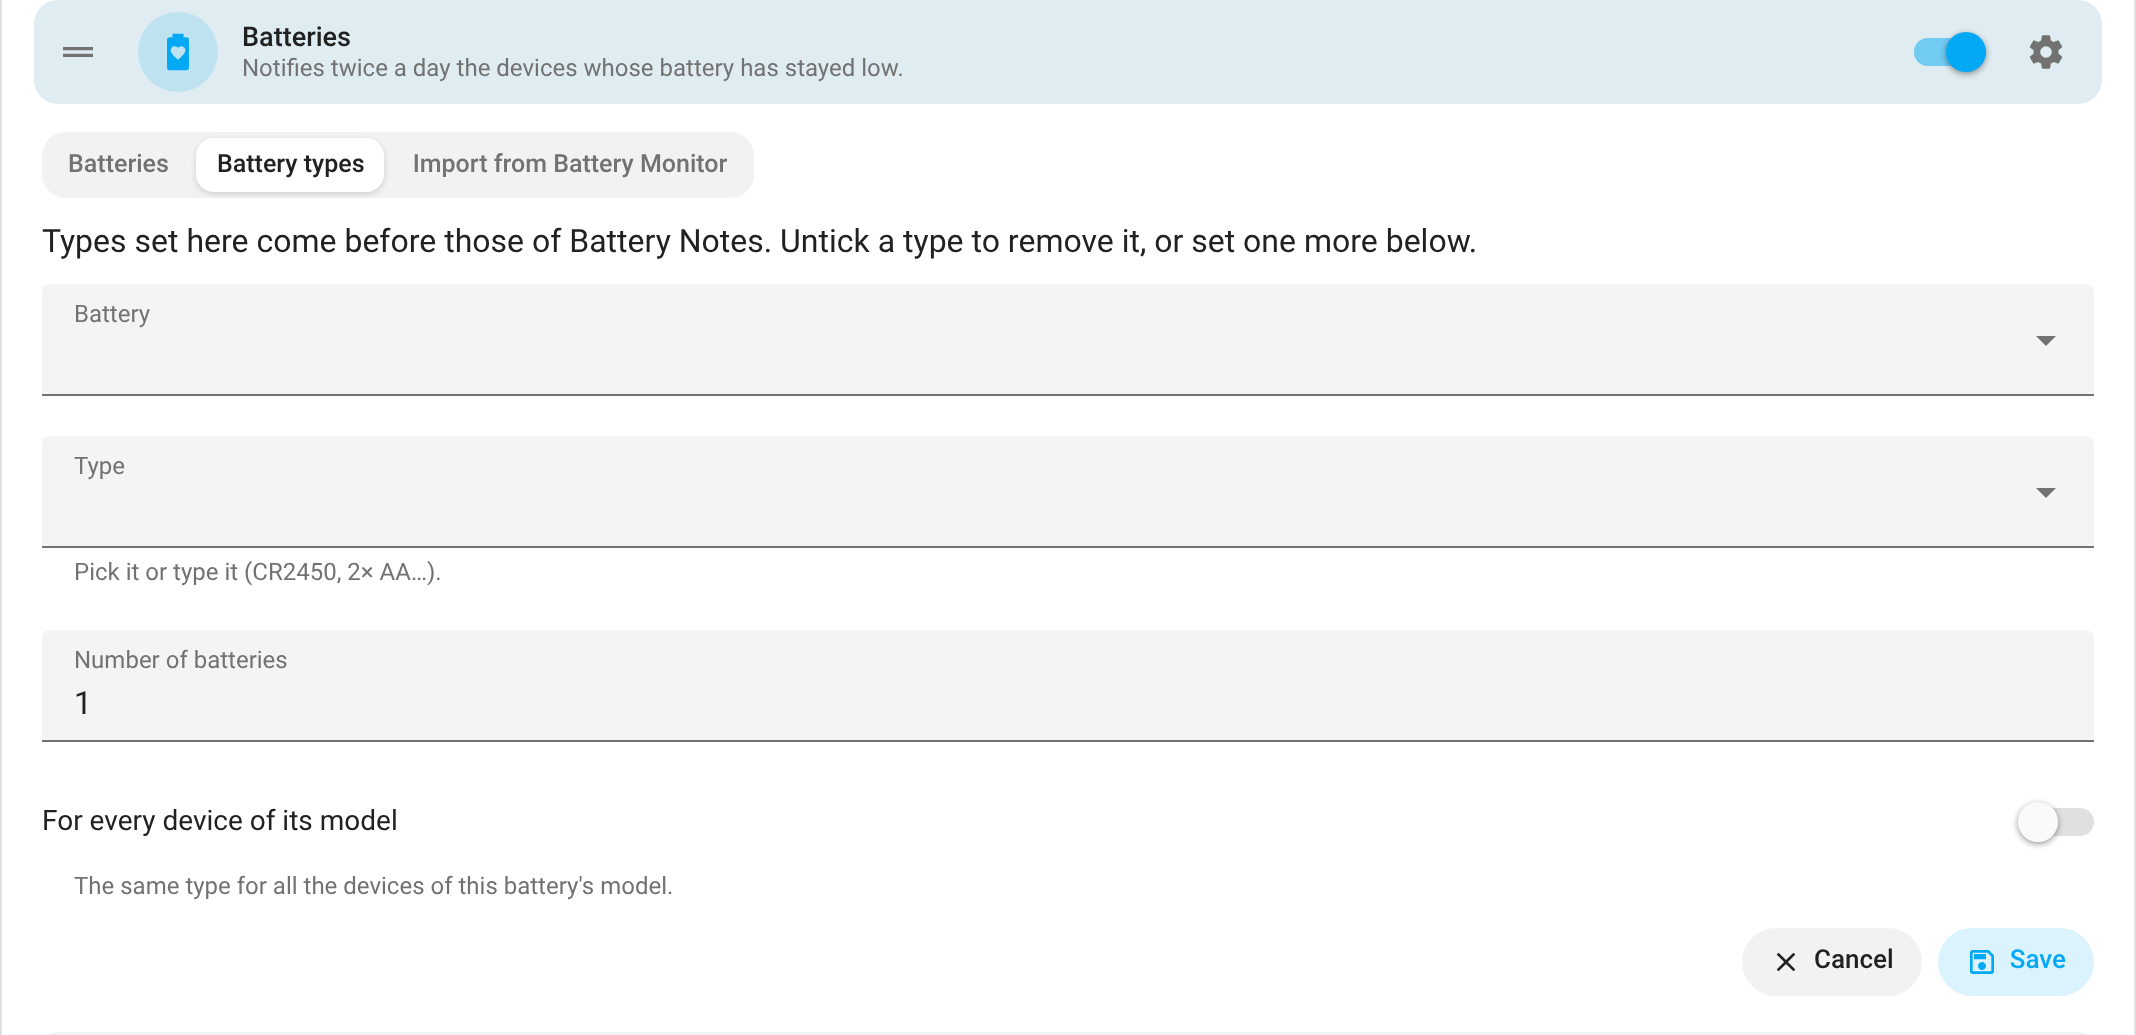 |
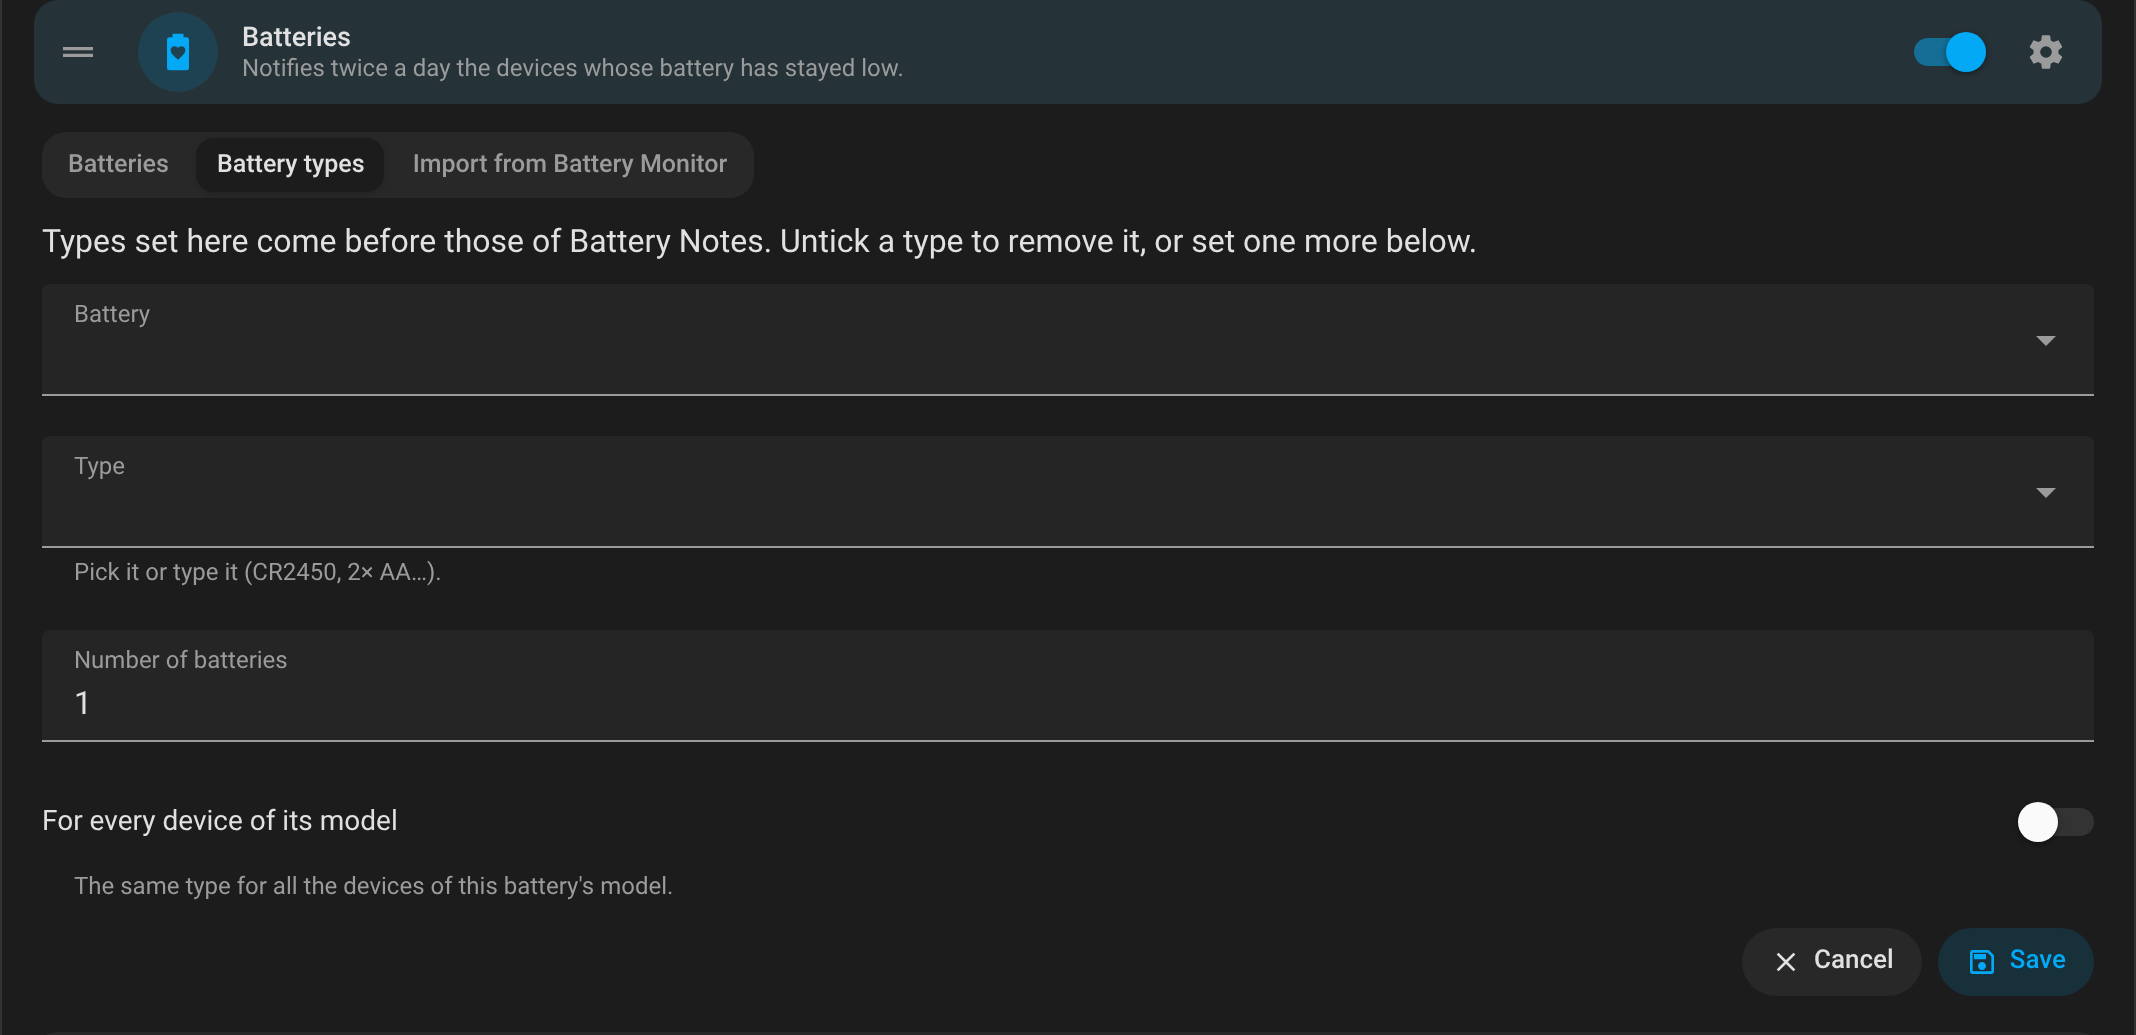 |
| Batteries: Import from Battery Monitor | 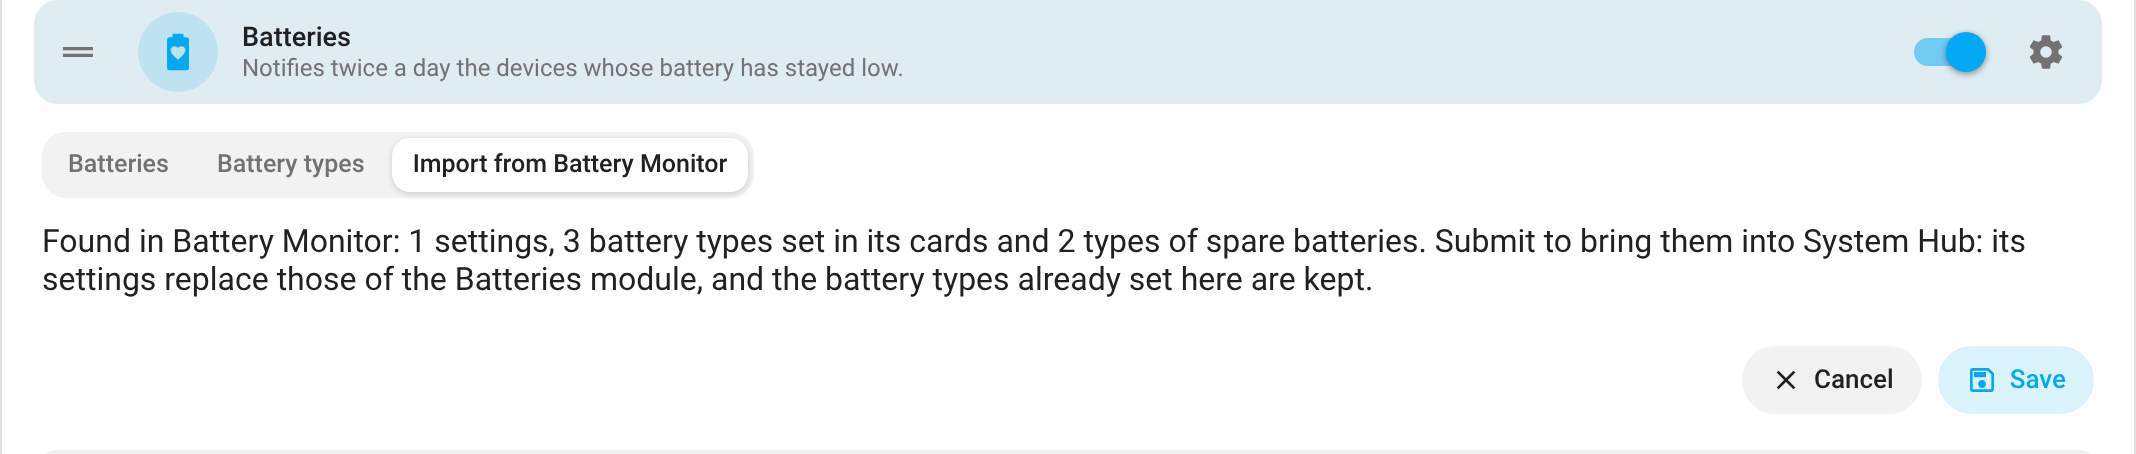 |
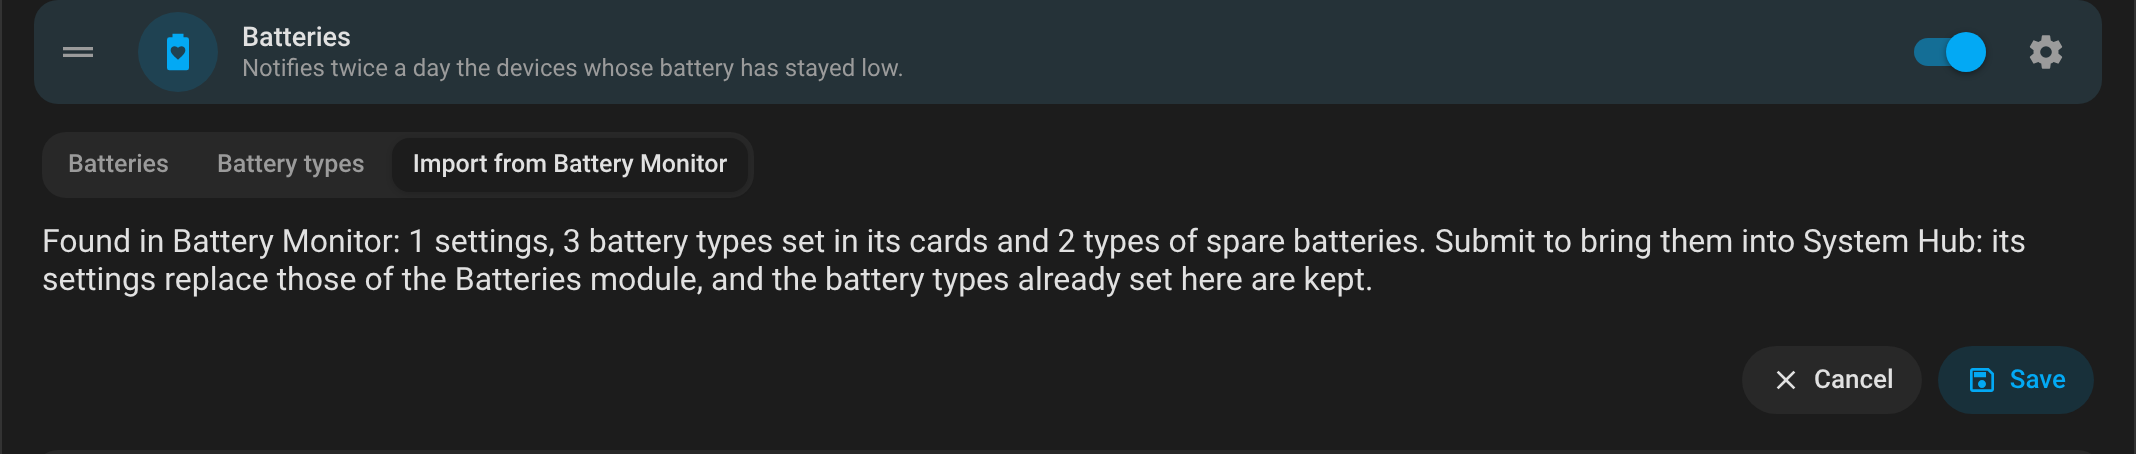 |
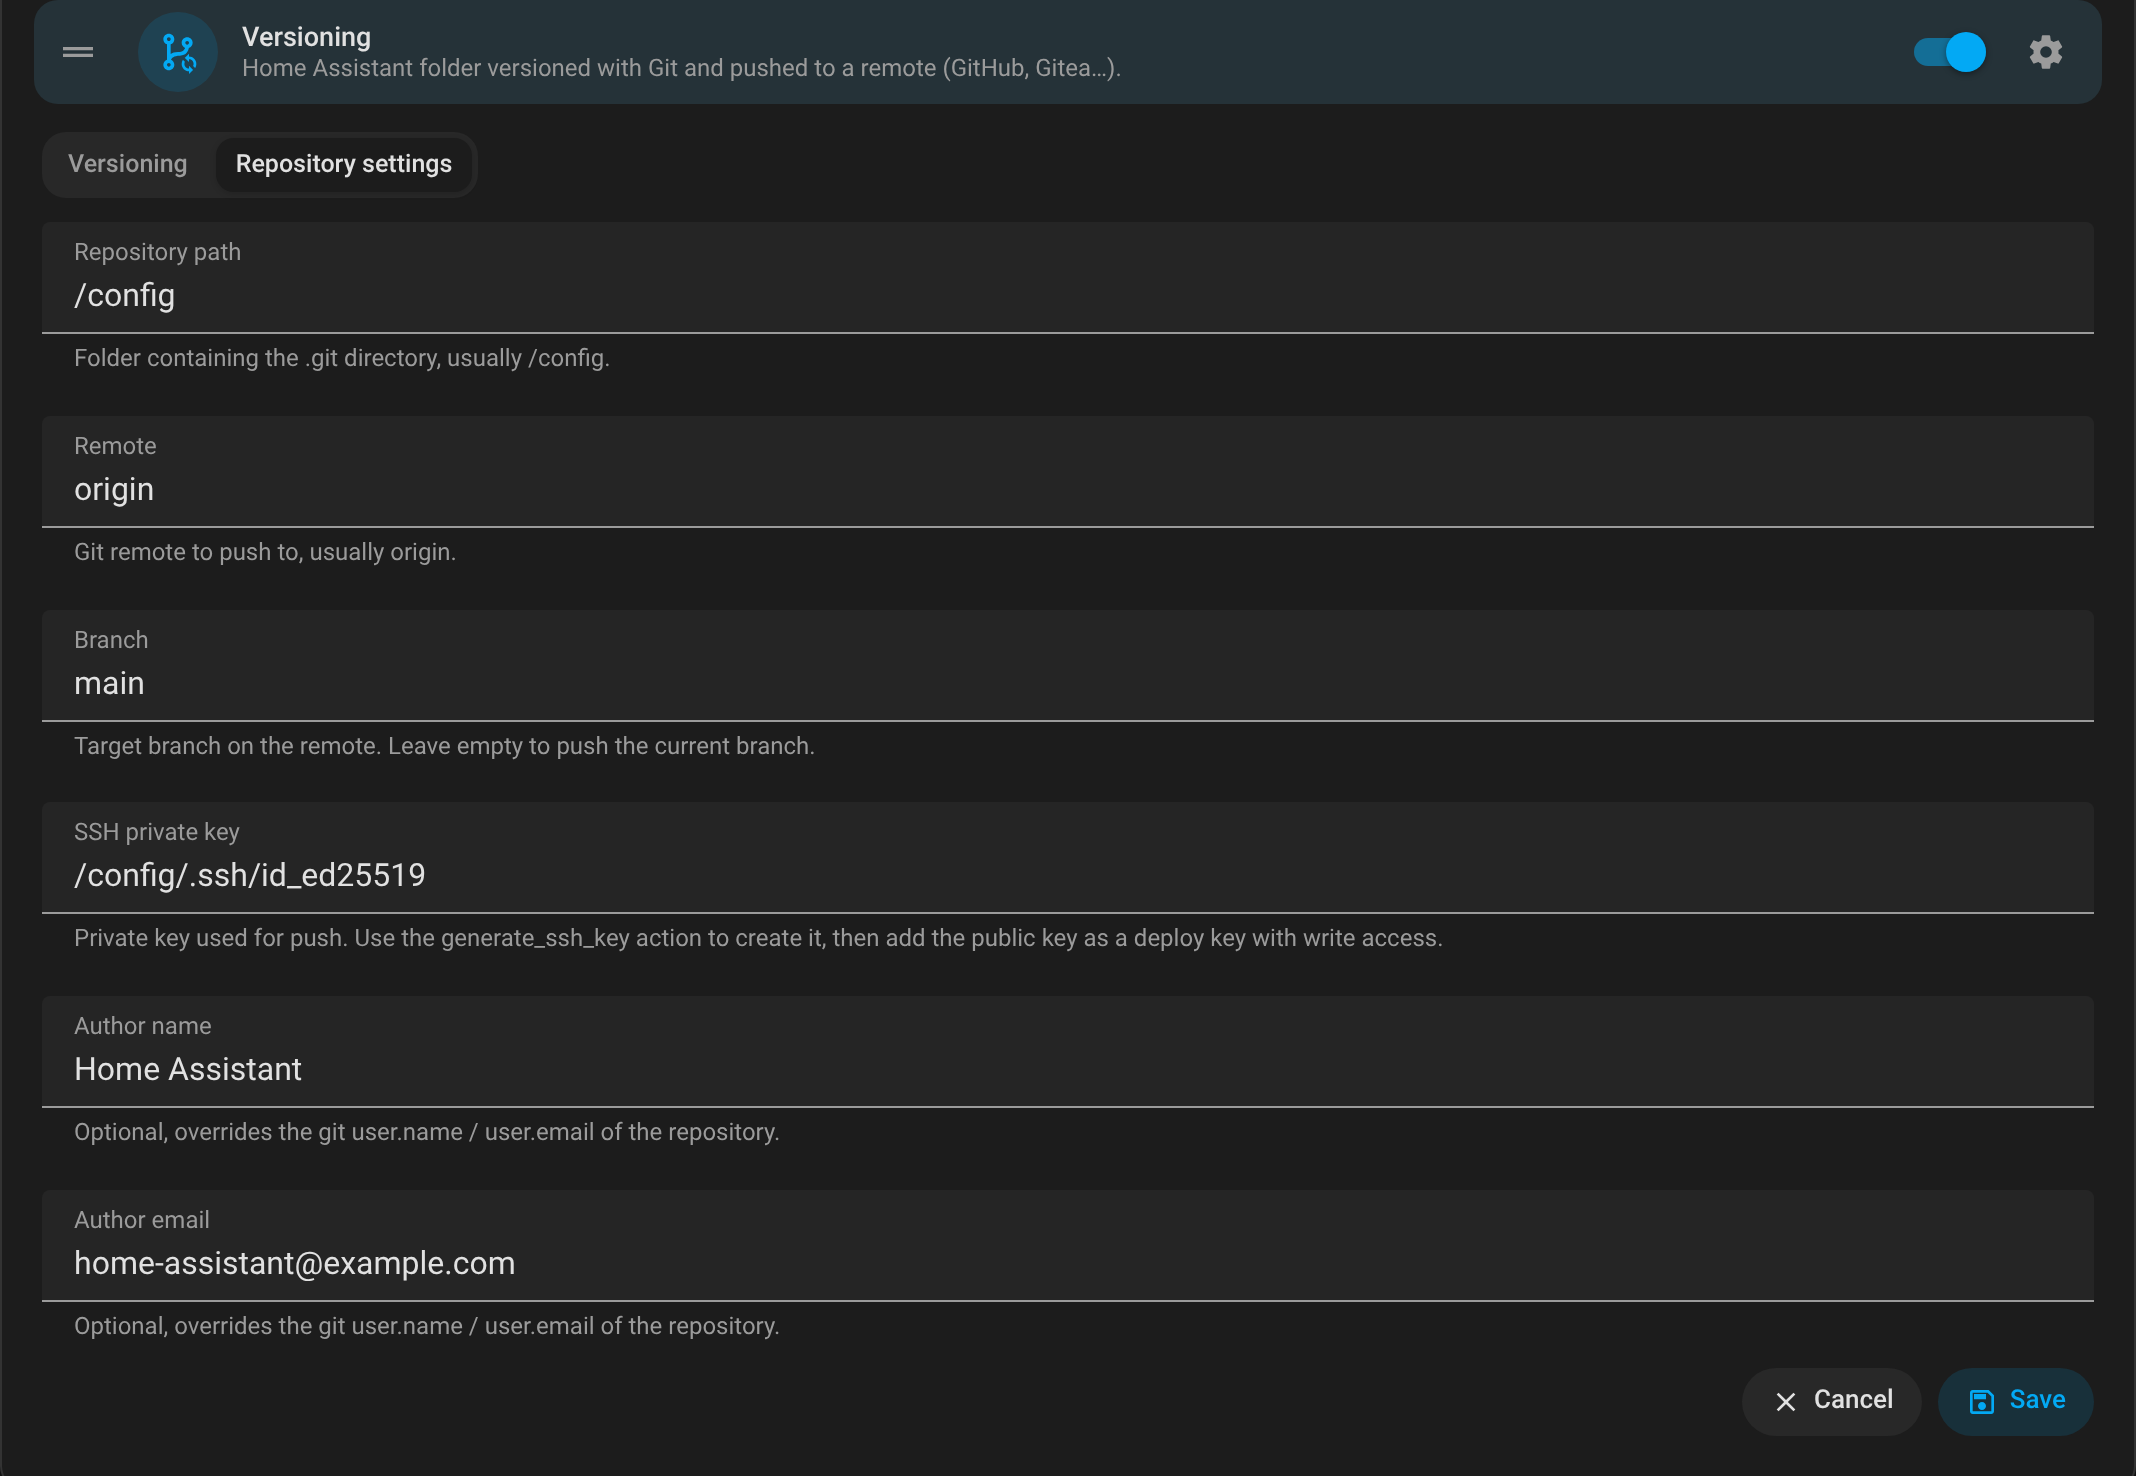
| Git Sync: Repository settings | 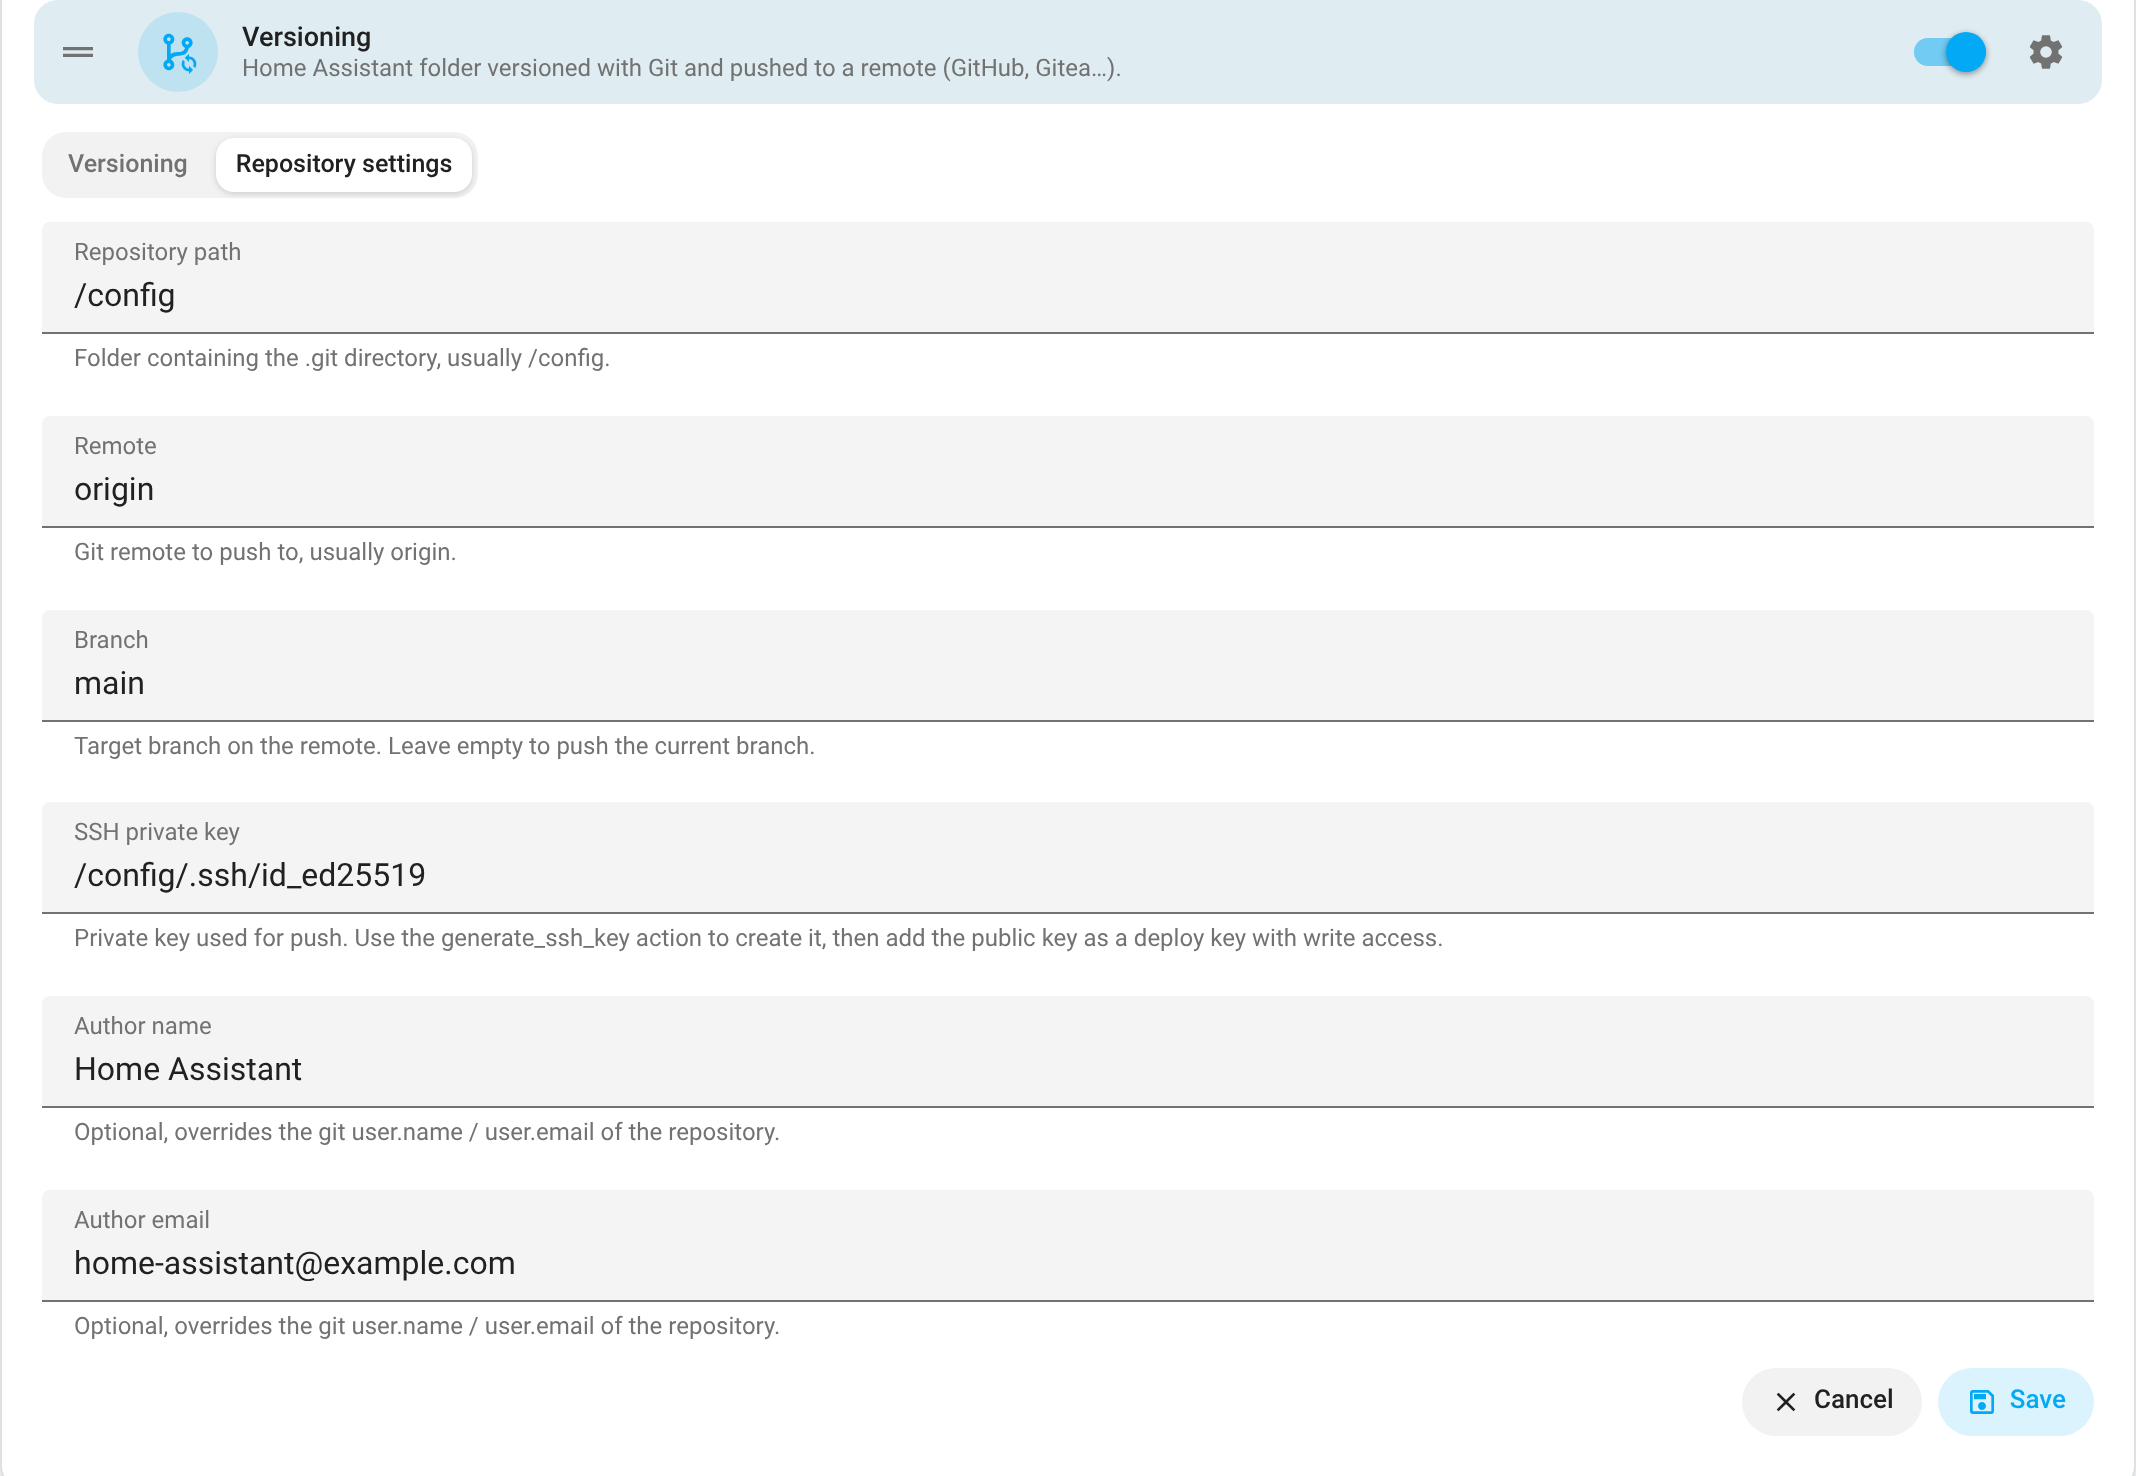 |
 |
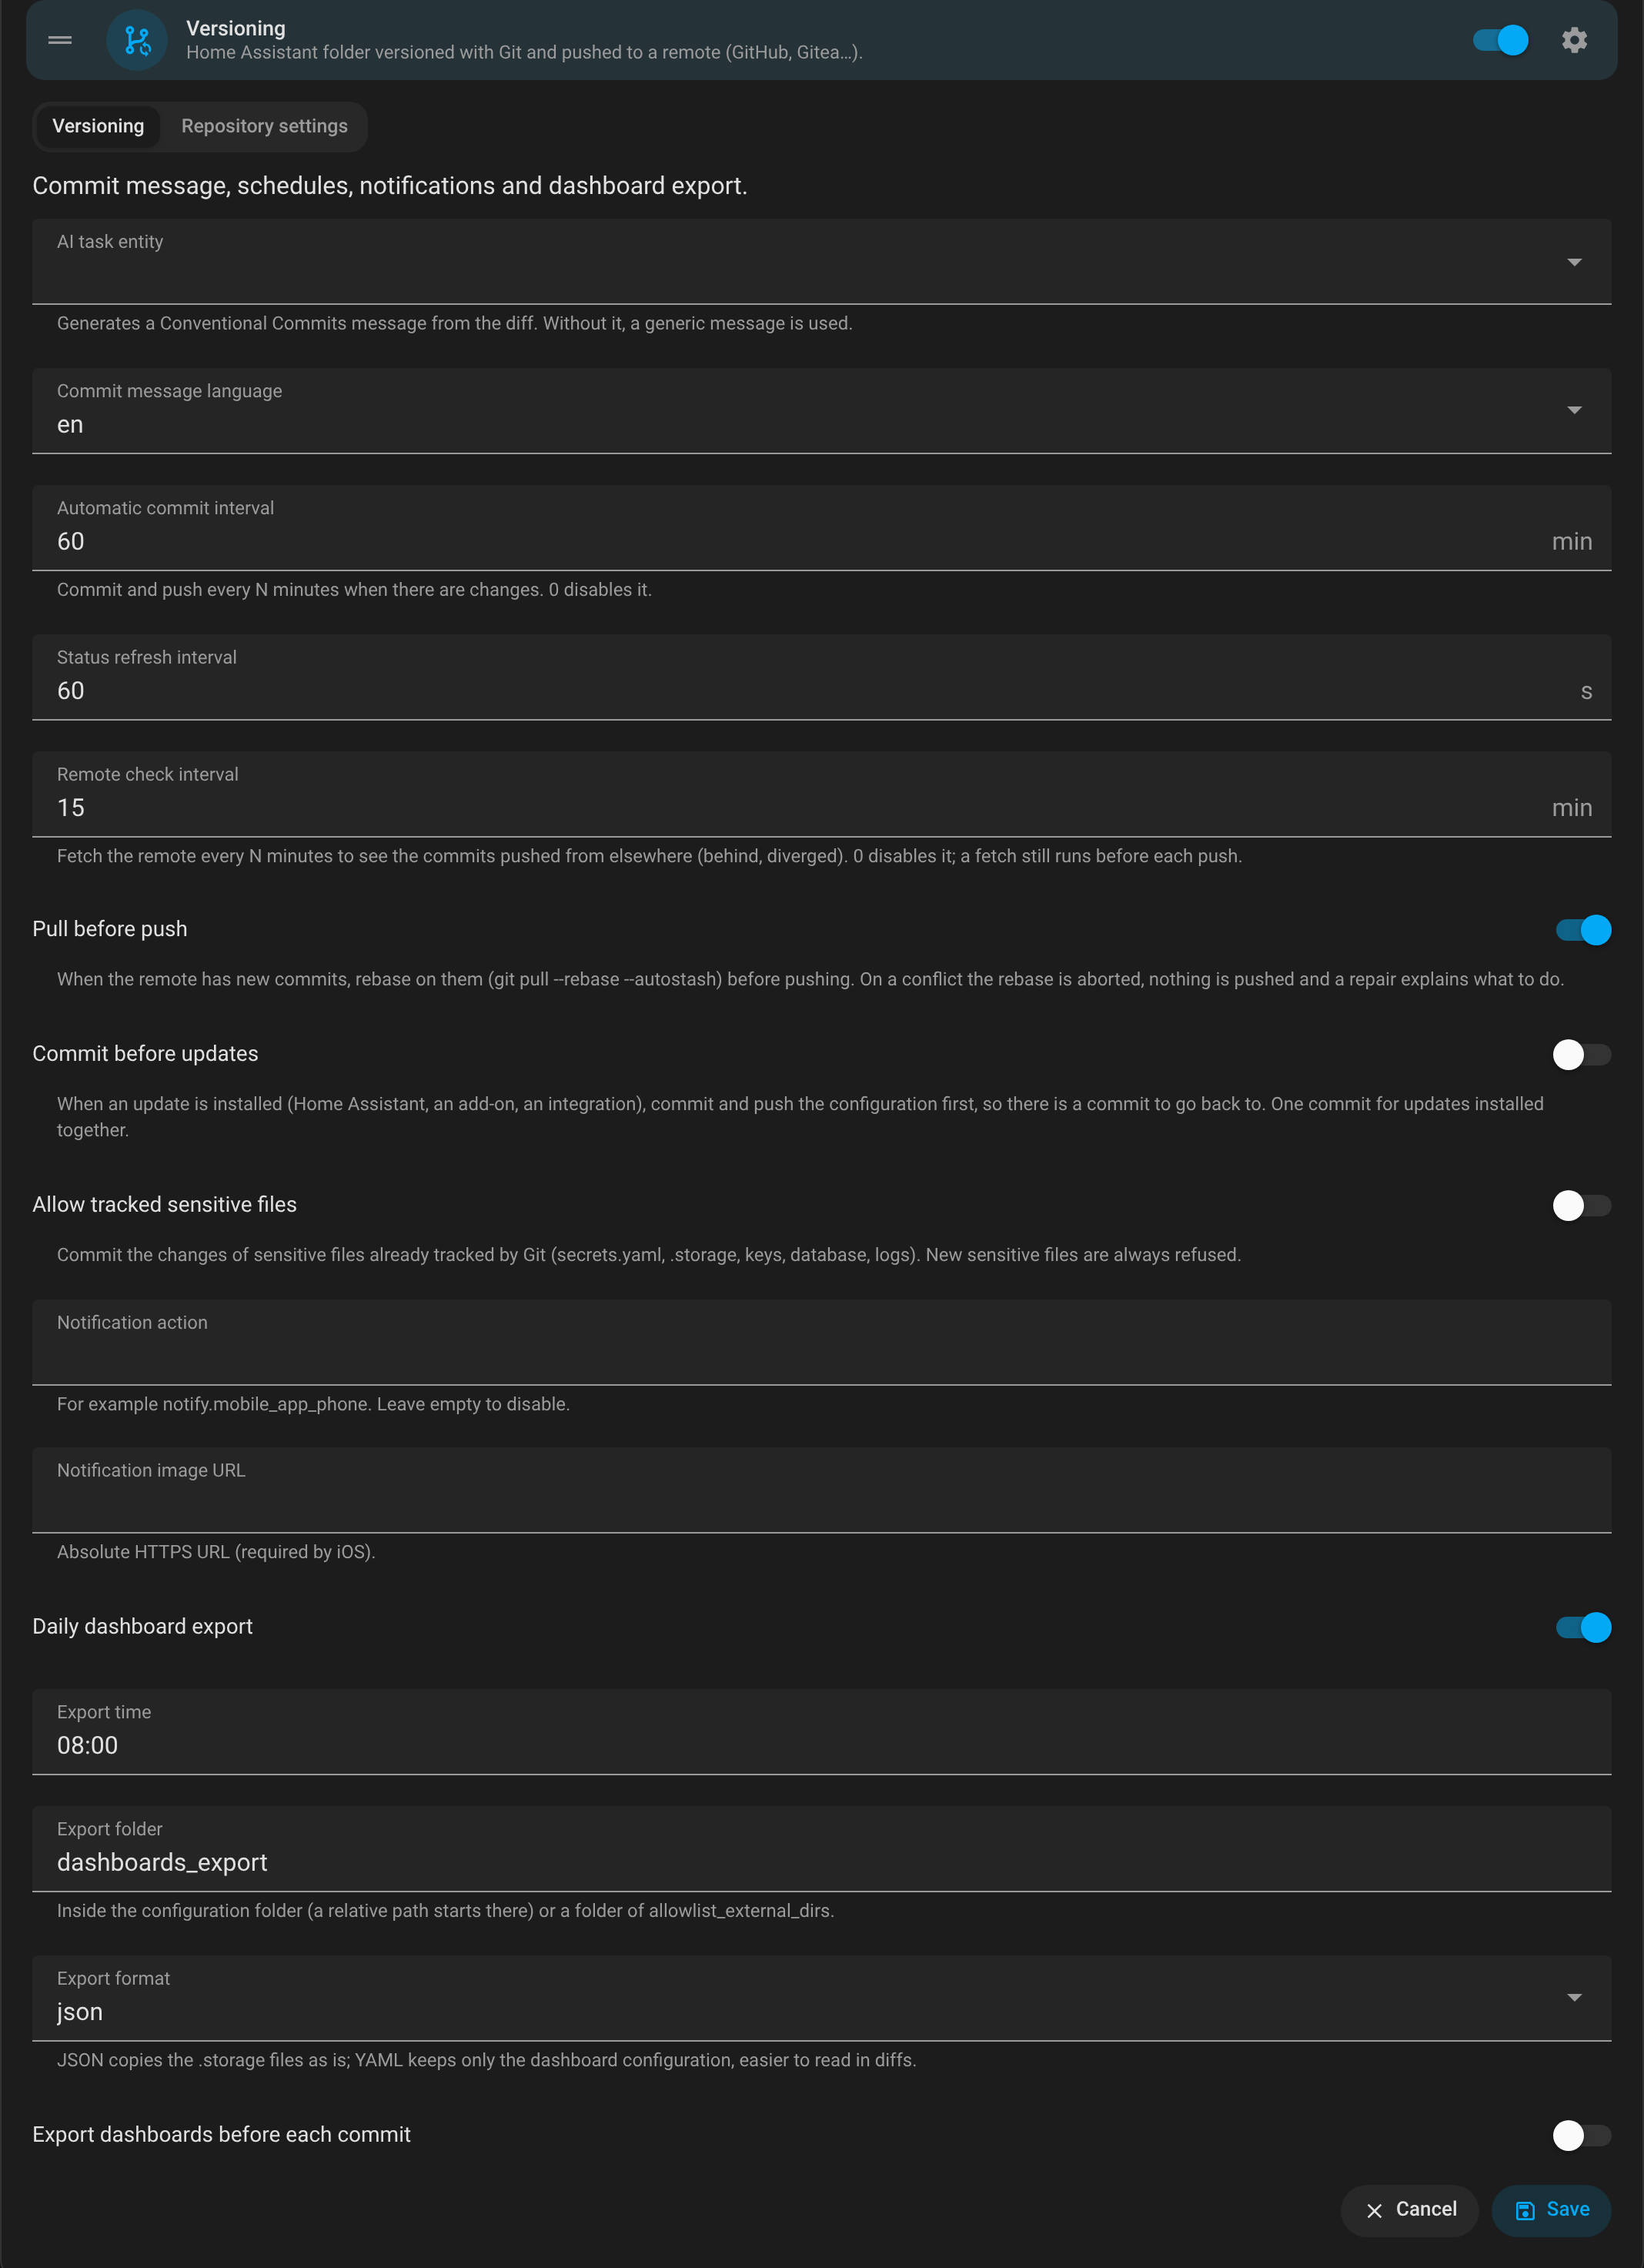
| Git Sync | 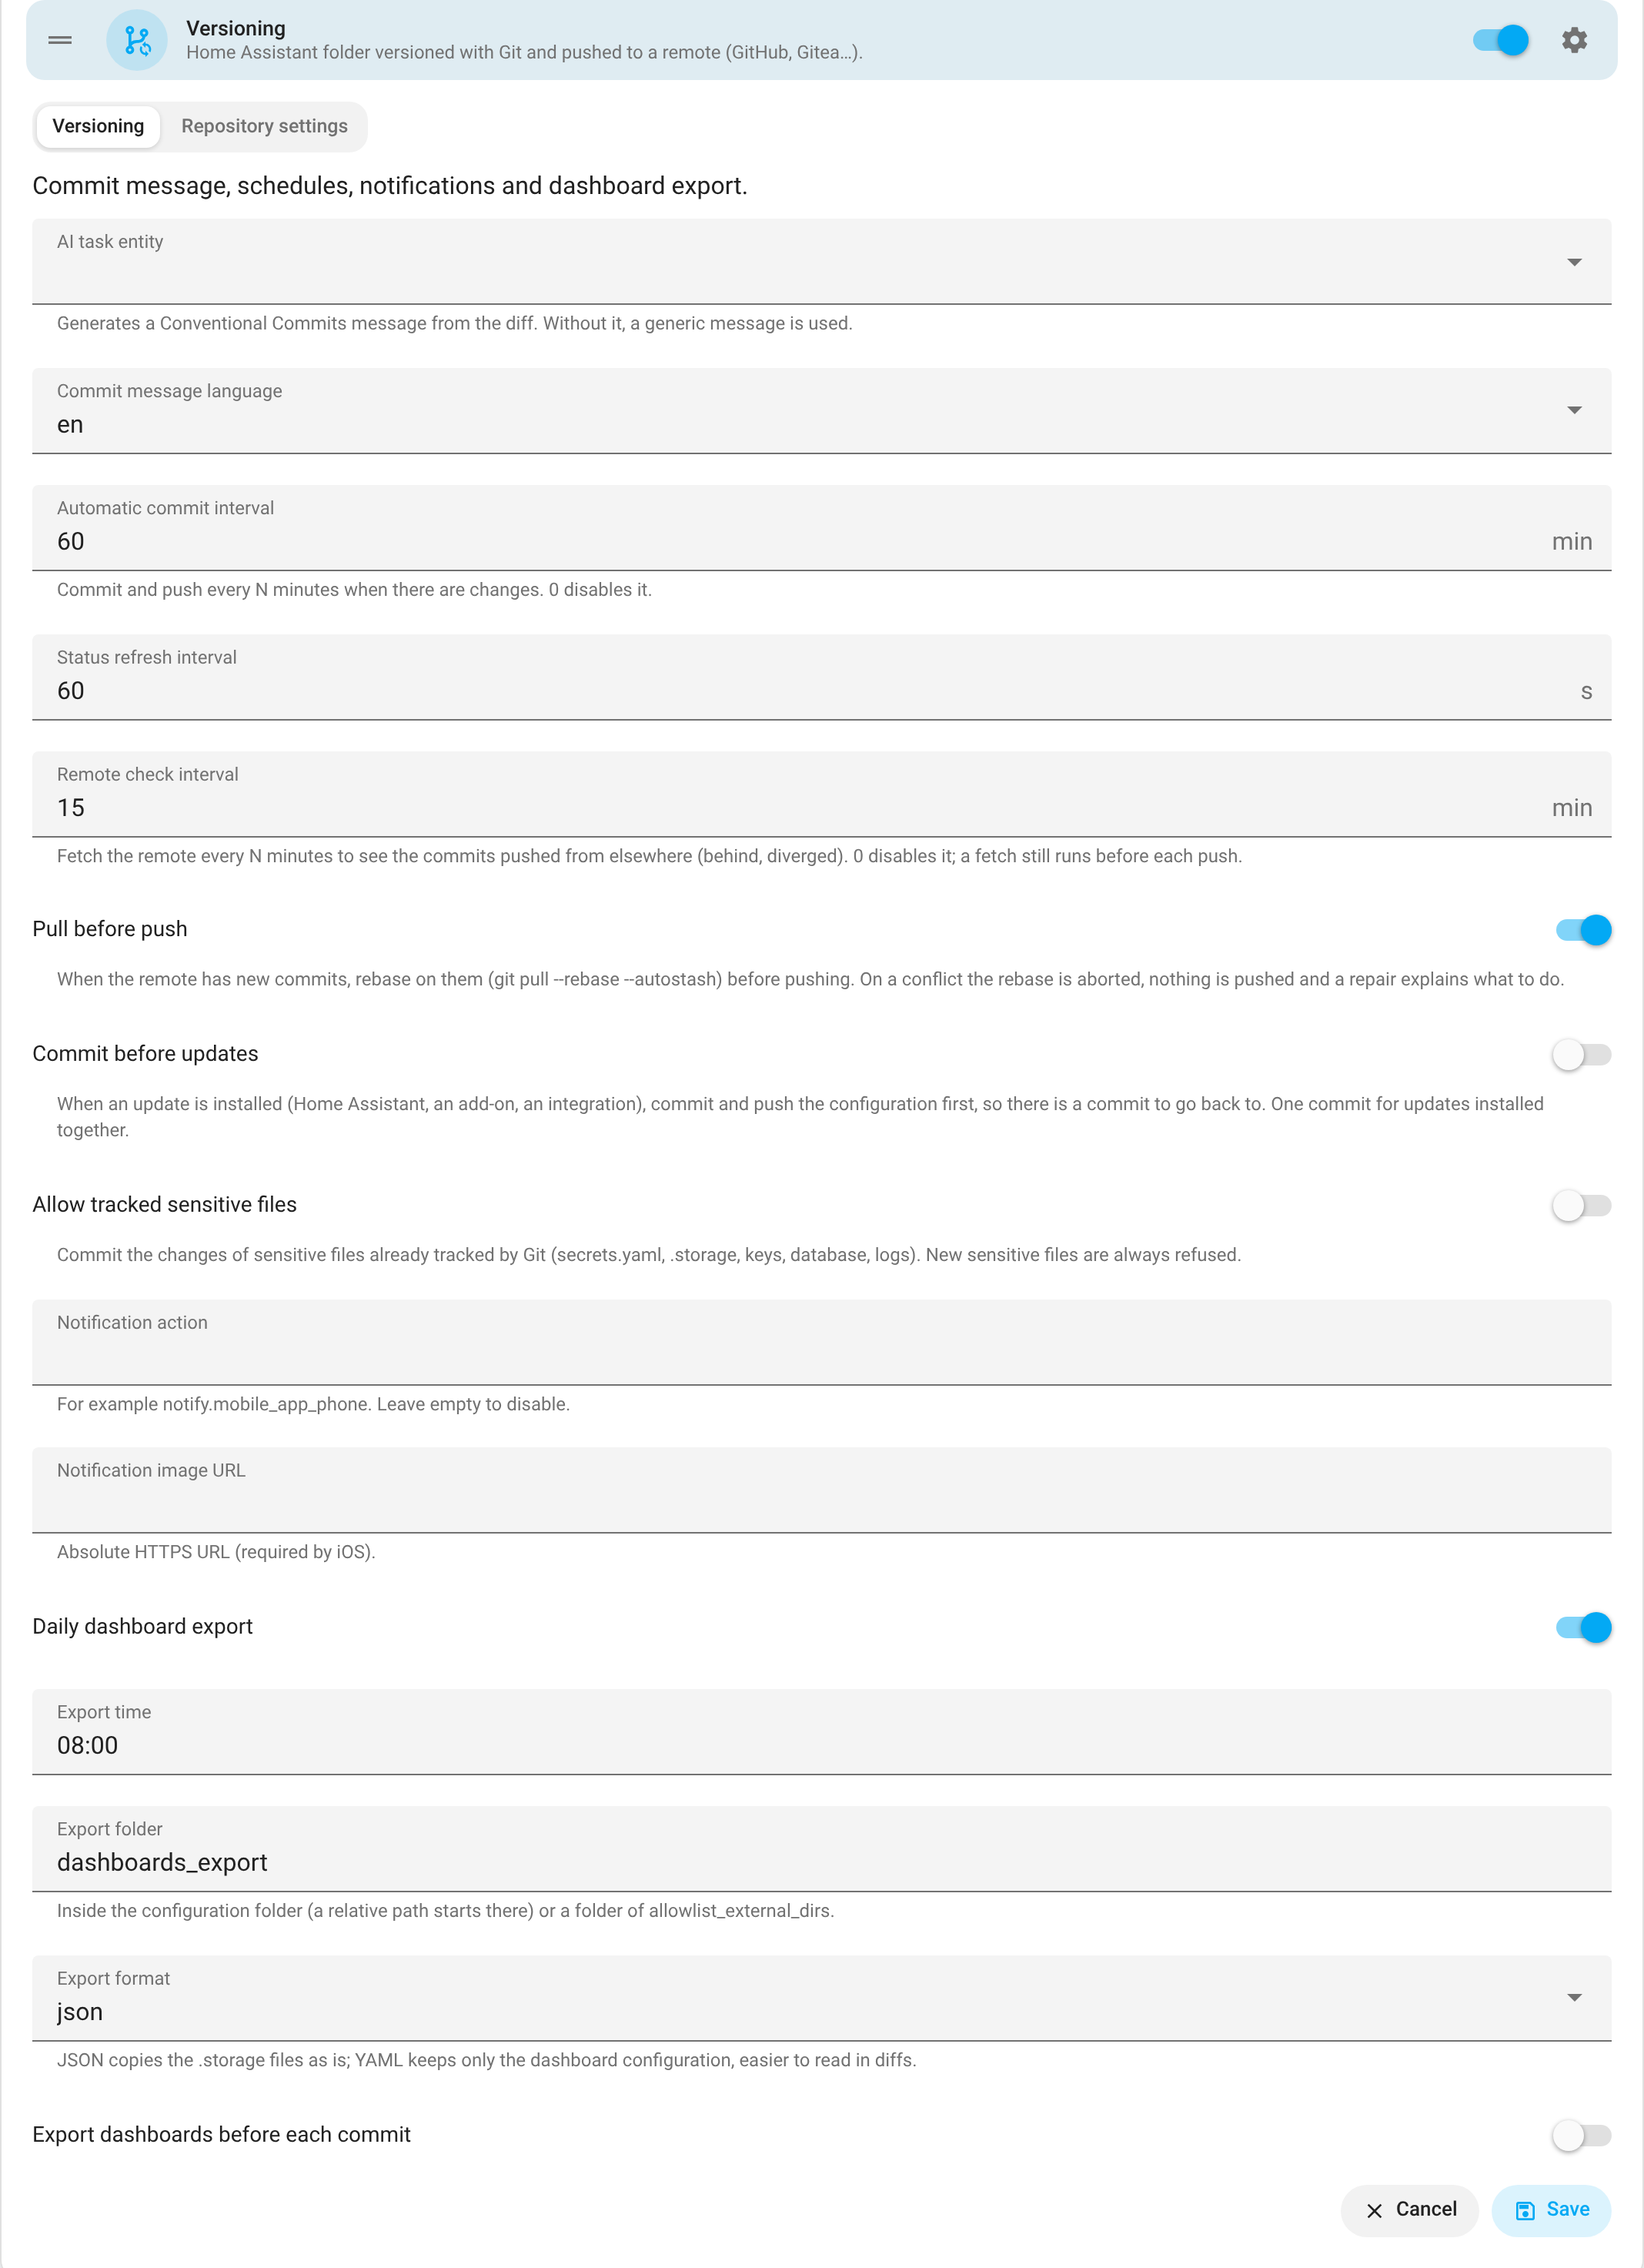 |
 |
| Automations | 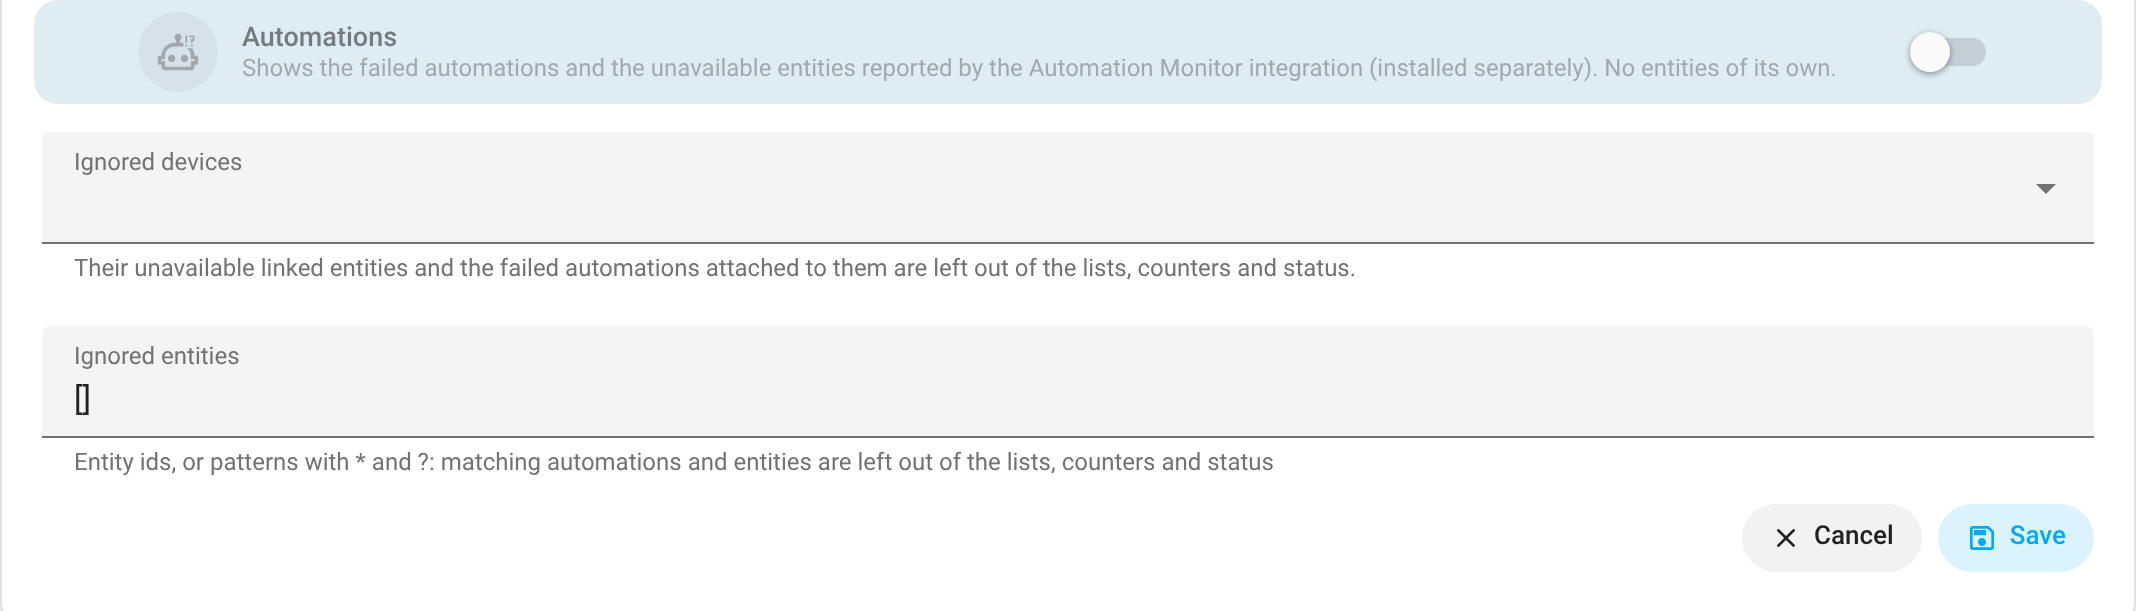 |
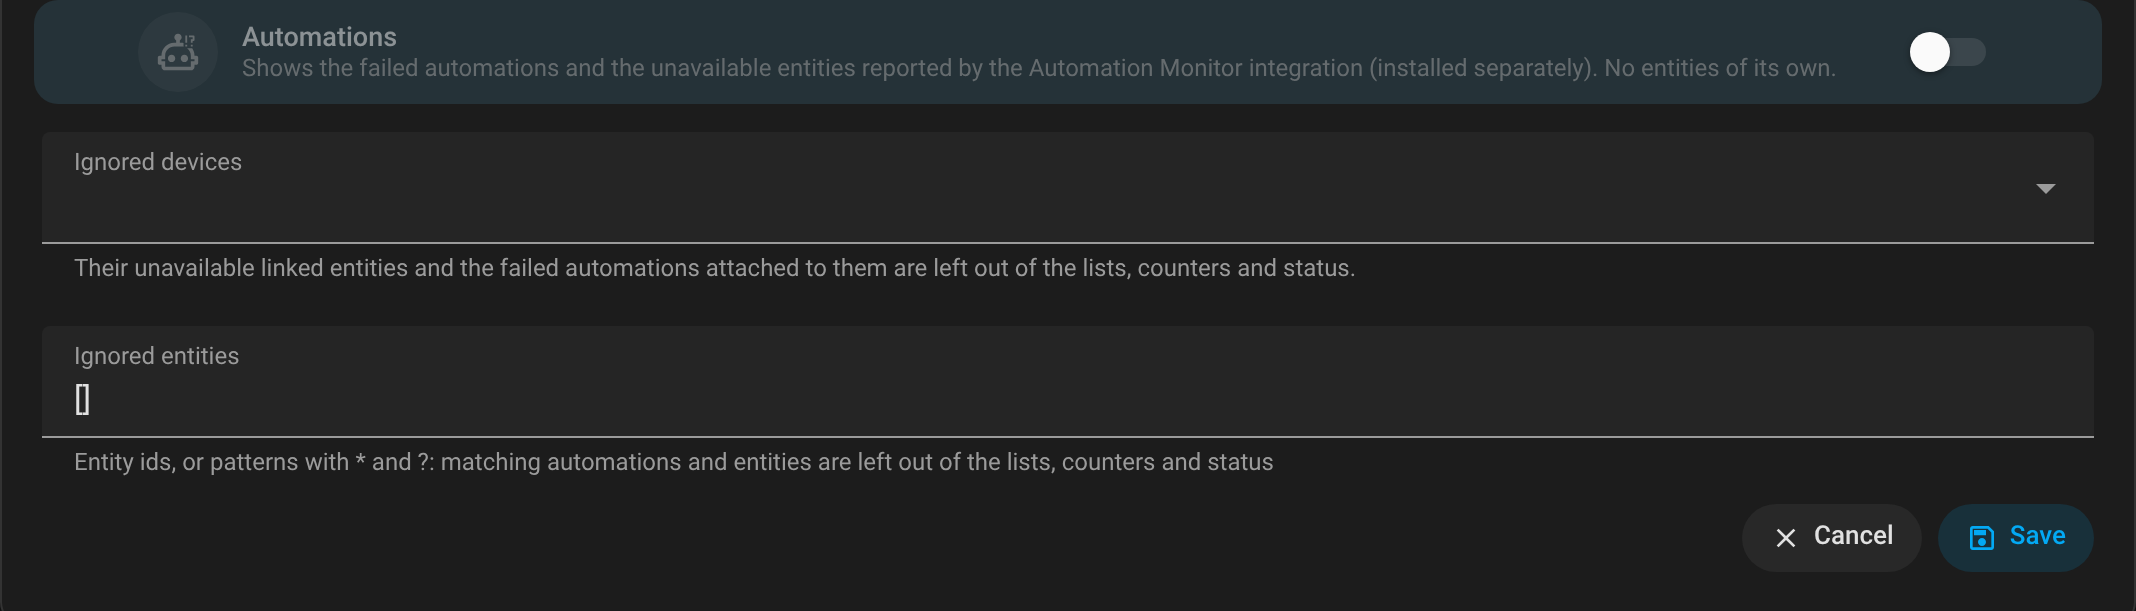 |
| Orphans | 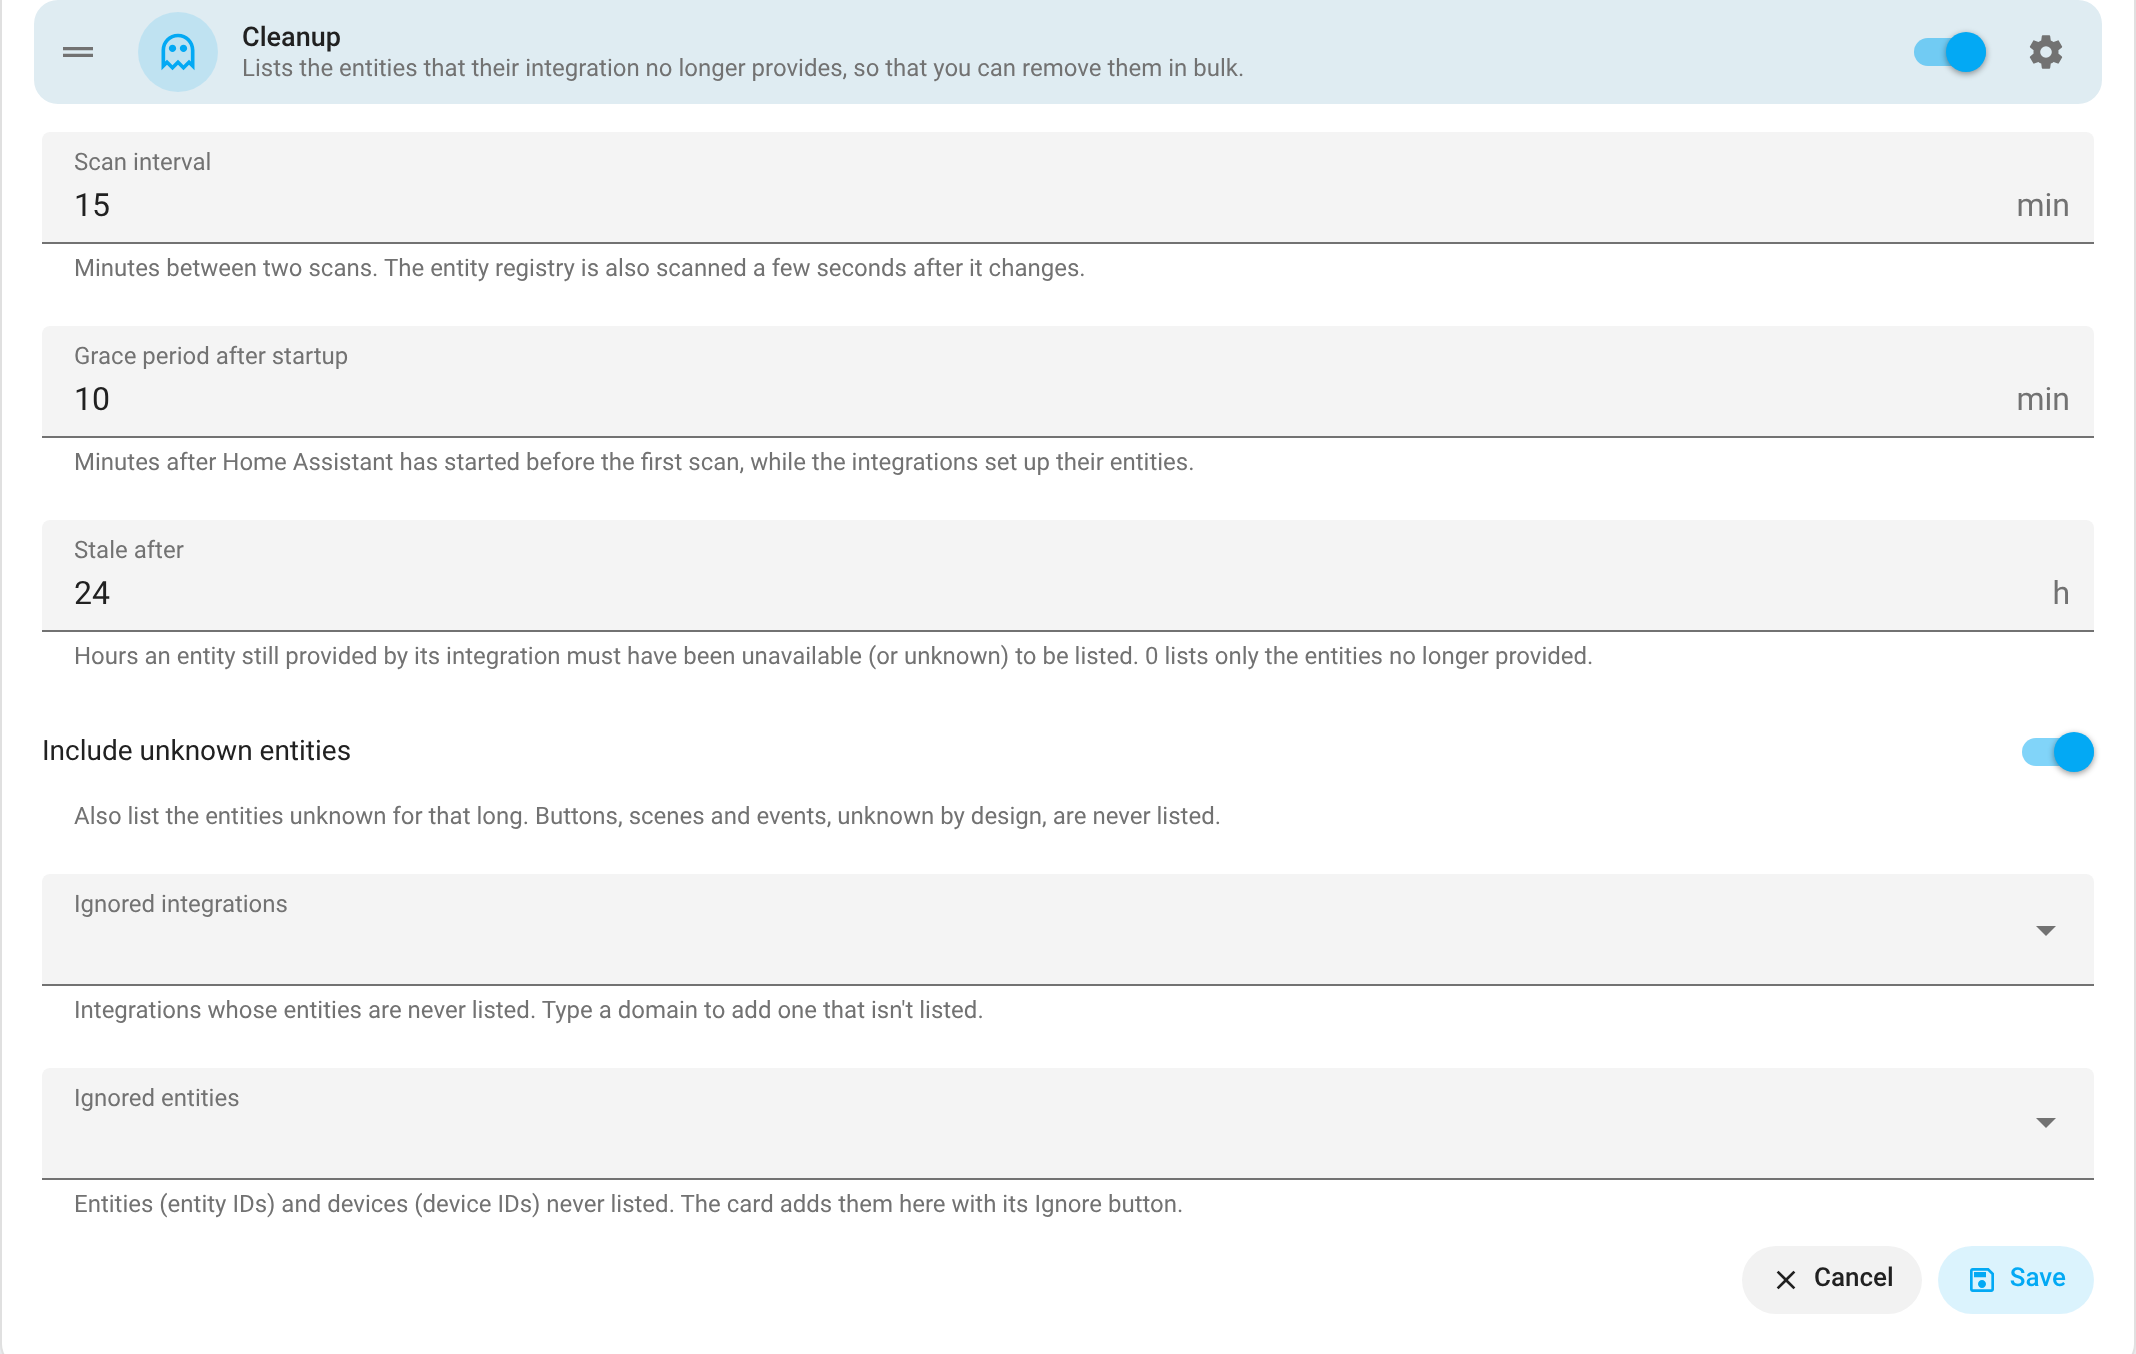 |
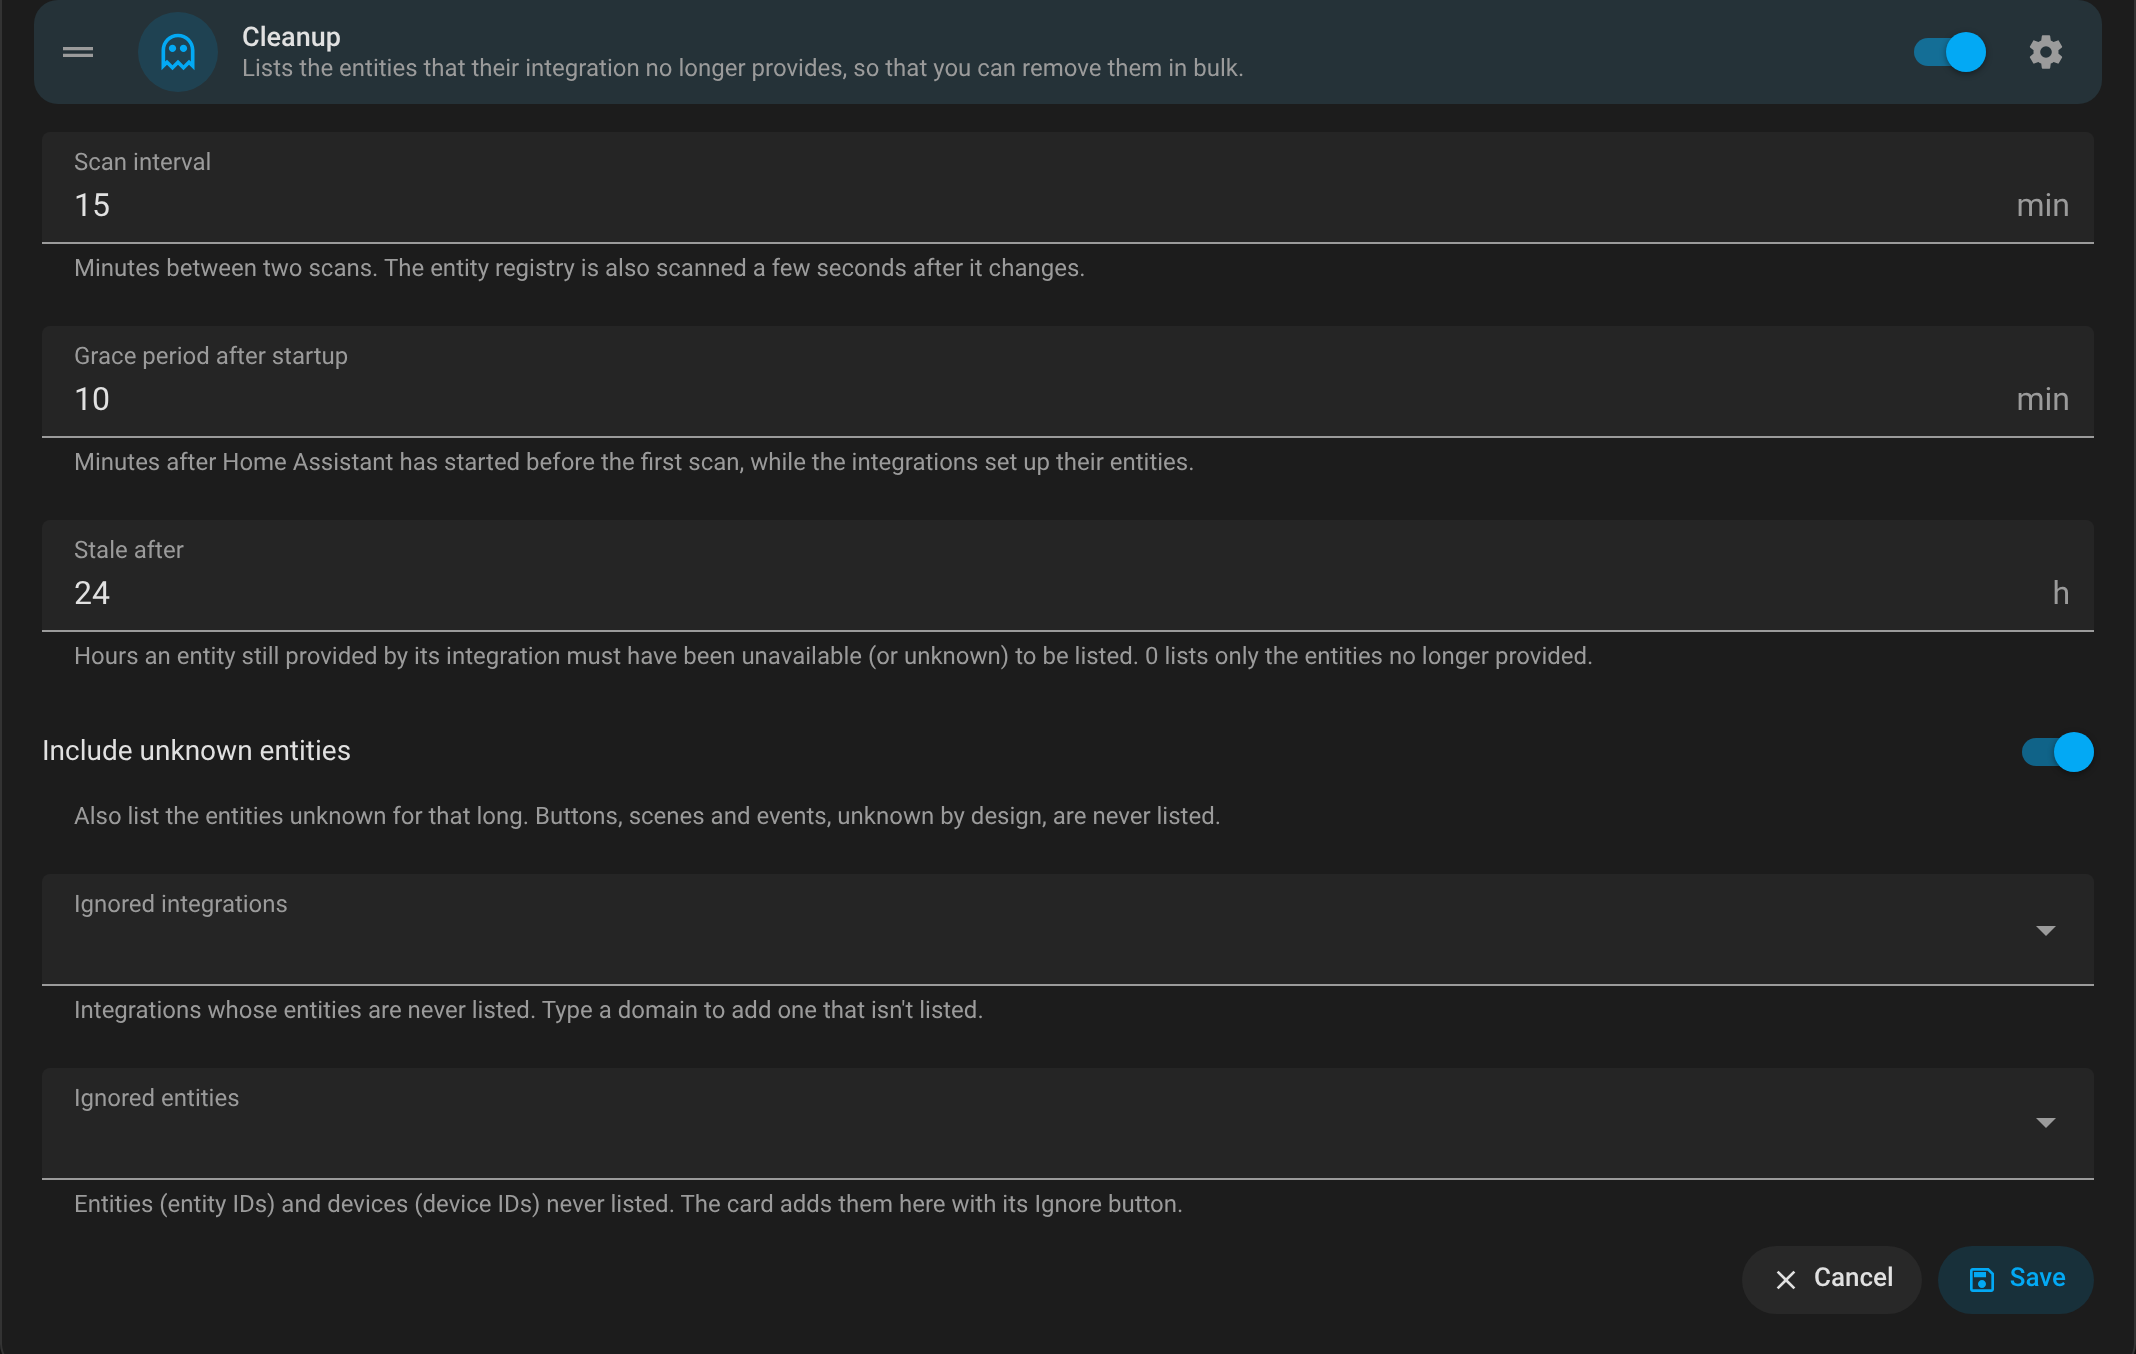 |
Diagnostics
Settings → Devices & services → System Hub → ⋮ → Download diagnostics gives the options, the modules turned on and the state of each one. Integration titles (often an e-mail address or a host), notify actions and tokens are redacted; domains and entry ids are kept.
Sidebar panel
System Hub in the sidebar (administrators only) gathers everything on one page. Under the toolbar: Status, then four groups, System (Resources, Containers, Database, Security), Reliability (Logs, Sentinel, Automations), Maintenance (Updates, Backups, Versioning) and Devices (Silent devices, Batteries, Cleanup), and Settings. A group shows only when one of its modules is turned on; with two modules or more, they are sub-tabs under it, and the group's tab carries a badge with how many of them need a look, in the colour of the worst. The module shown is in the address (/system-hub/watchdog, or a group's name such as /system-hub/devices for its first module), so a link or a reload opens it again. The panel reads the modules every 10 seconds while it is shown.
The sidebar icon is the Status tab's emblem, its badge following the status: a pulse when healthy, ! to watch, × for a problem. Beside it, a count badge shows how many points need a look — the Status tab's total — in the same tone as the emblem (healthy, alert or problem); it goes away when there is nothing to check, like the notifications count. Both are drawn in each browser from the status it reads: the panel when it is open, else an administrator's page every 5 minutes (the panel's own reading, without showing it); the browser keeps the last one, so the sidebar shows it at once.
| Tab | Content |
|---|---|
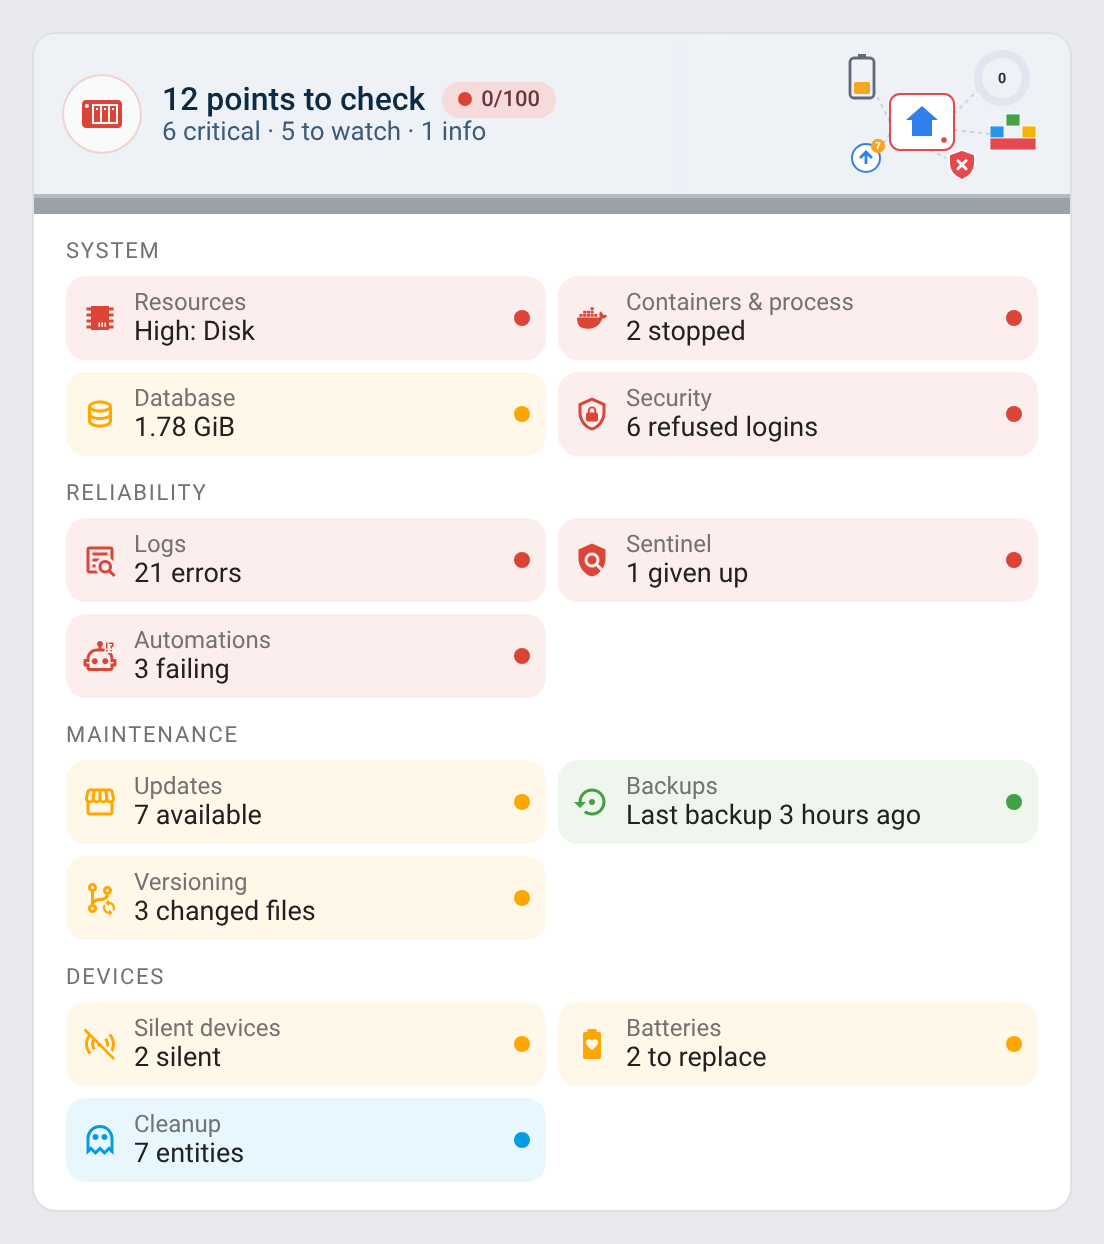
| Status | The health of the instance at a glance: a score out of 100 (100, less 15 per area needing action, 5 per area to watch, 1 per area with something to know) with a home beside it, in the colour of the score (healthy, alert, problem) and one tile per area, by group under the group's name, in the order of the tabs: Resources, Containers & process, Sentinel, Automations, Updates (Core, OS and the Marketplace), Versioning, Batteries, Cleanup; each tile says its level and its details, and opens its tab |
| Resources | CPU, RAM, temperature and disk as rings with their last 24 hours behind them; swap (from its percentage, or its use and free), load, received and sent since the boot, the Home Assistant Core and OS versions (orange with the version available when an update is, a click opens Settings → Updates), uptime, IP address, download and upload, the database size (the File Size integration on home-assistant_v2.db), the last and next automatic backups (orange after 2 days, red after 7 or when the last one failed); history charts of CPU, RAM and temperature, of the network and of the disks, over 1 hour, 6 hours, 24 hours or 7 days (from the recorder), each kind of data in its own colour; the network figures leave out the virtual interfaces (loopback, Docker, hassio, veth…, bridges, tunnels, WireGuard, Tailscale); CPU, RAM, disk, temperature and swap turn orange then red from the thresholds of Settings → System ⚙ (70/90 %, 70/90 %, 80/90 %, 70/85 °C, 50/80 % by default); every disk and the processes System Monitor watches (the stopped ones first), from the System Monitor sensors; a ring, tile or legend opens its entity |
| Database | The size of the database (the file for SQLite, with its write-ahead log; the schema for MariaDB / MySQL, from information_schema; the database for PostgreSQL; orange from 80 % of Settings → Database ⚙, 2 GiB by default, red beyond), its growth over the last 7 days with the line of the last 30 (the daily means of sensor.system_hub_database_database_size), the space a repack would free (SQLite's free pages, MariaDB / MySQL's free space), the retention (orange without automatic purge), the states written in the last 24 hours and the engine; the tables, the biggest first, with their rows (estimated by MariaDB / MySQL and PostgreSQL) and their size (read once an hour, with the count); the devices that wrote the most states in 24 hours (counted once an hour, Count again; an entity without a device counts on its own), each with its room, its entities that wrote, its share and how many of them the recorder already leaves out; a device unfolds to its entities that wrote the most, each with its share; tick devices (all their entities that wrote) or some of their entities to Purge their history (asked first, recorder.purge_entities) or copy the recorder: exclude: lines for configuration.yaml; Purge and repack (asked first: recorder.purge with the retention and repack) |
| Security | Refused logins in 24 hours, administrators without 2FA, long-lived tokens (and the unused ones), the external URL; Scan now. Refused logins over 7 days by address: Internet or local network, how many, the last one and its URL, banned or not, Ignore (saved at once, no reload); whether the automatic IP ban is on and how many addresses ip_bans.yaml holds. Home Assistant keeps no history of them: the module records them as Home Assistant logs them (homeassistant.components.http.ban, at the warning level), from when it is turned on. Each one from the Internet makes a persistent notification (once an hour per address, also sent to the notify actions chosen; turned off in Settings → Security ⚙). Accounts: role, local login only, 2FA, last activity, sessions. Long-lived tokens: account, created, last use and from where; unused beyond Token unused after (90 days by default); Revoke (asked first). Exposure: external URL over HTTPS, trusted proxies, IP ban, Home Assistant Cloud. Add-ons (Home Assistant OS and Supervised): protection mode off, full hardware access, host network, security rating; an add-on that needs its protection mode off (an SSH terminal, say) can be Allowed from the list or in Add-ons allowed unprotected of Settings → Security ⚙: still listed, it is no longer a problem. Configuration: passwords, tokens and keys written in clear in the YAML files instead of !secret (the file, the line and the key, never the value). The add-ons and the files are read again once an hour |
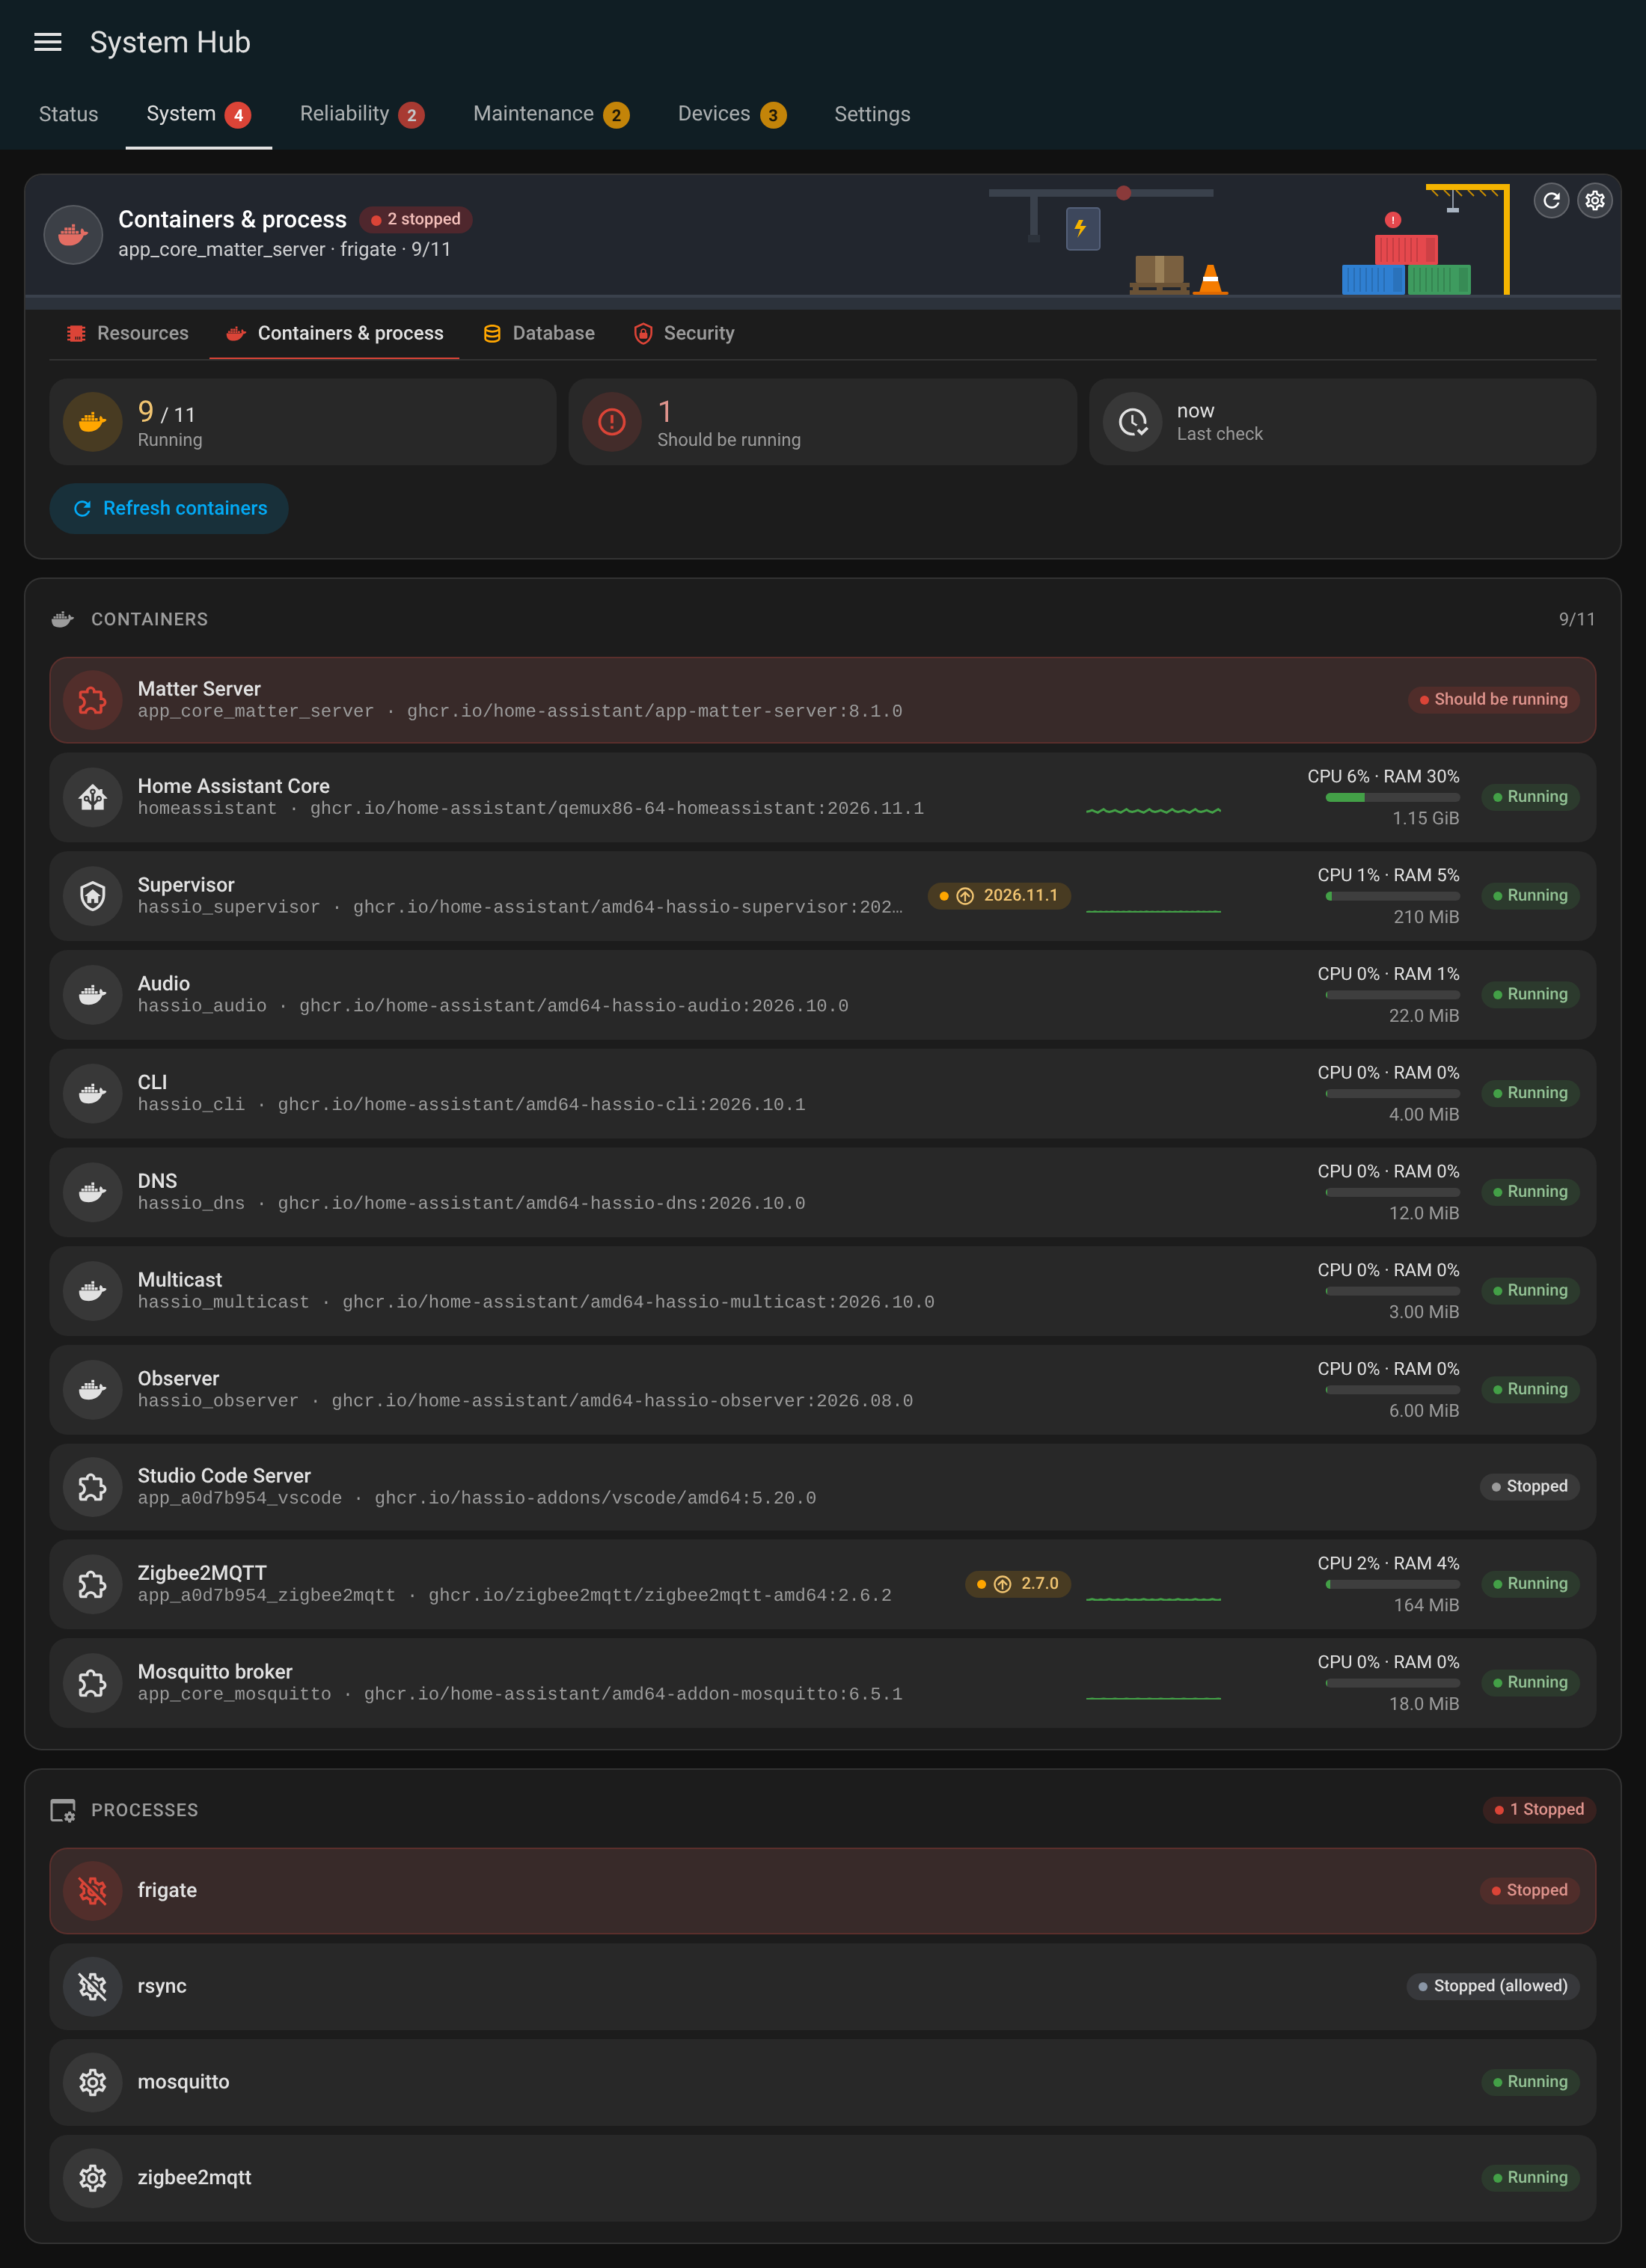
| Containers | Running and stopped containers, last read; every container with its state, version and update, CPU, RAM and the last 24 hours of CPU; Refresh |
| Logs | Errors, warnings, integrations concerned and messages ignored; a level (errors, warnings, all) and a period (1 h, 24 h, since start); the messages by integration, the most errors first (red from Errors that make a problem of Settings → Logs ⚙, 10 by default; only those frequent errors are a problem on the Status tab, occasional ones leave it in good health), each with how many times it came, when, its logger and source, its traceback; Reload the integration, Ignore a message (saved at once, no reload), Full log, Clear the log (asked first) |
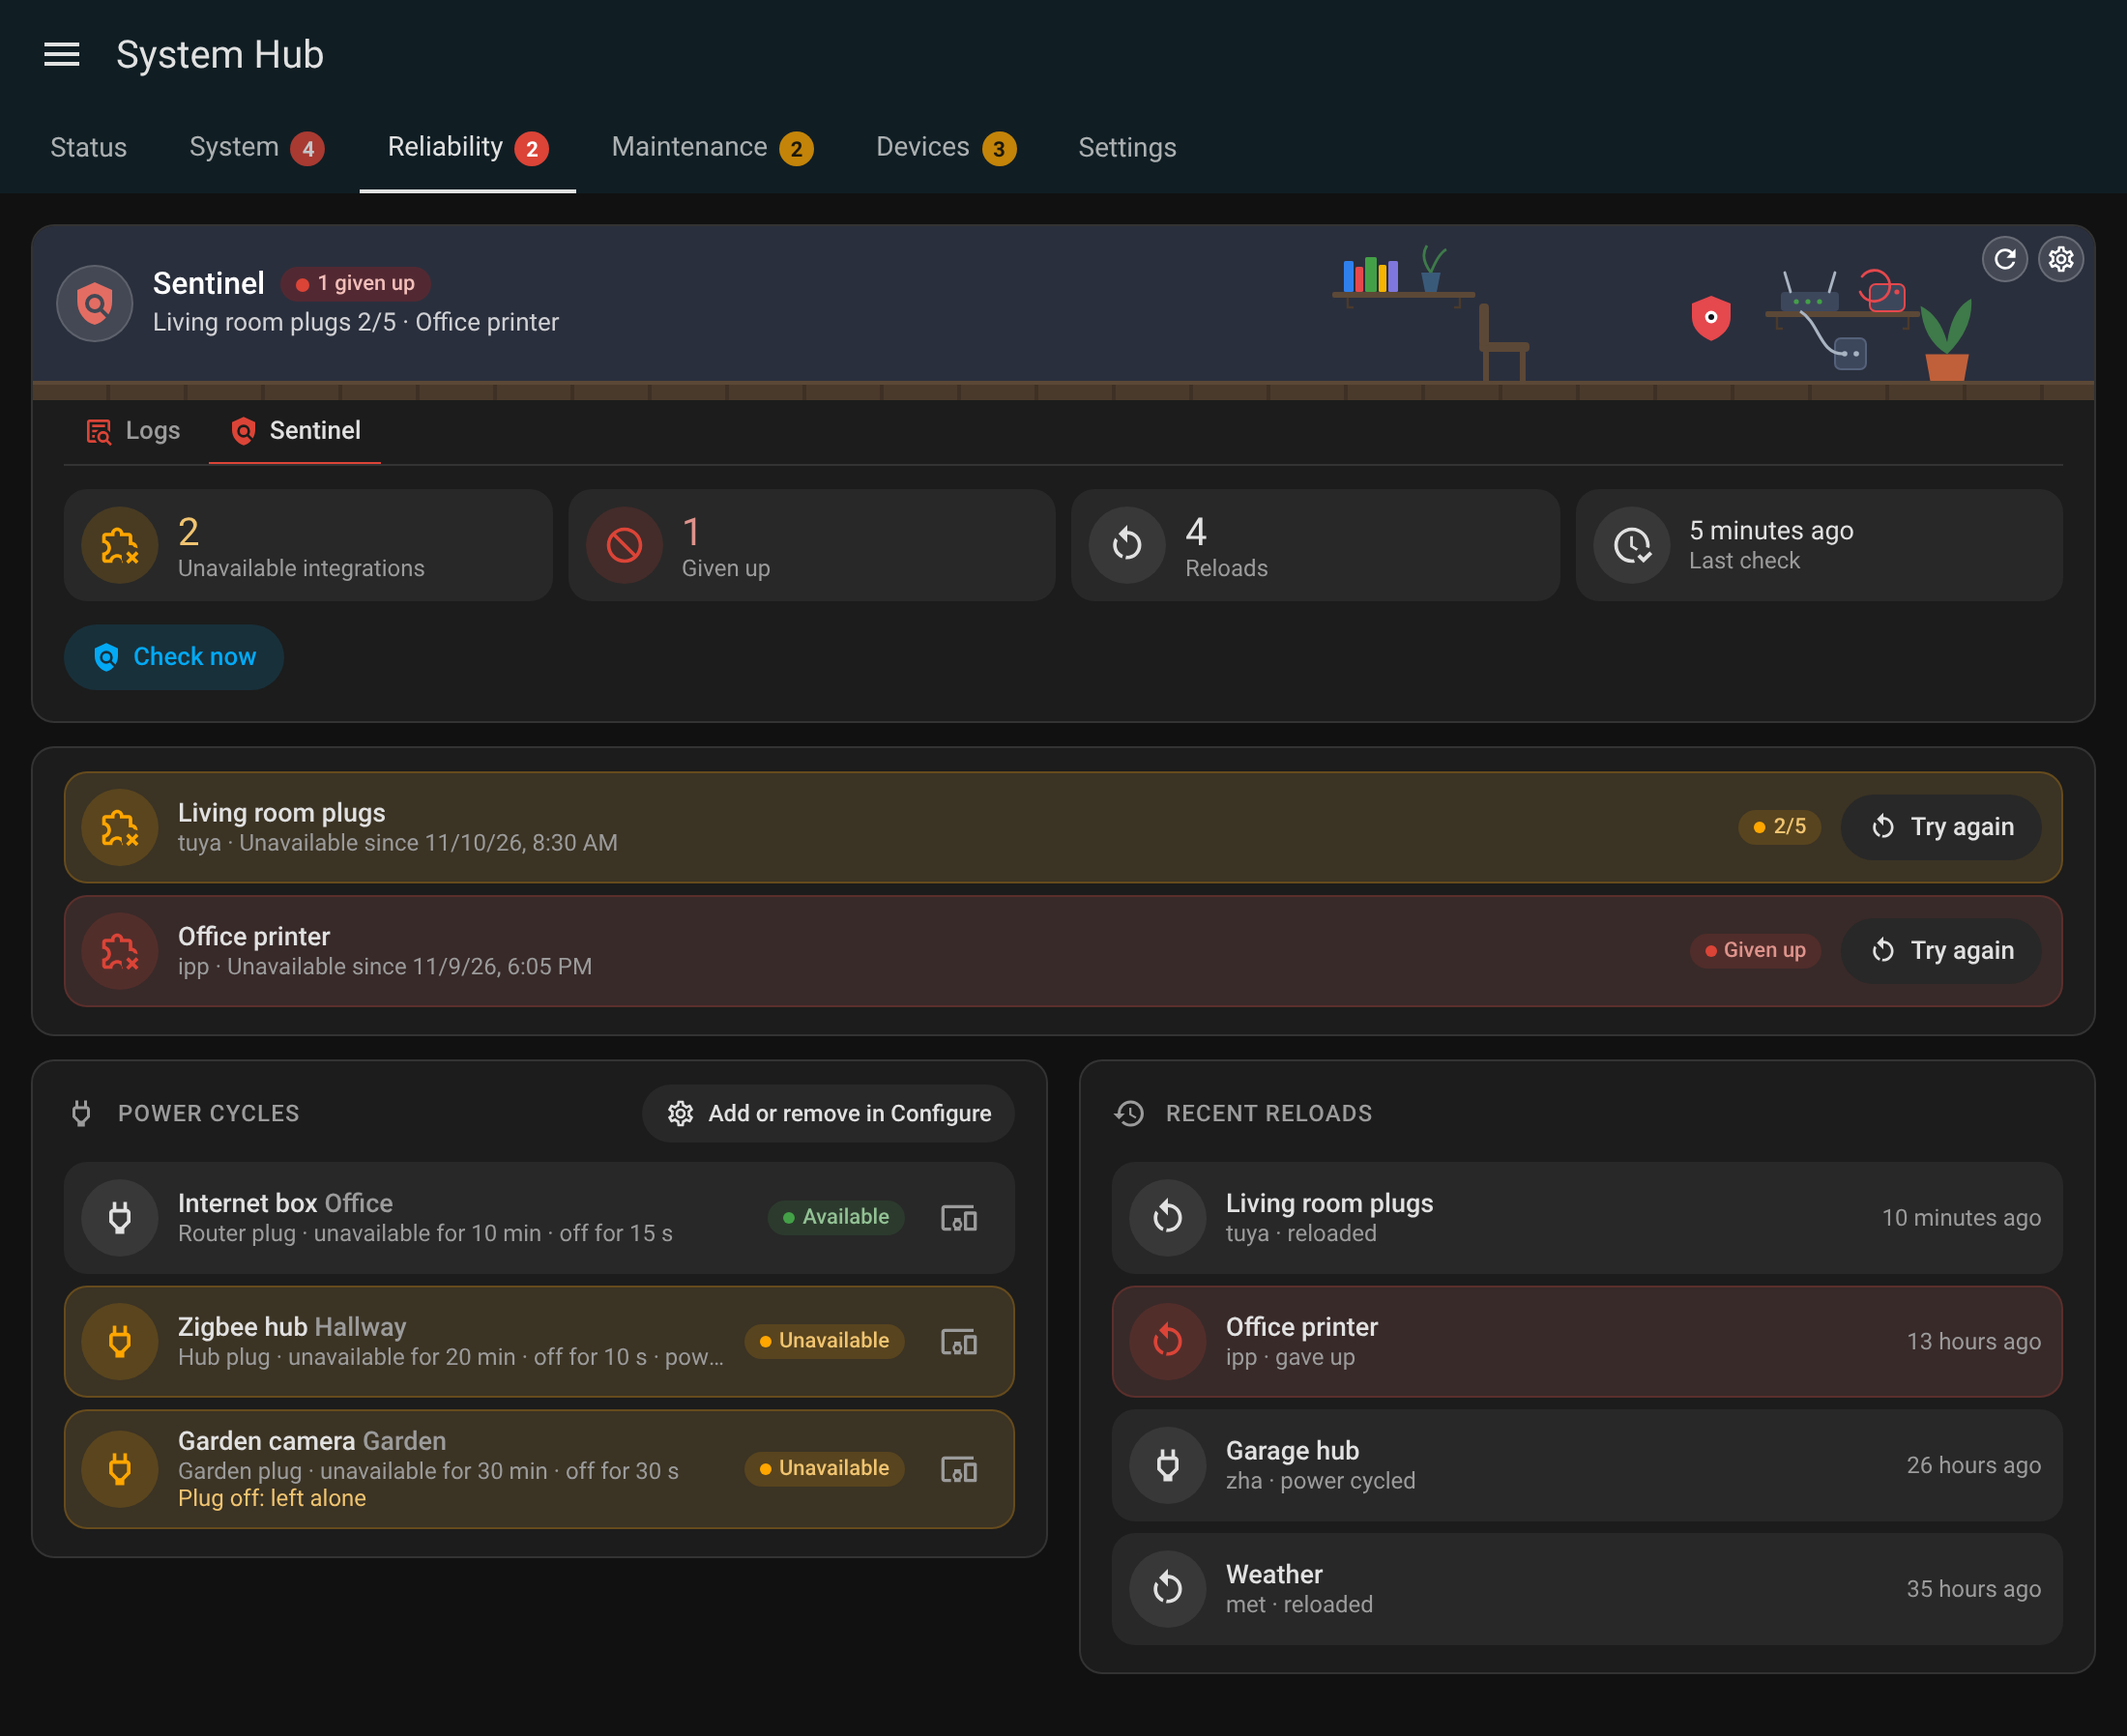
| Sentinel | Unavailable and given-up integrations, reloads, last check; Check now, Try again on each integration; the power cycles set up (device and room, plug and its state, delays, status, count, the device's page; added and removed in Settings → Sentinel ⚙); the recent reloads and power cycles |
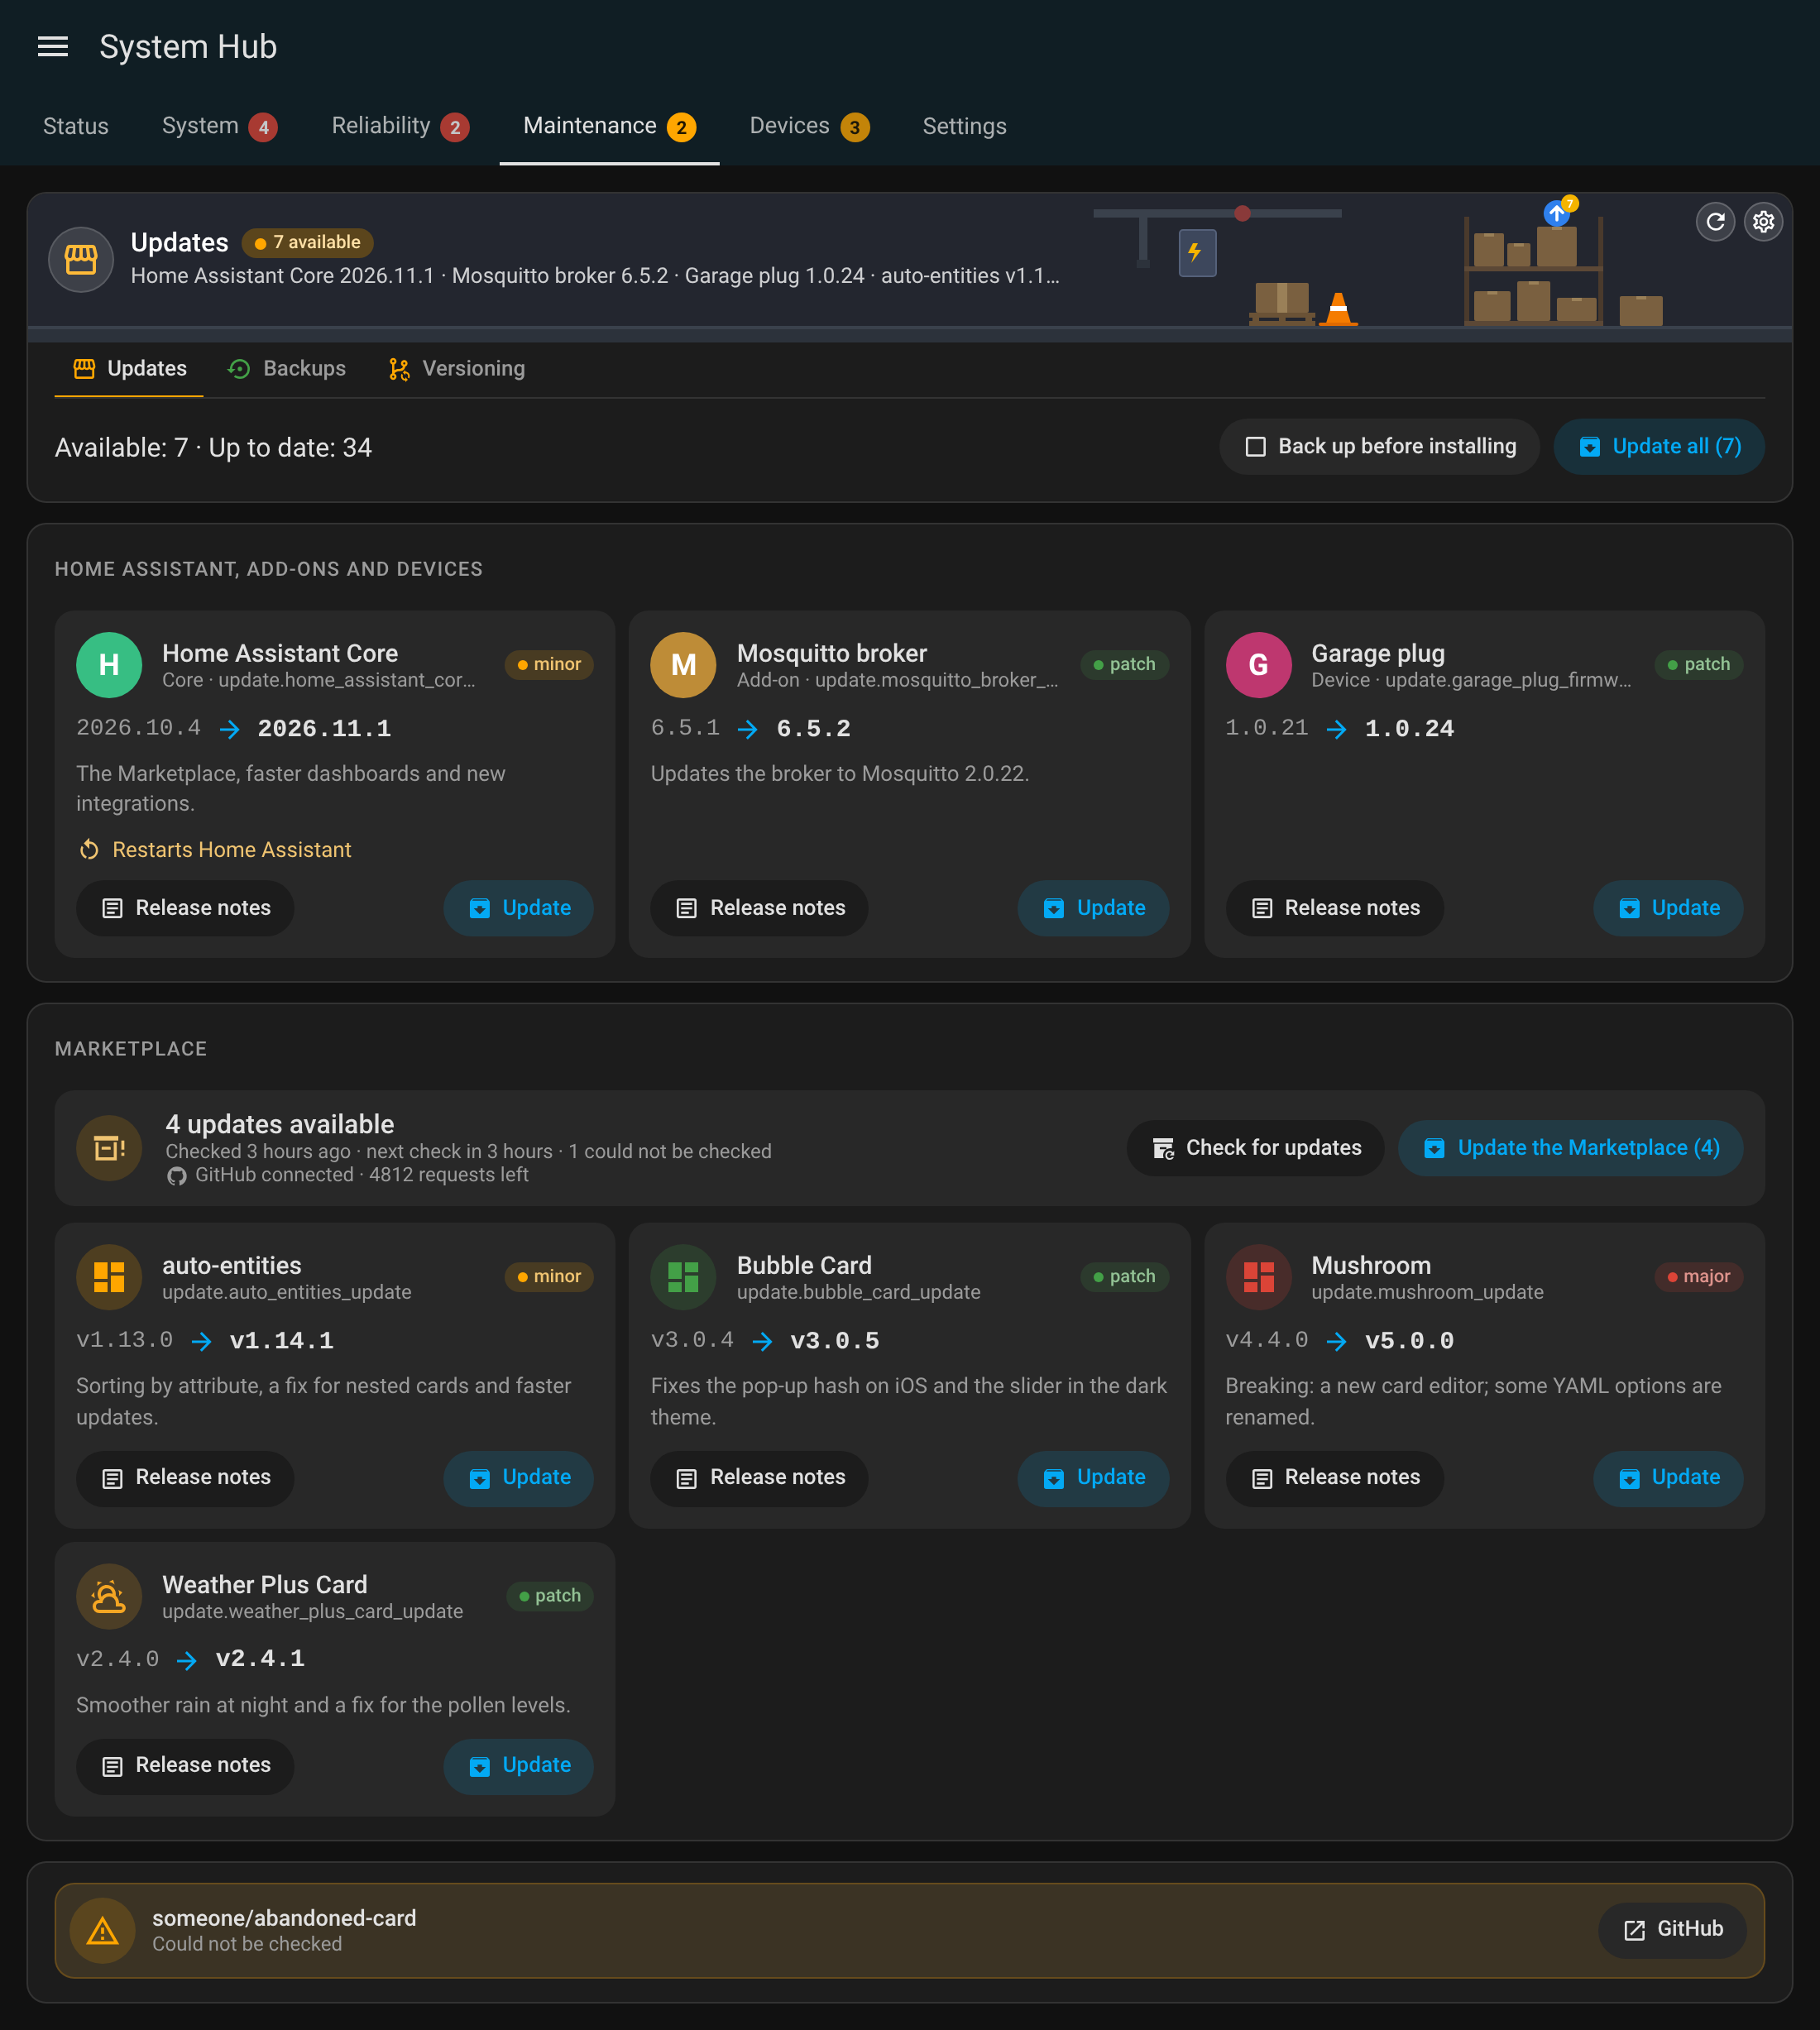
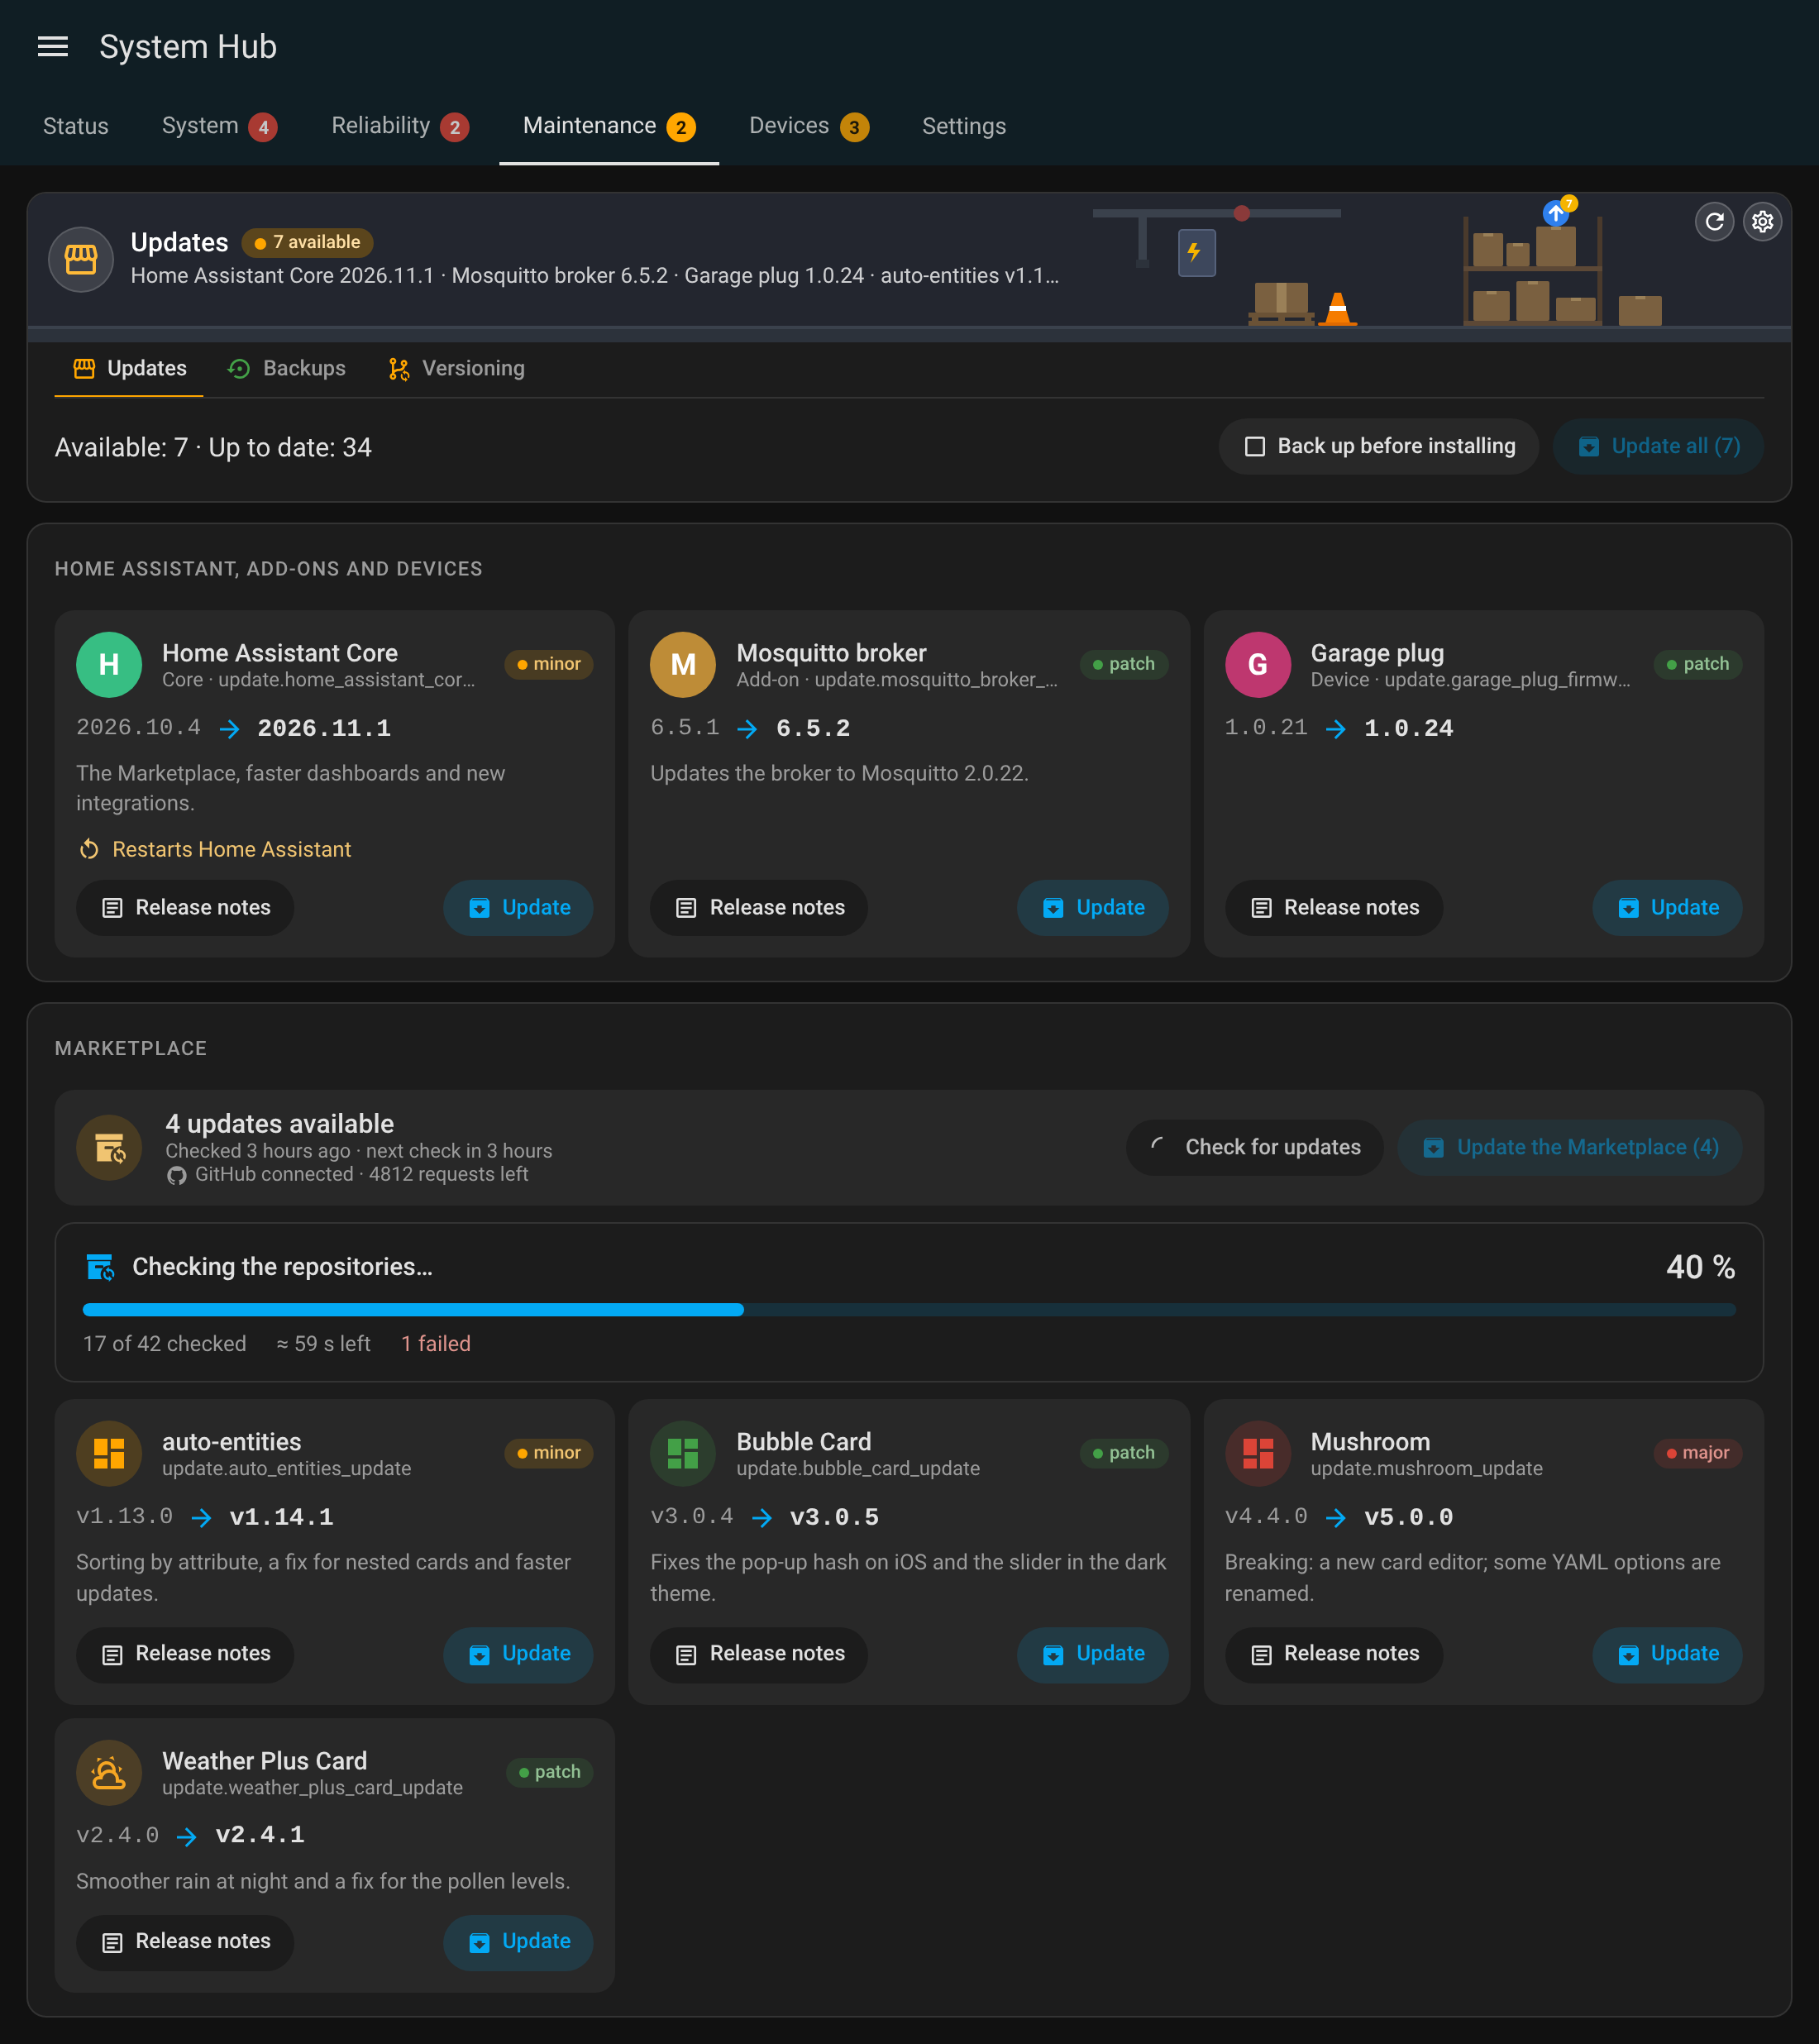
| Updates | Home Assistant (Core, Supervisor, OS), Add-ons and Devices and services (every other update entity: device firmware, software of an integration): a card per update with its logo (its picture, else its integration's logo), its versions, the size of the change, the start of its release notes and what it restarts; Install asks first and runs Home Assistant's update.install, with a backup first when Back up before installing is ticked and the update can make one (ticked by default when the Updates settings back up before installing); how many are up to date; Update all (asked first) installs every update of the tab one after the other: the Marketplace repositories, the add-ons, the devices and services, the Supervisor, then Core (or OS when Core is up to date) last as Home Assistant restarts. While installs run, a progress card says what is going on — Backing up Home Assistant… during the backup first, then Installing 2 / 5: name with the share done of the current update when its entity reports it (update_percentage, else a moving bar) — and each card being installed shows its percentage next to its button and a thin bar along its bottom, the next Marketplace ones Waiting. Then Marketplace: a header with the updates available, the last and next check, the repositories that could not be checked and GitHub (account connected, requests left, next try after the limit); Check for updates, Update all (asked first); while a check runs, its progress bar, the share done, the time left and the failures (read every 2 seconds); then a card per update: logo (the integration's brand icon; for a project of juju35 without one, a card, its icon from the showcase site; else its initial), installed → latest version with the size of the change (major, minor, patch), the start of its release notes, Release notes and its own Update; the repositories that could not be checked with a link to GitHub |
| Backups | The last successful automatic backup (orange beyond the age of Settings → Backups ⚙, 3 days by default; red when the last attempt failed), the next one, the size of the last one and the locations up to date; Back up now (Home Assistant's automatic backup, with its settings) and Backup settings; each location with its last copy, the backups it keeps and its error; the last 30 days, a square per day with a backup; the 10 latest backups (automatic or manual, size, locations), each opening its page in Settings → Backups |
| Silent devices | The silent devices, the weak signals, the devices followed and the ones ignored; a filter per integration; each device with its room, its integration, when it was last heard (or since when it is unavailable), its LQI or RSSI and its battery, Device (its page) and Ignore (saved at once in Settings → Silent devices ⚙, no reload). A device is followed when one of its entities comes from a chosen integration; it was last heard when one of its entities last reported a state, even an unchanged one; it is silent beyond Silent after (24 h on a battery and on mains by default) or with every entity unavailable. After a restart of Home Assistant, every device counts as heard at the start. List, Zigbee network and Matter network (offered when such devices are in the device registry): the network as a graph of forces, each node with its name and room (or, when silent, since when) beside it; the coordinator and the Matter networks as squares, the routers as circles, the end devices as small circles, the silent ones red. Each link points to the parent: coloured by its LQI (green 100 and over, amber 50 to 99, red below 50) and thicker when stronger, dashed for an end device, dotted for the mesh between routers, dashed red to the last parent of a silent device. The wheel zooms, a drag moves the map; the pointer over a node leaves it and its neighbours standing out and shows its role, status, LQI, parent, model and room. Search fades every device whose name or room does not hold it; the buttons read the network again, fit it to the screen, show or hide the names and keep only the silent devices and the routers they hang from. A device clicked is detailed below the map (role, room, last heard, parent and LQI, battery, Device, Ignore); List by router unfolds the same network as a tree. ZHA is read with zha/devices; Zigbee2MQTT is asked for its network map on zigbee2mqtt/bridge/request/networkmap (default base topic, a scan of a minute or more); Matter, which gives no neighbour table, shows each node under its network (Thread and its name, Wi-Fi, Ethernet), a bridge's devices under it, from matter/node_diagnostics. A network is read when its view is shown, again after 5 minutes or with the refresh button |
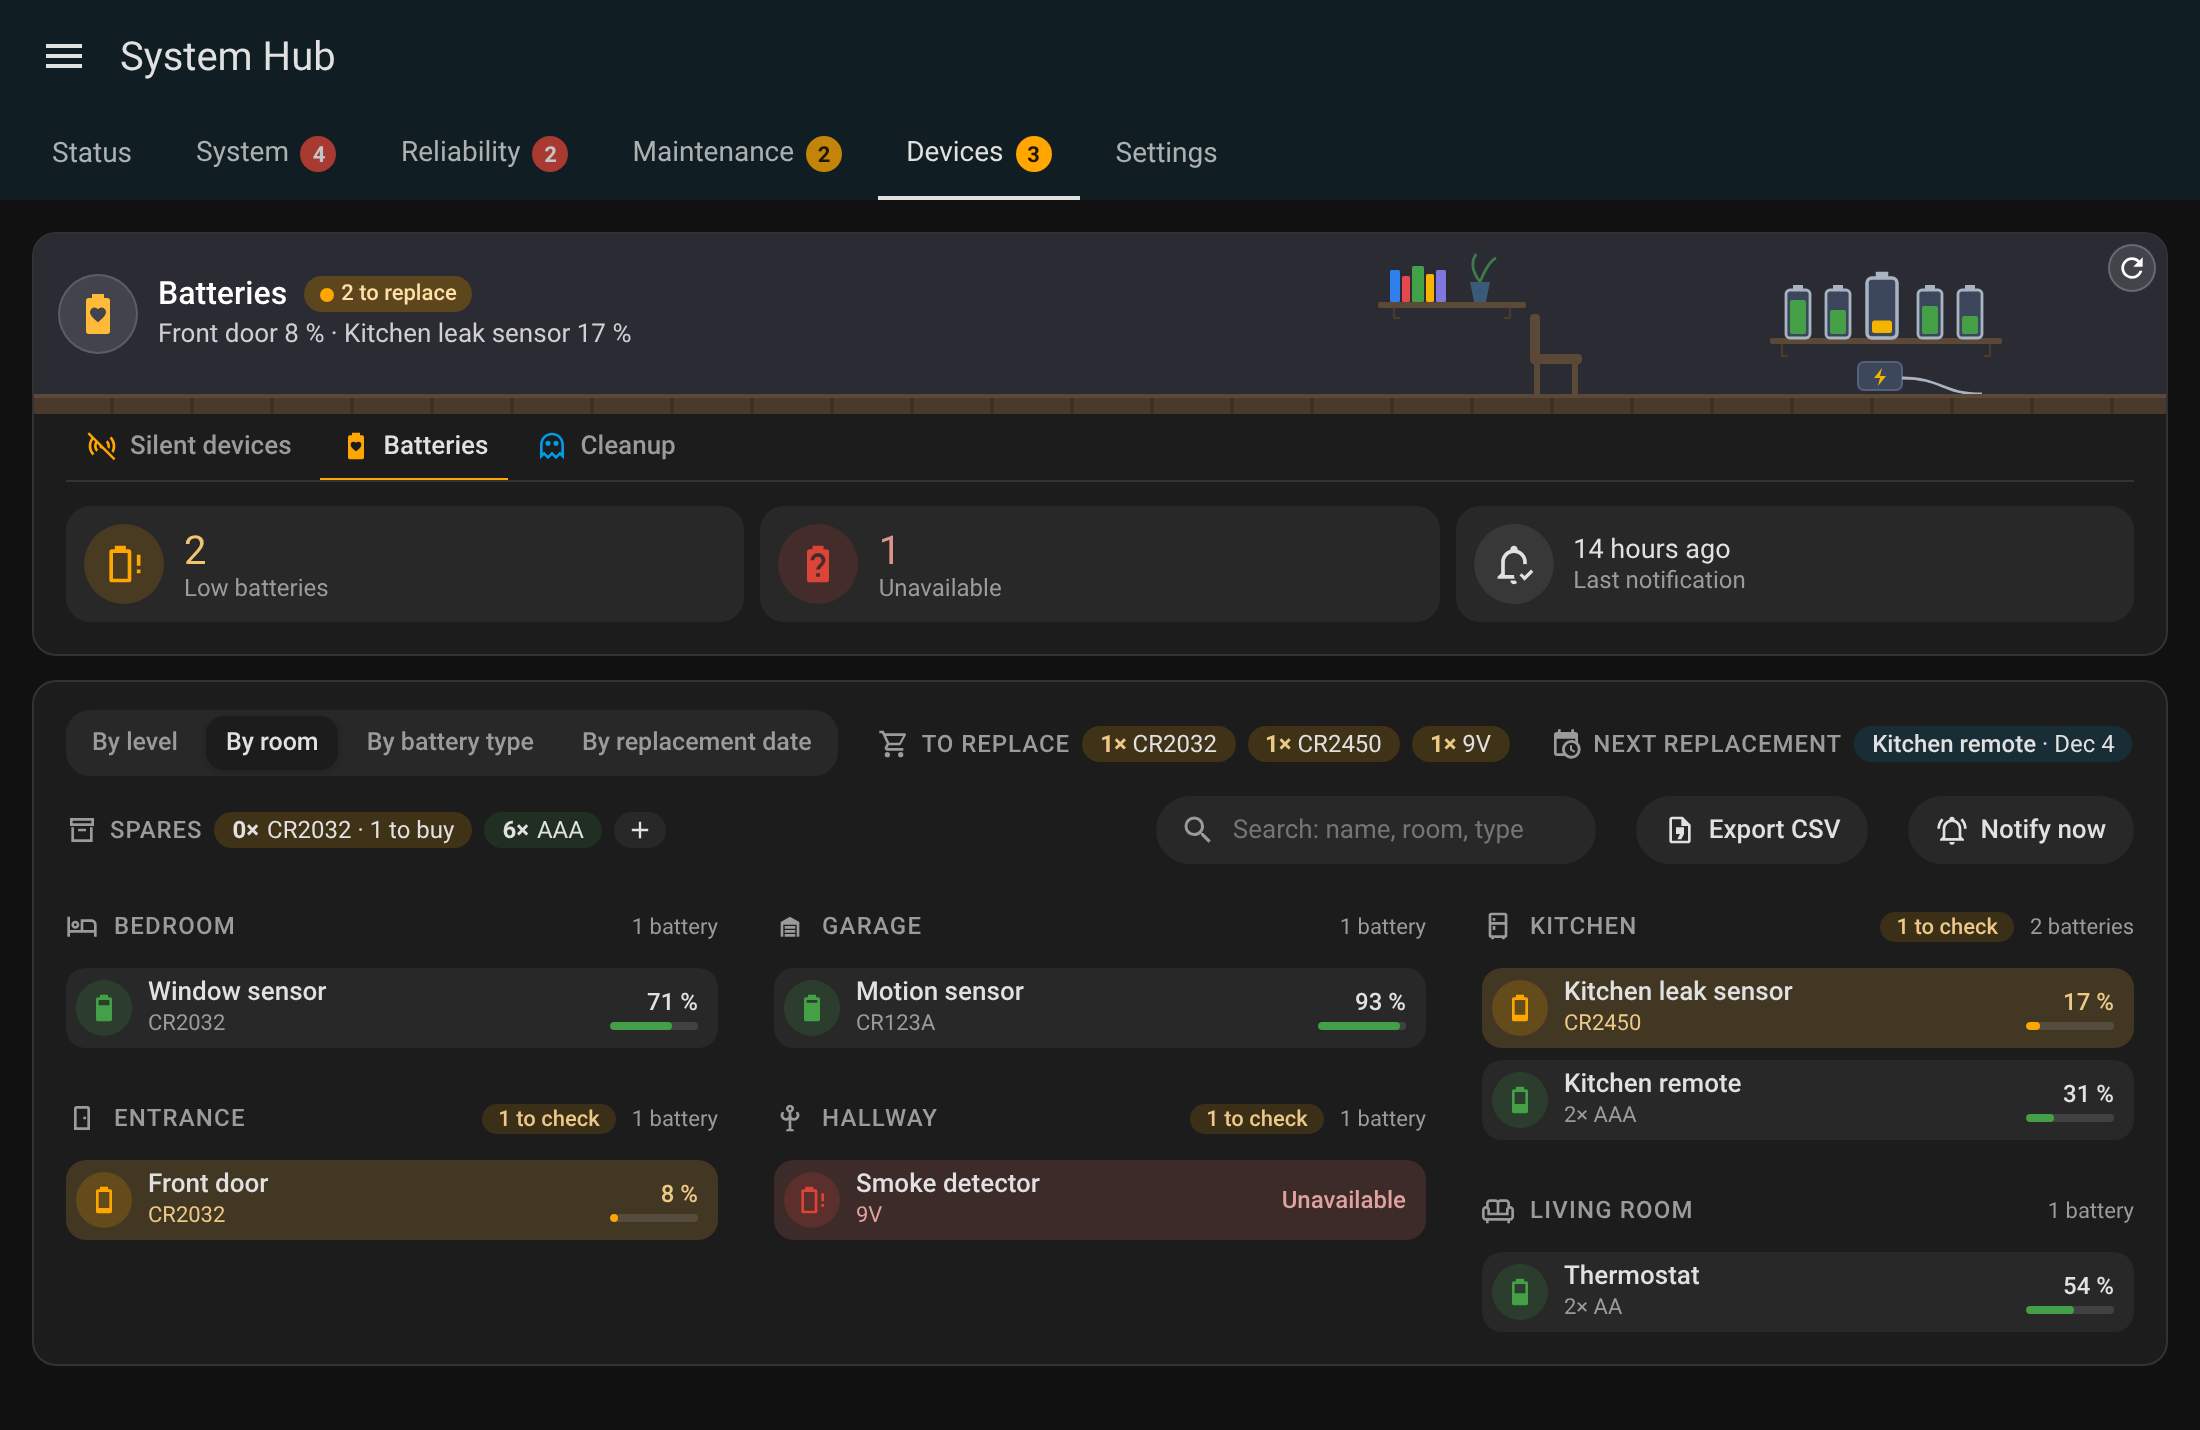
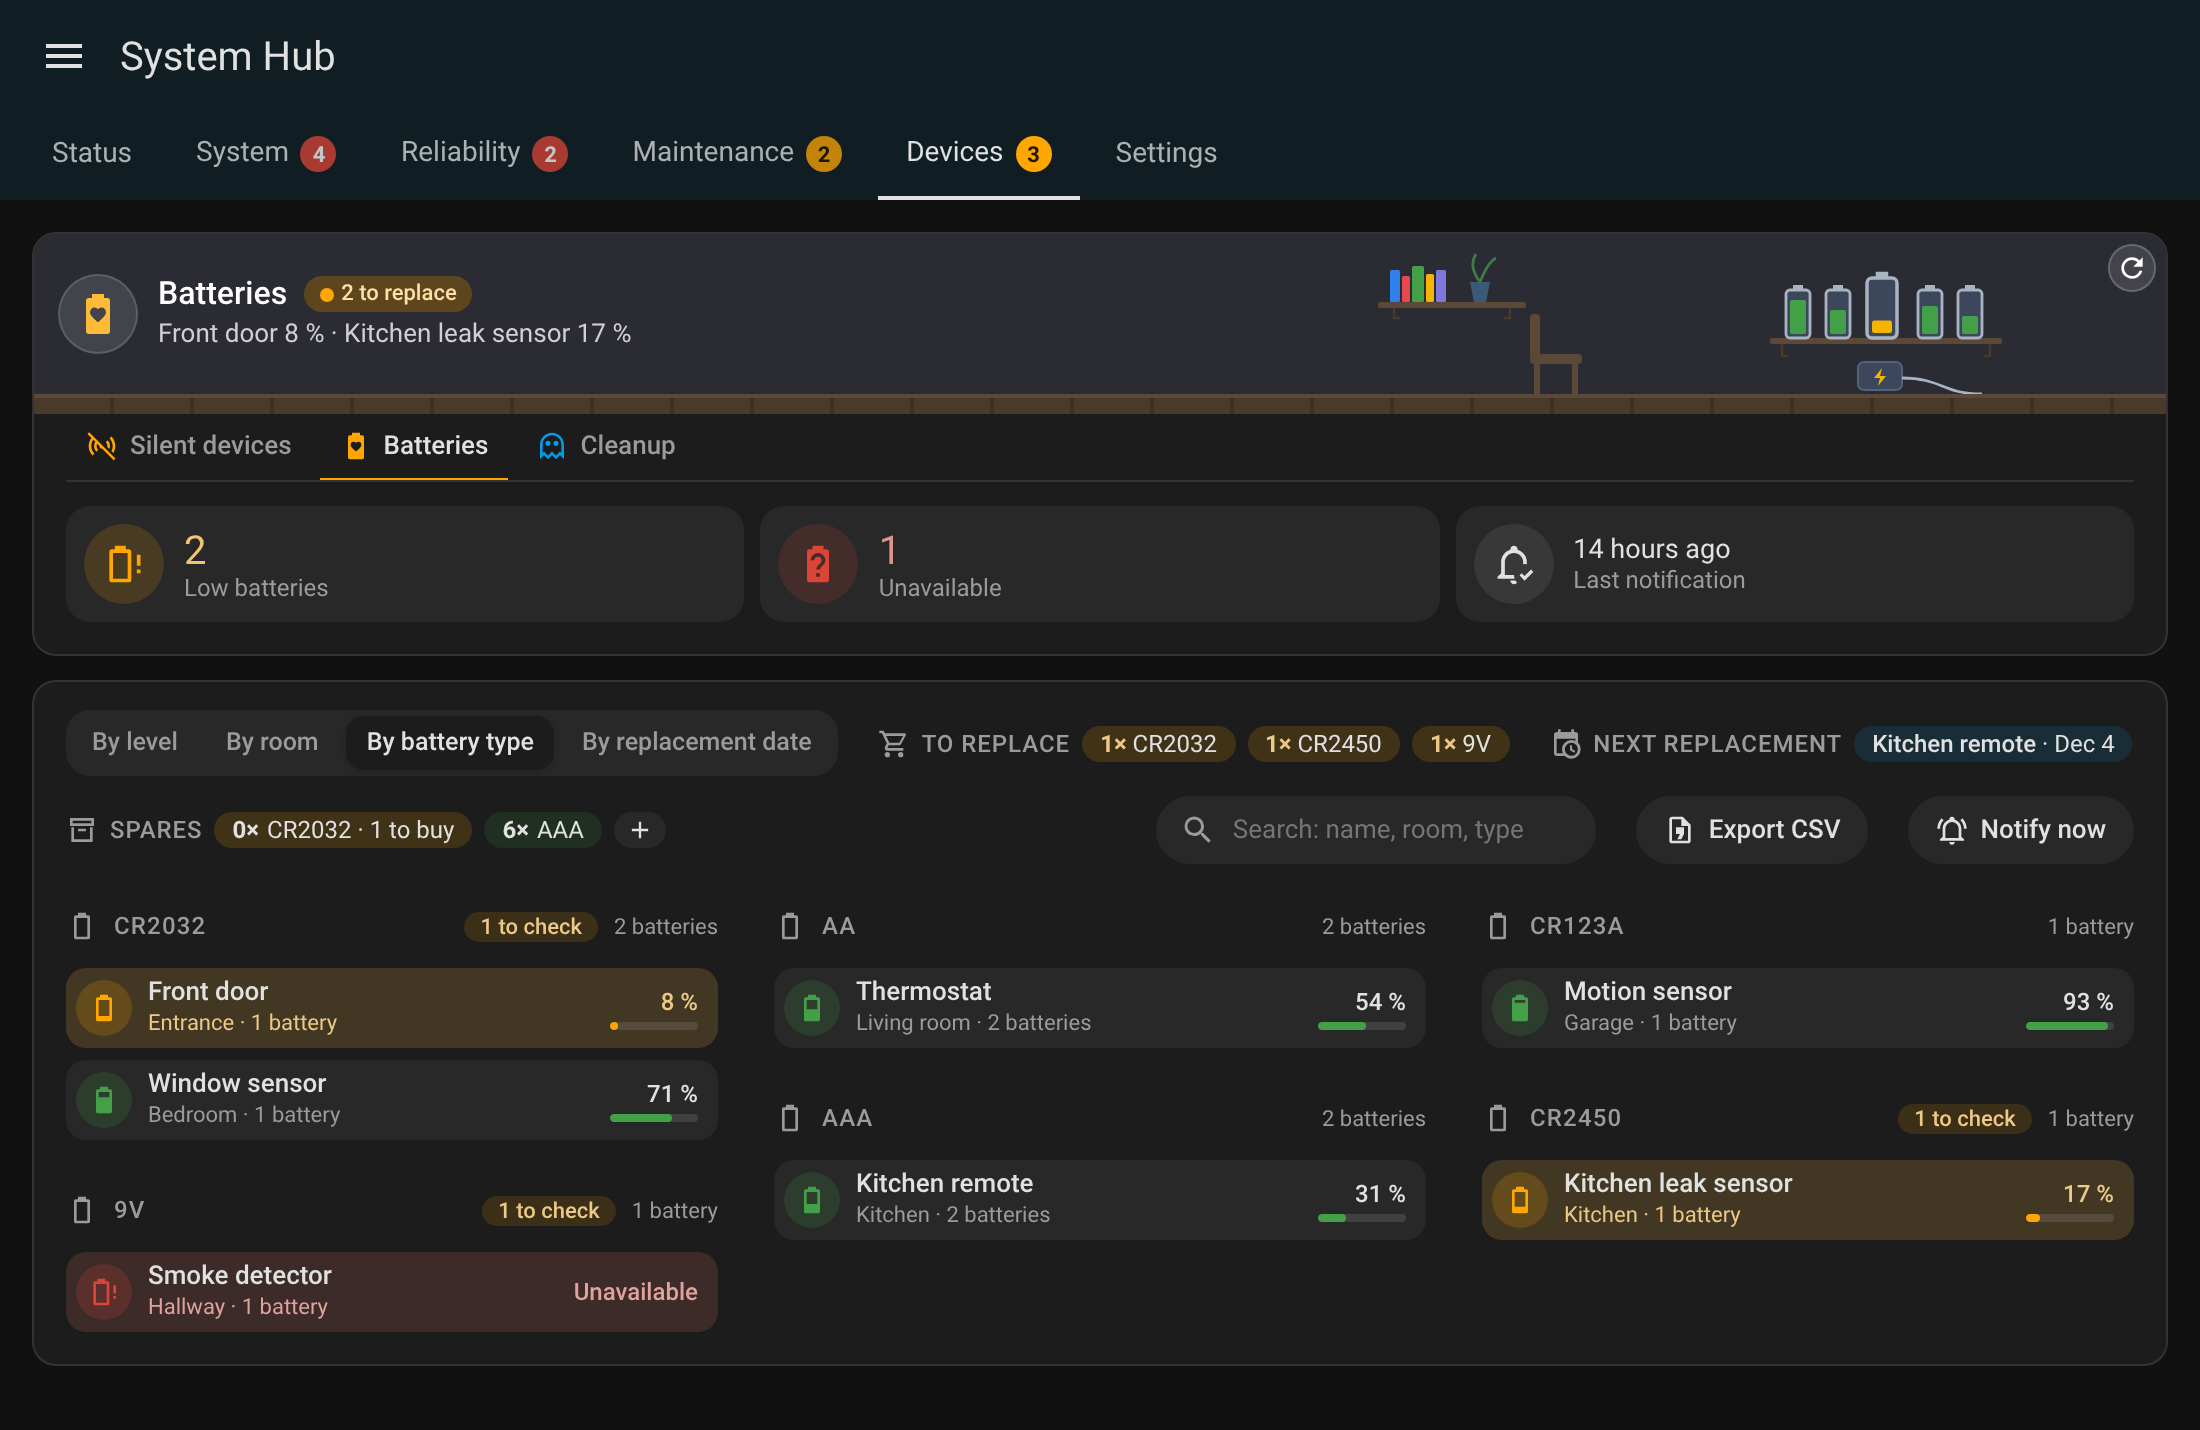
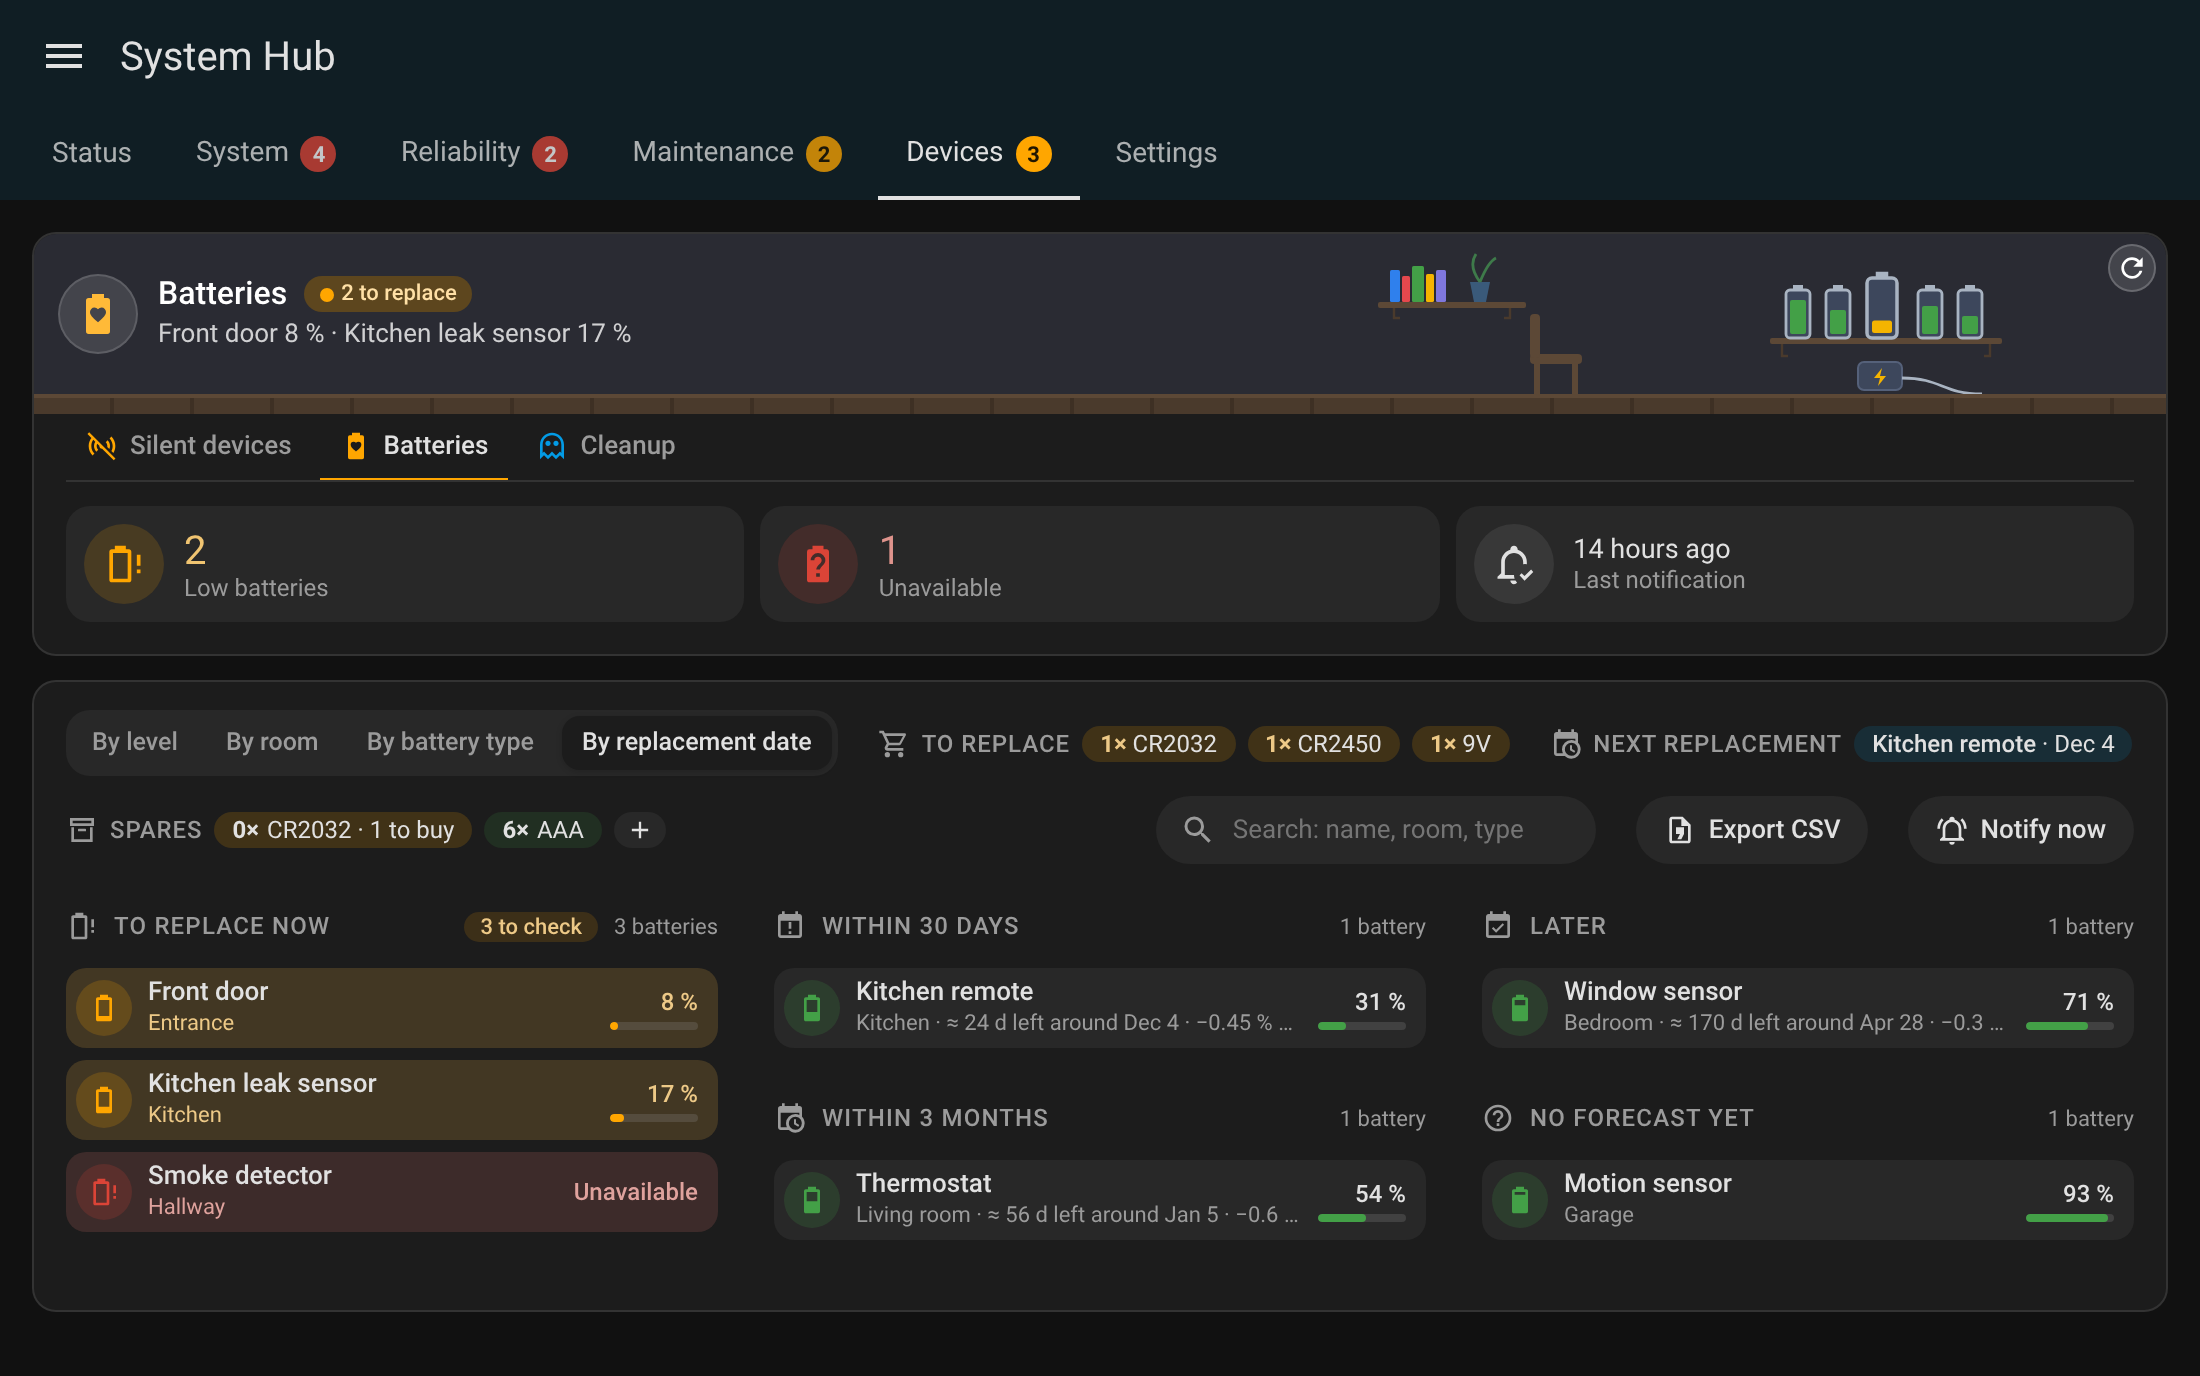
| Batteries | Low and unavailable batteries, last notification; every battery by level (the ones in error first, then the lowest), by room, by battery type or by replacement date (back to by level once another tab is shown); a search by name, room or type; the spare batteries by type (in stock, to buy for the batteries low or due within 30 days), a click sets a type's stock; Export CSV; Notify now |
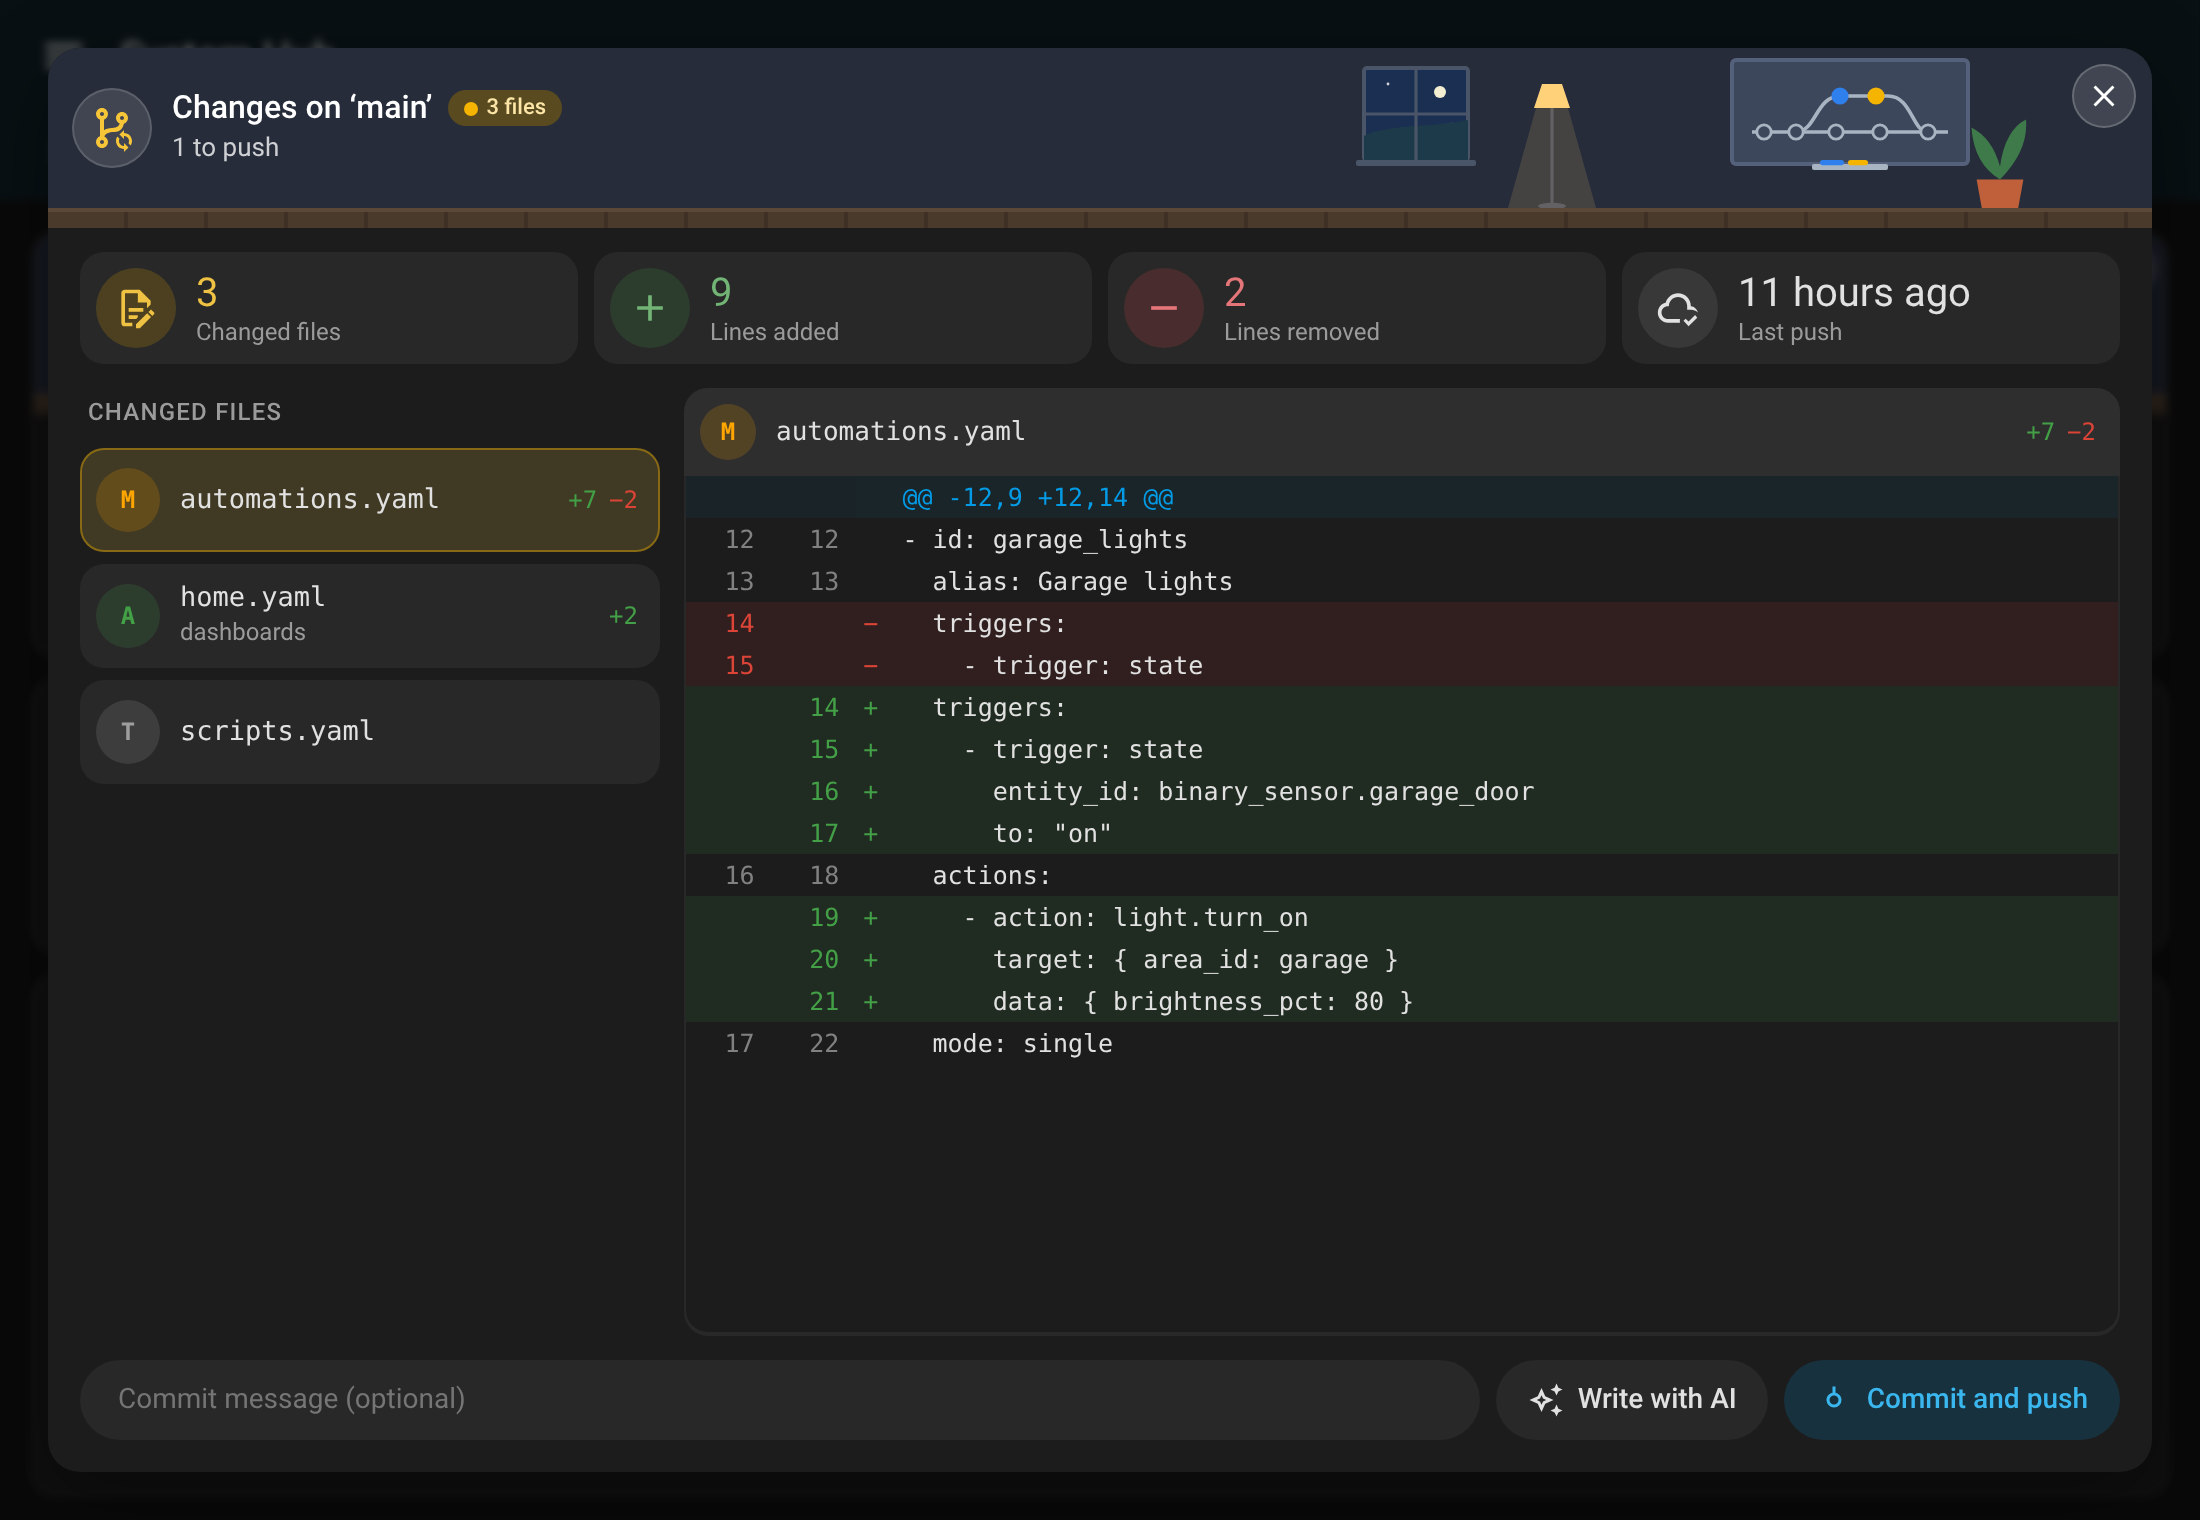
| Versioning | Branch and status, changed files, last commit and push; a commit message (or Write with AI), Commit and push, View changes (the diff of each file, as in an editor's source control view), Pull, Export dashboards |
| Automations | Failed automations, unavailable linked entities, last failure; each failure with its error, failed step and failures in a row, Trace, Edit, Clear; each unavailable entity with the automations, scripts and scenes using it; Clear all (asked first), Refresh (rebuilds the list of linked entities); lists folded from their title, 5 items then Show more |
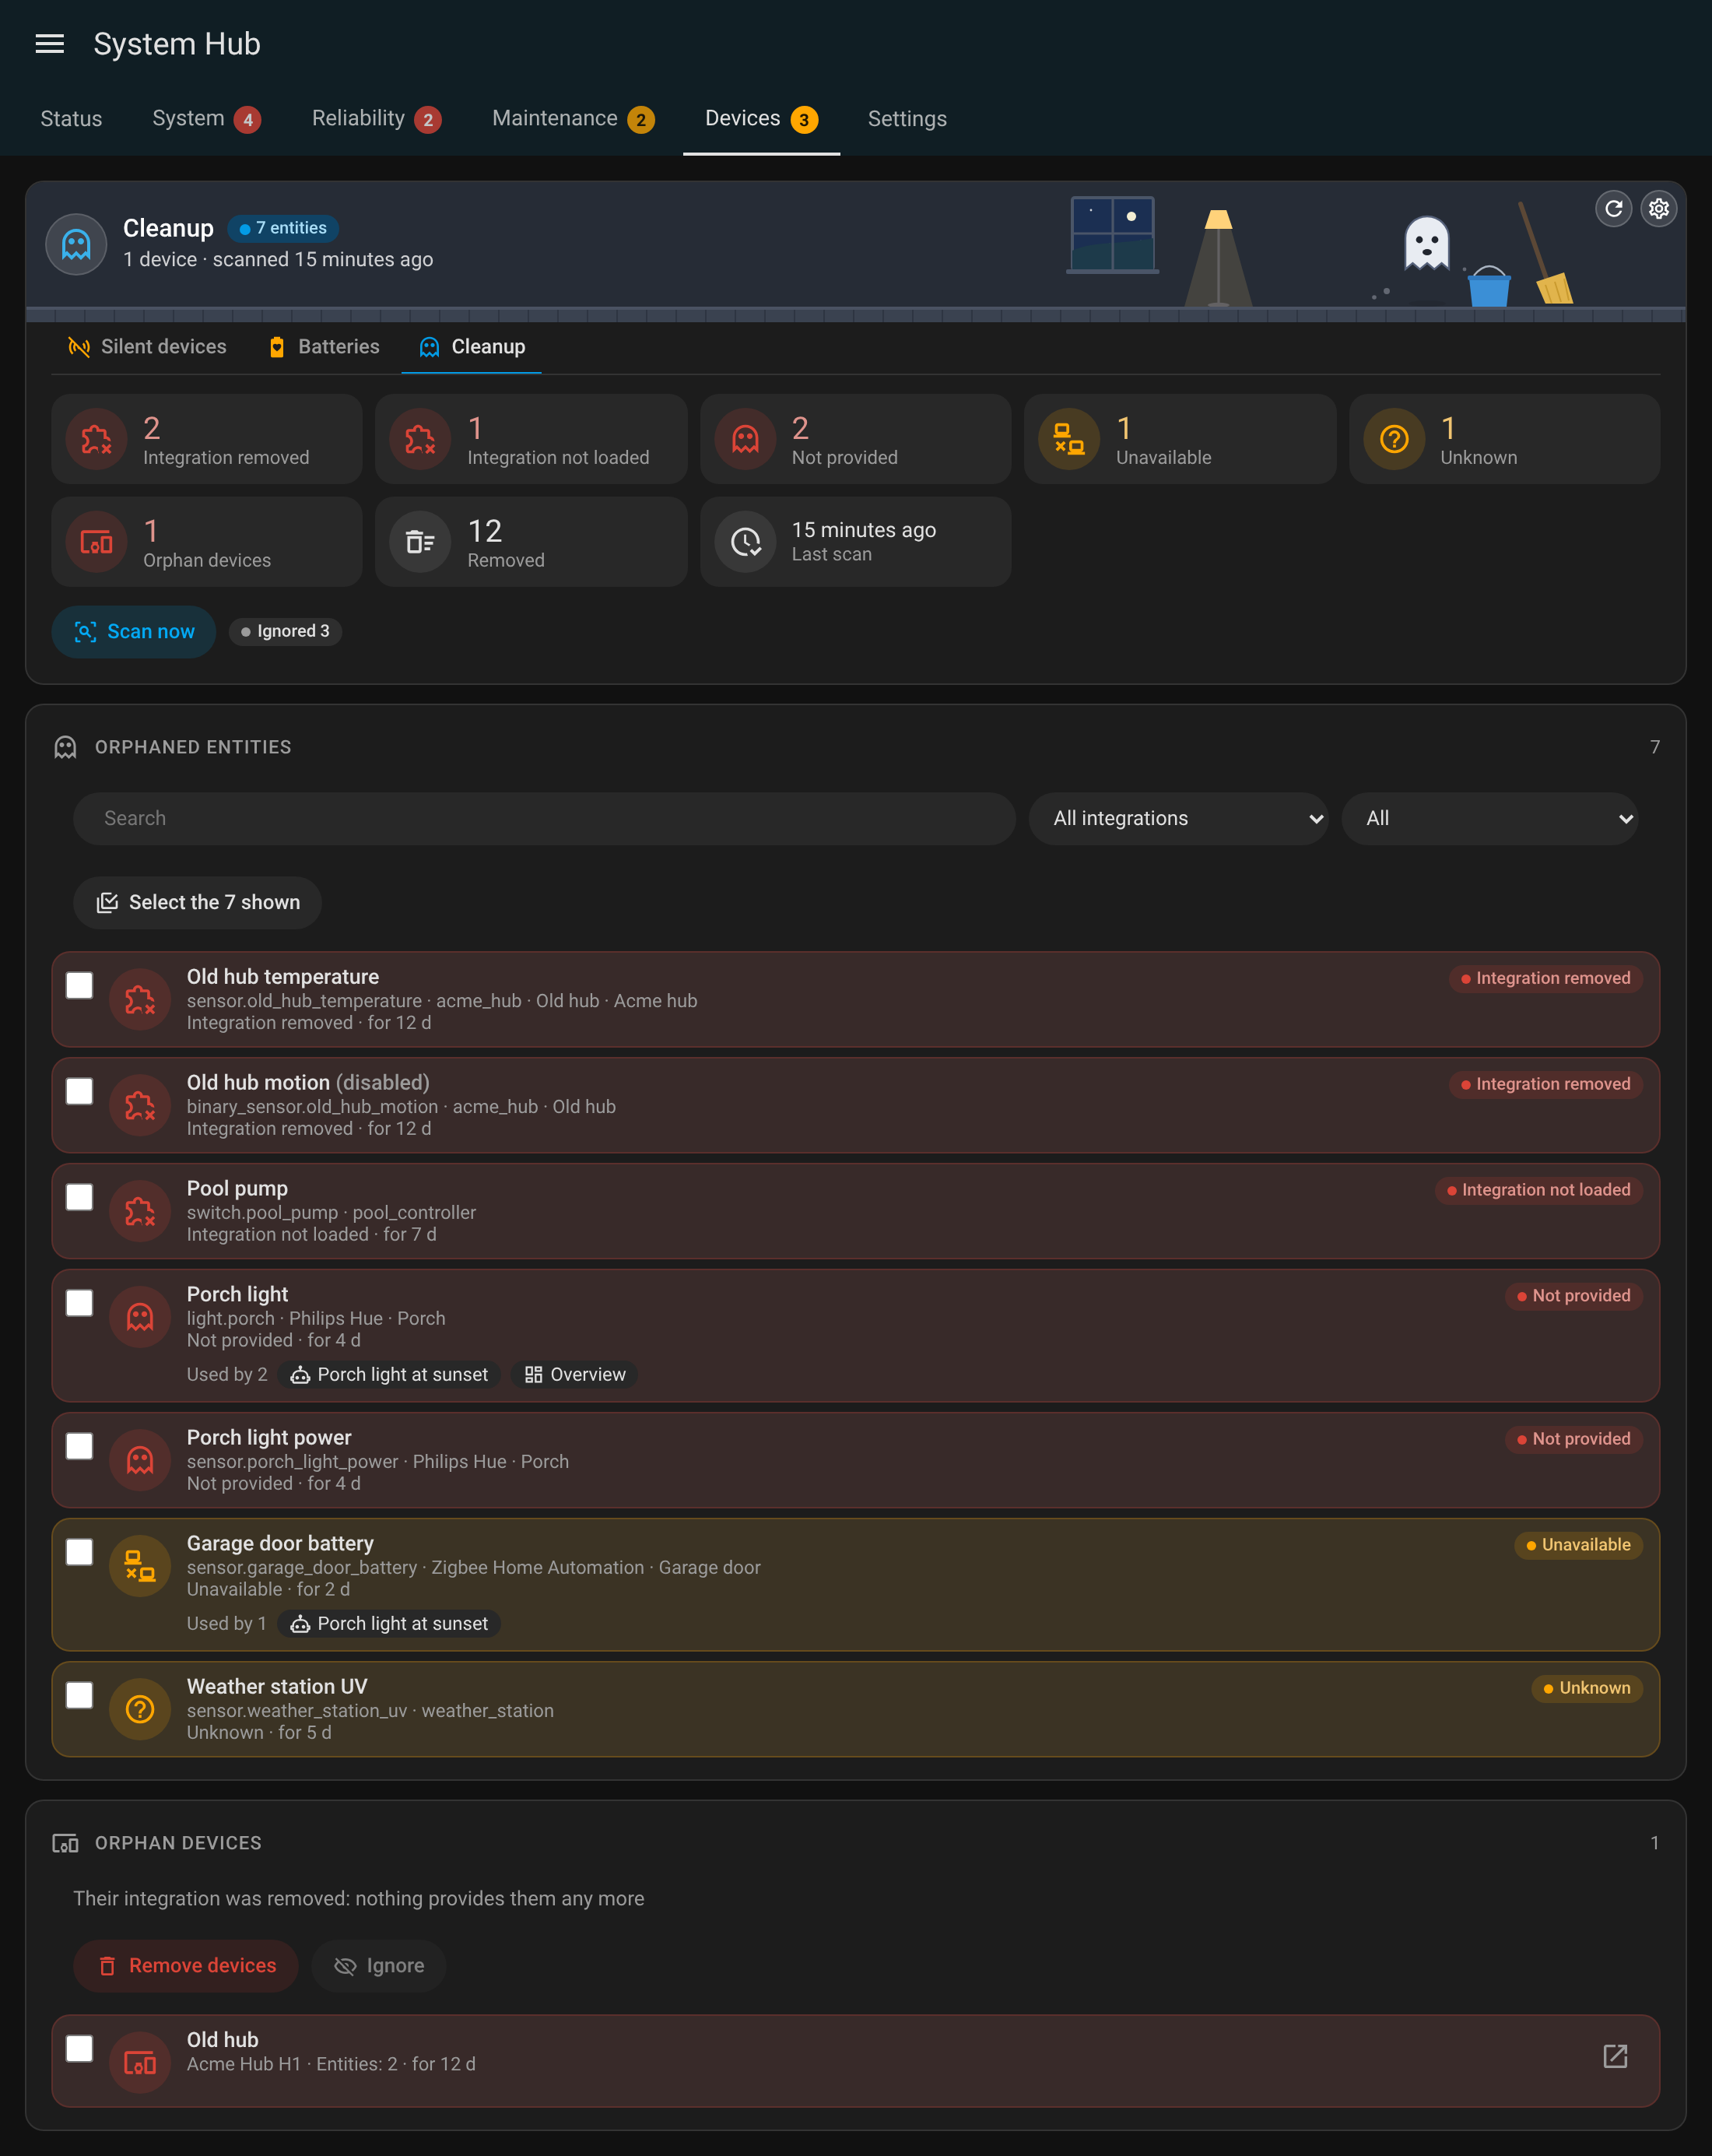
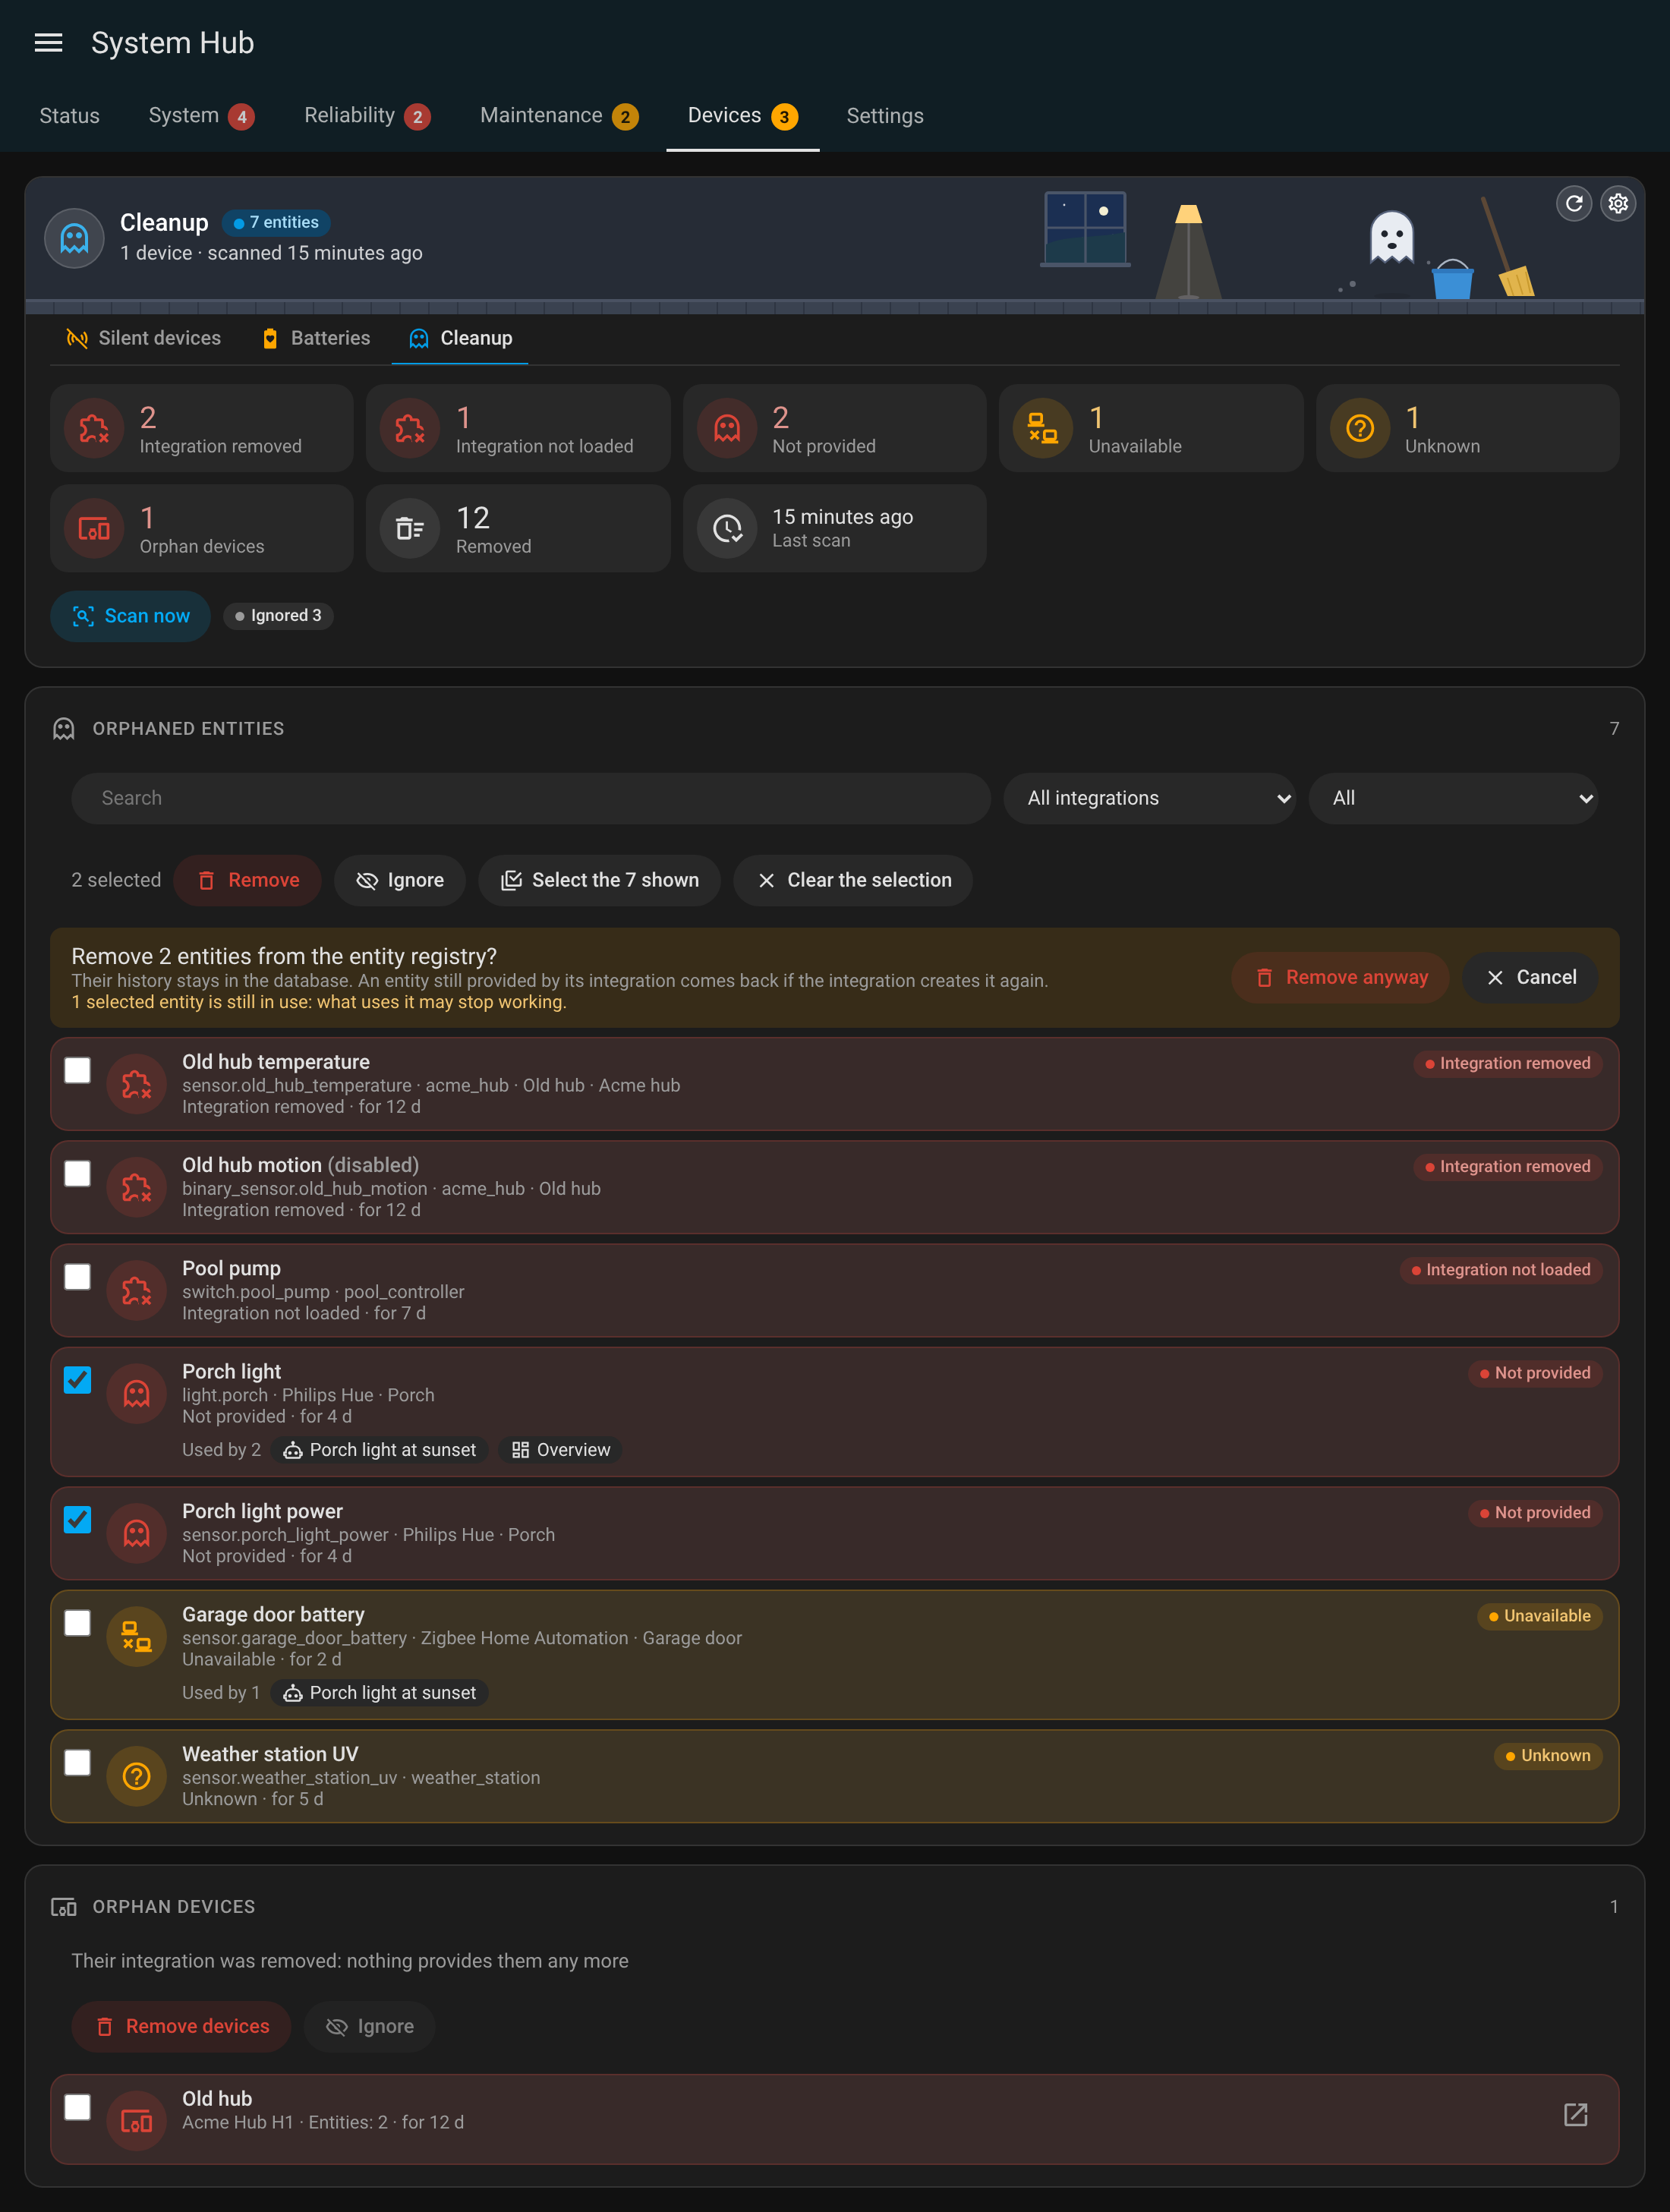
| Cleanup | A counter per reason (a click filters on it), orphan devices, removed since start, last scan; Scan now; the orphaned entities with a search, integration and reason filters, what uses each (with links); tick them one by one or every match, then Remove or Ignore (asked first); the orphan devices, removed or ignored the same way |
| Settings | The modules by group, as Home Assistant's sidebar editor: ↑ ↓ on a group to move it, and in a group its modules turned on then the ones turned off; a handle ═ to drag a module among the ones of its group (or ↑ ↓ from it with the keyboard), the first tab opening by default; each module with its switch and its settings ⚙ opened in place (the System thresholds in the System row), Save and Cancel per module; Save and Discard for the modules and tabs changed |
Turning Git Sync on the first time asks for its repository: its form opens in the Settings tab, and the module is saved once the repository is checked.
Screenshots
Every tab, light and dark themes:
| Tab | Light | Dark |
|---|---|---|
| Status | |
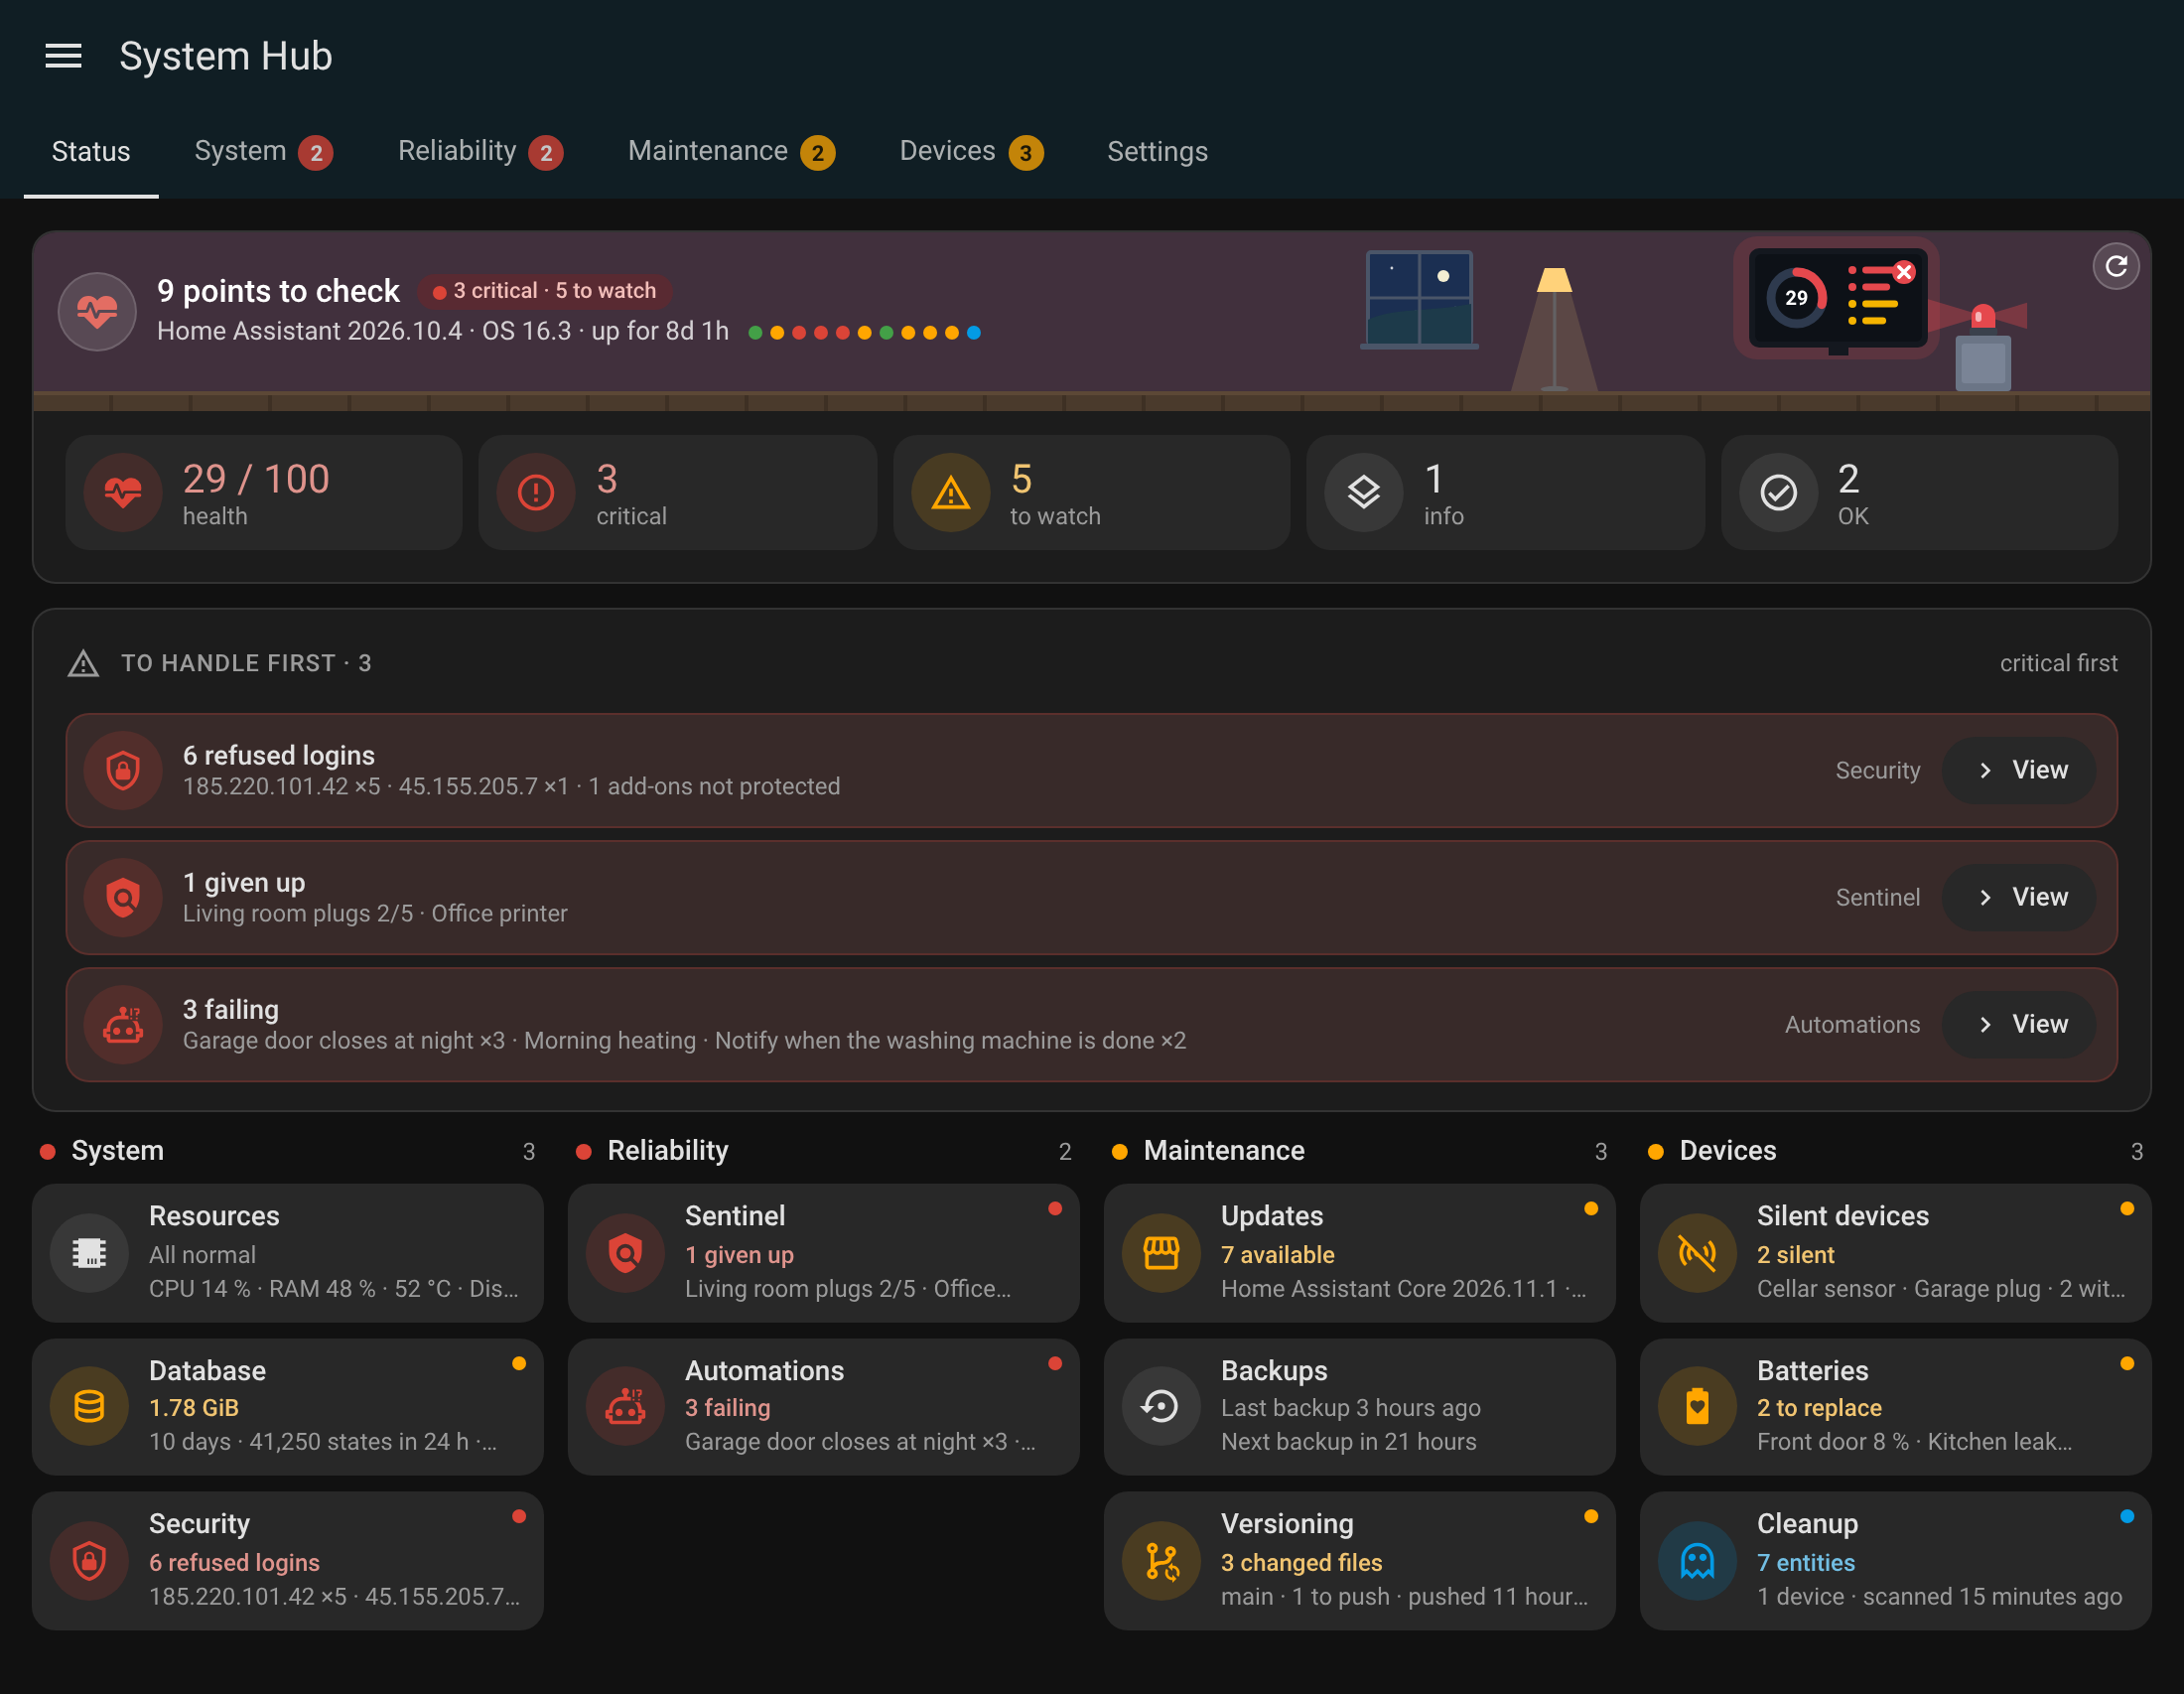 |
| System | 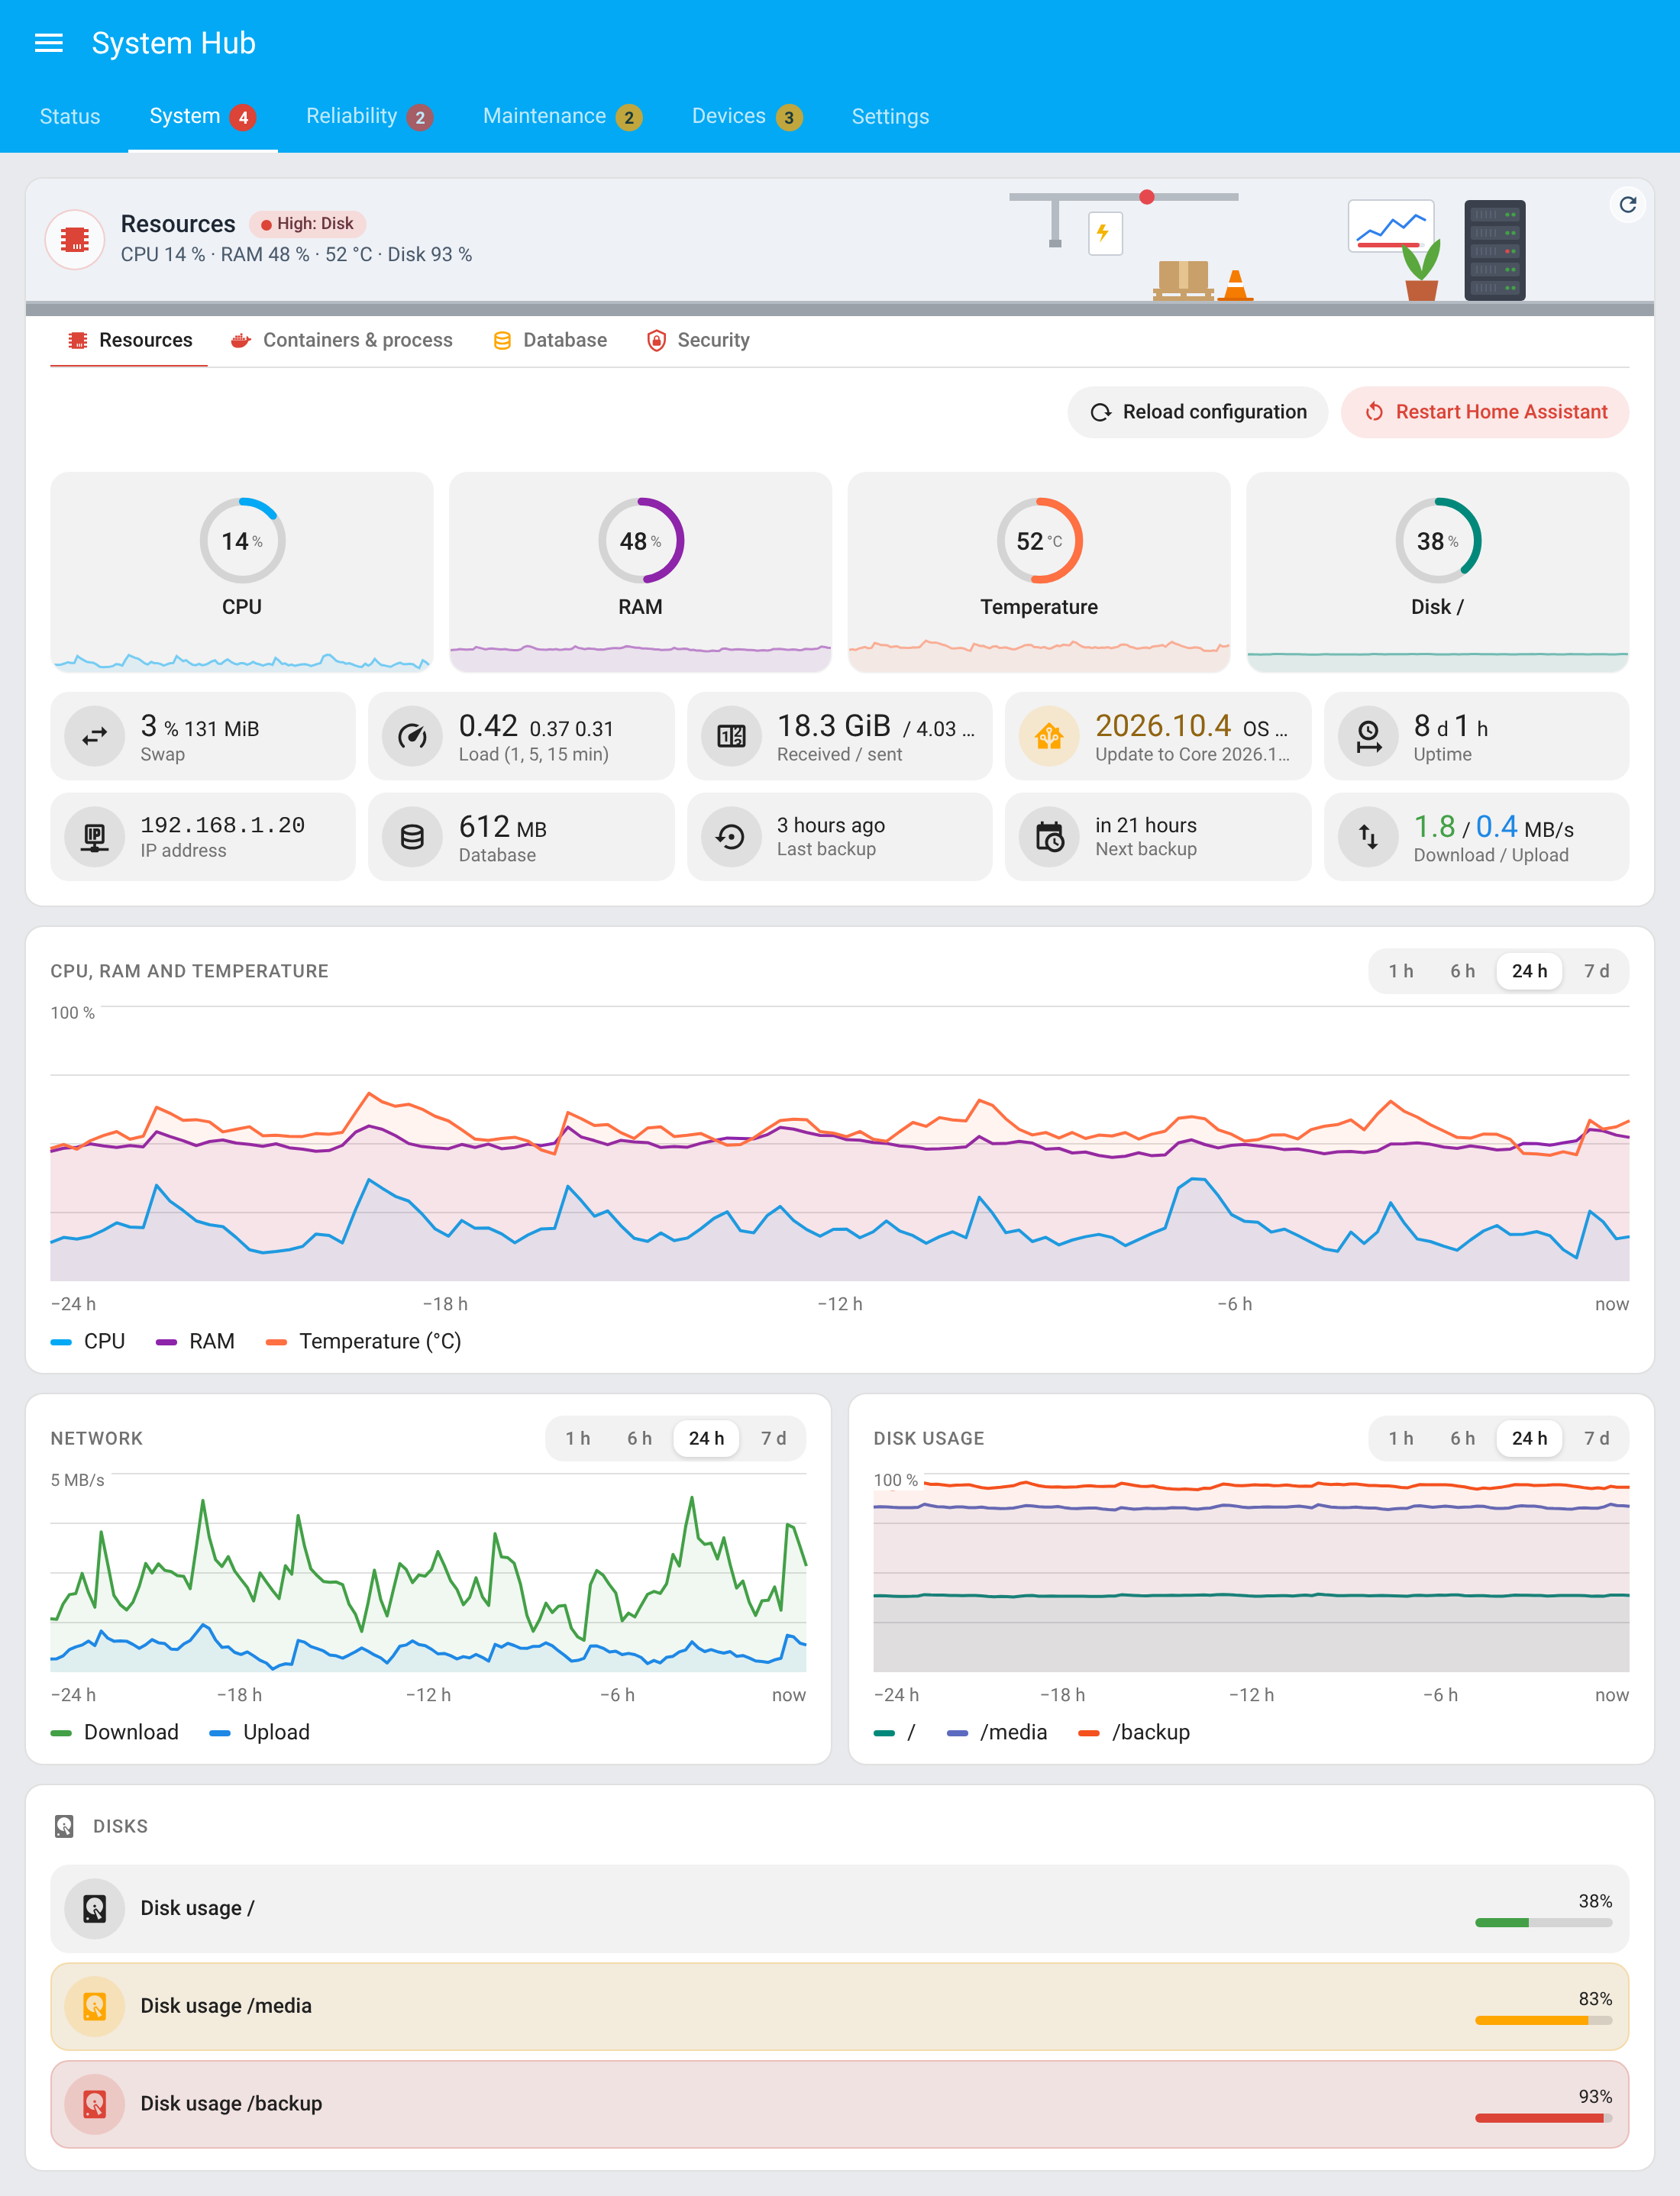 |
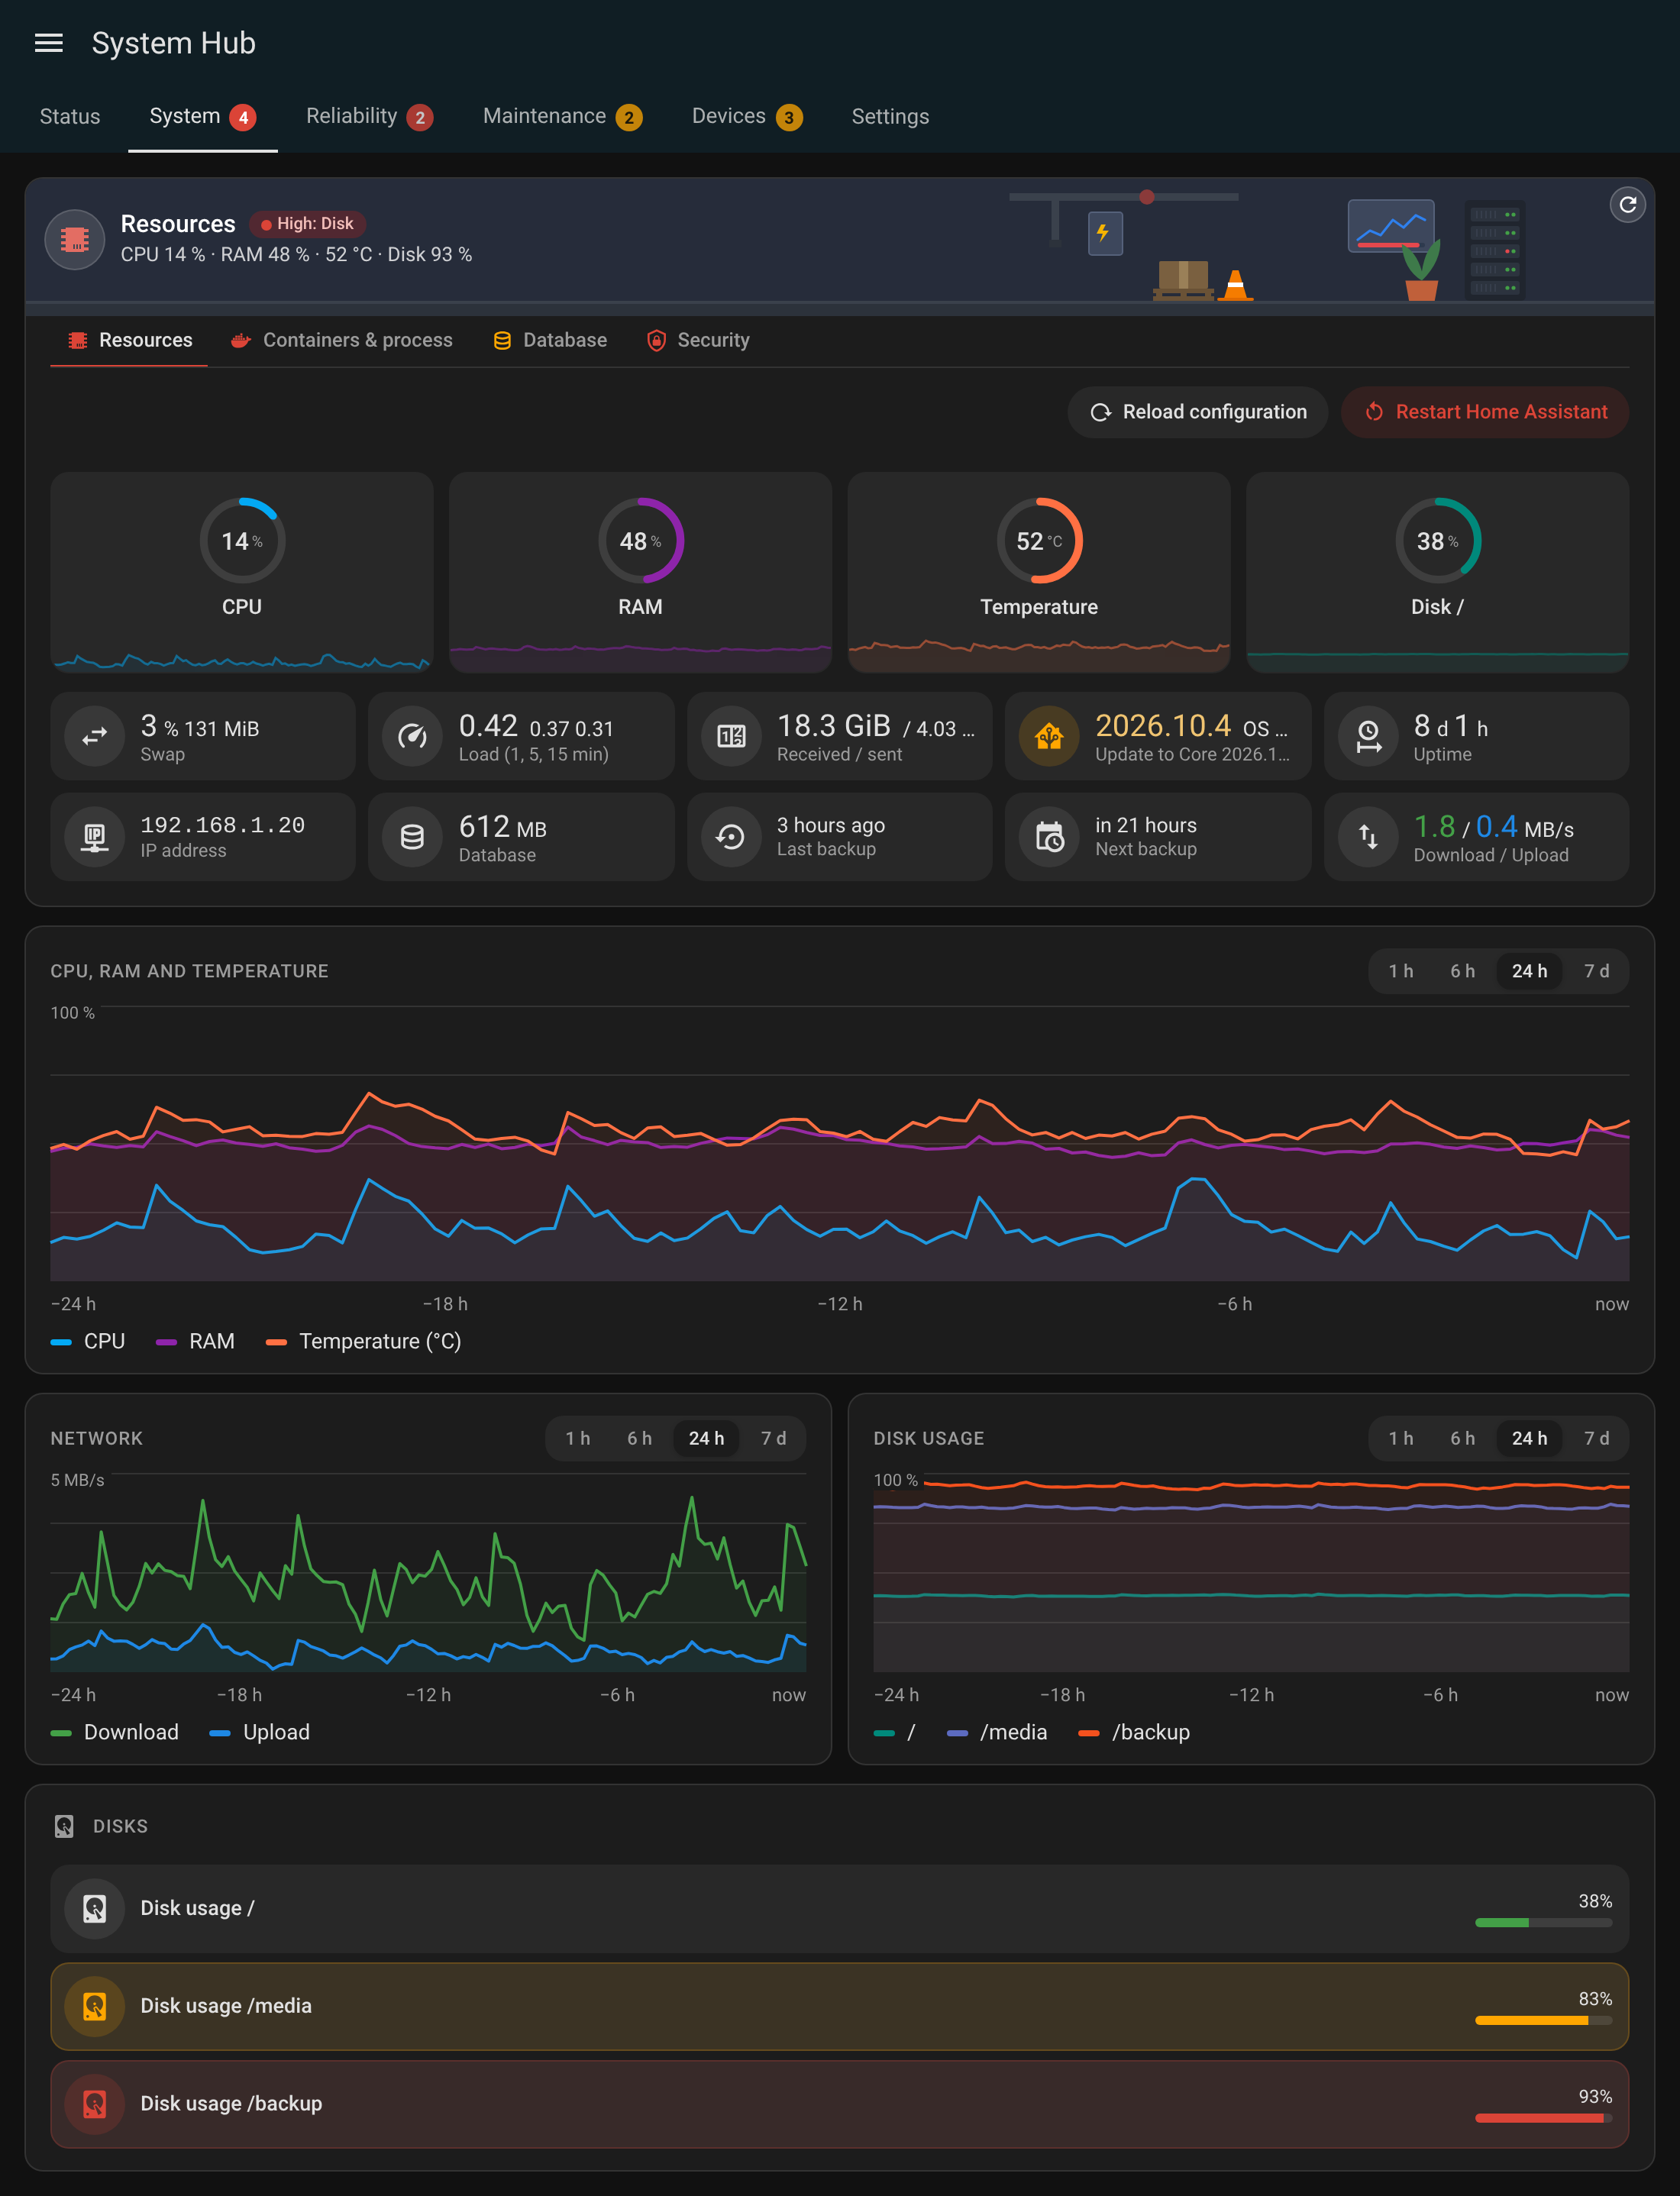 |
| Containers | 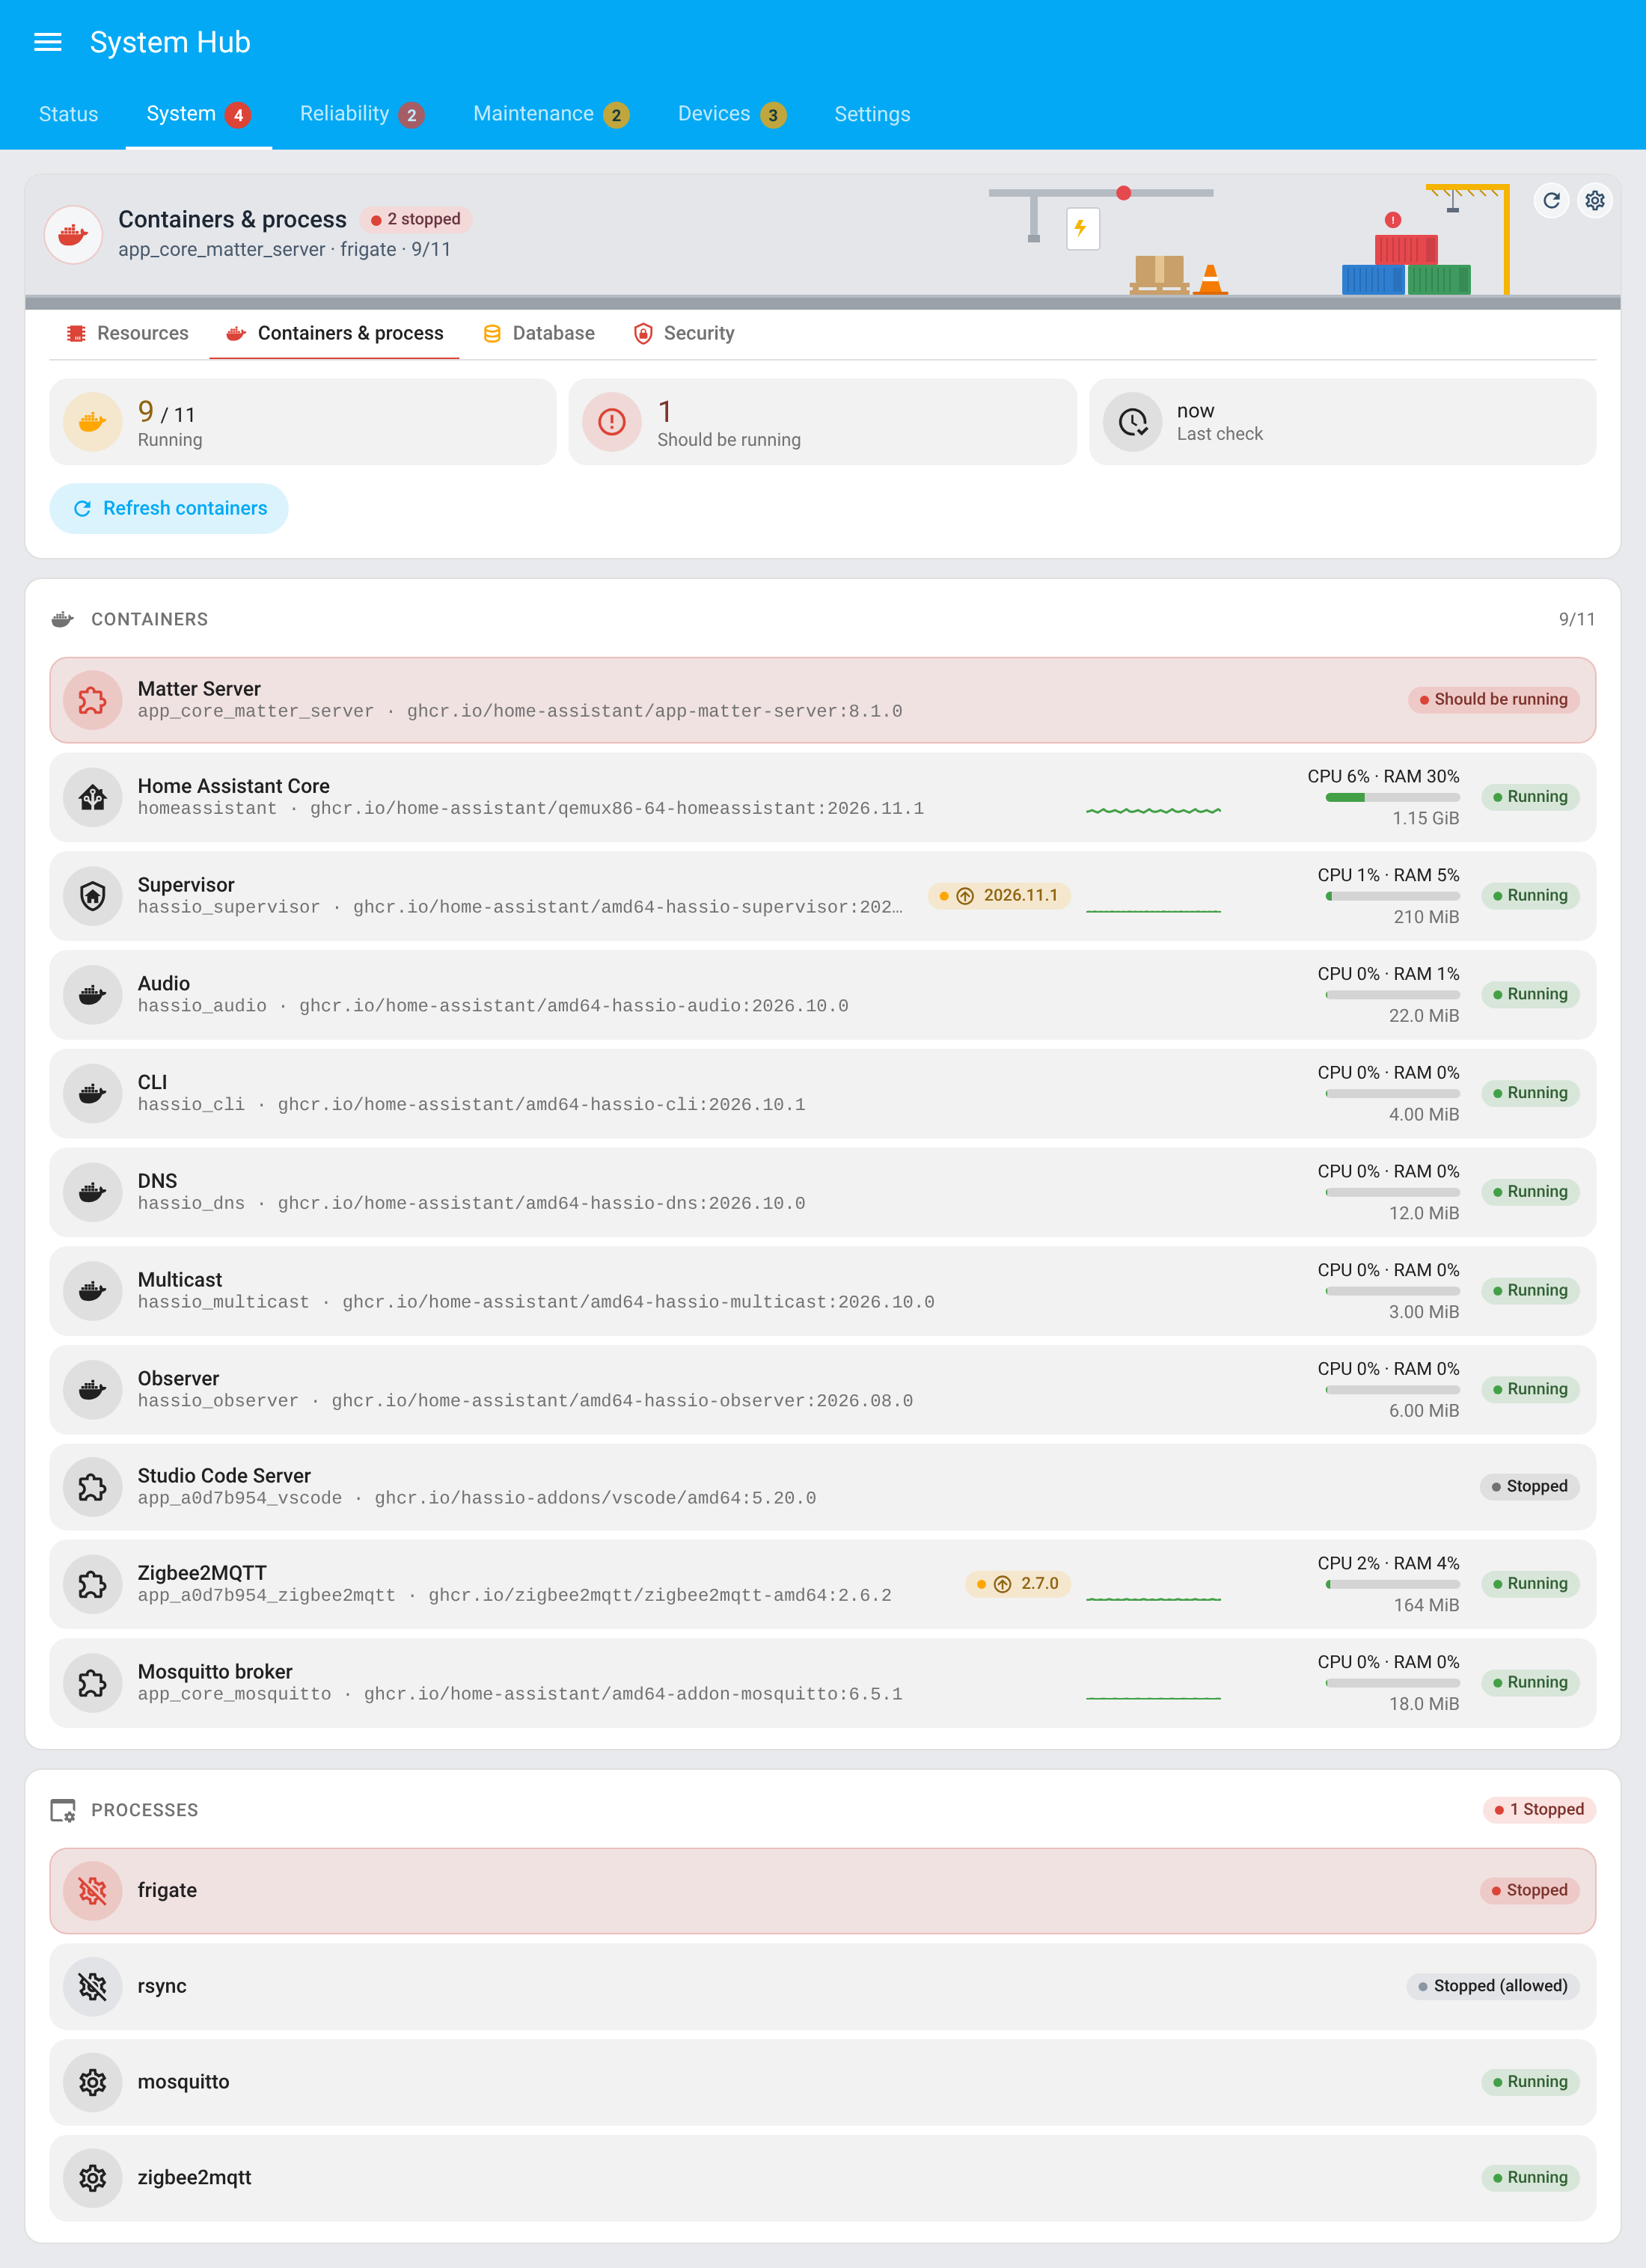 |
 |
| Watchdog | 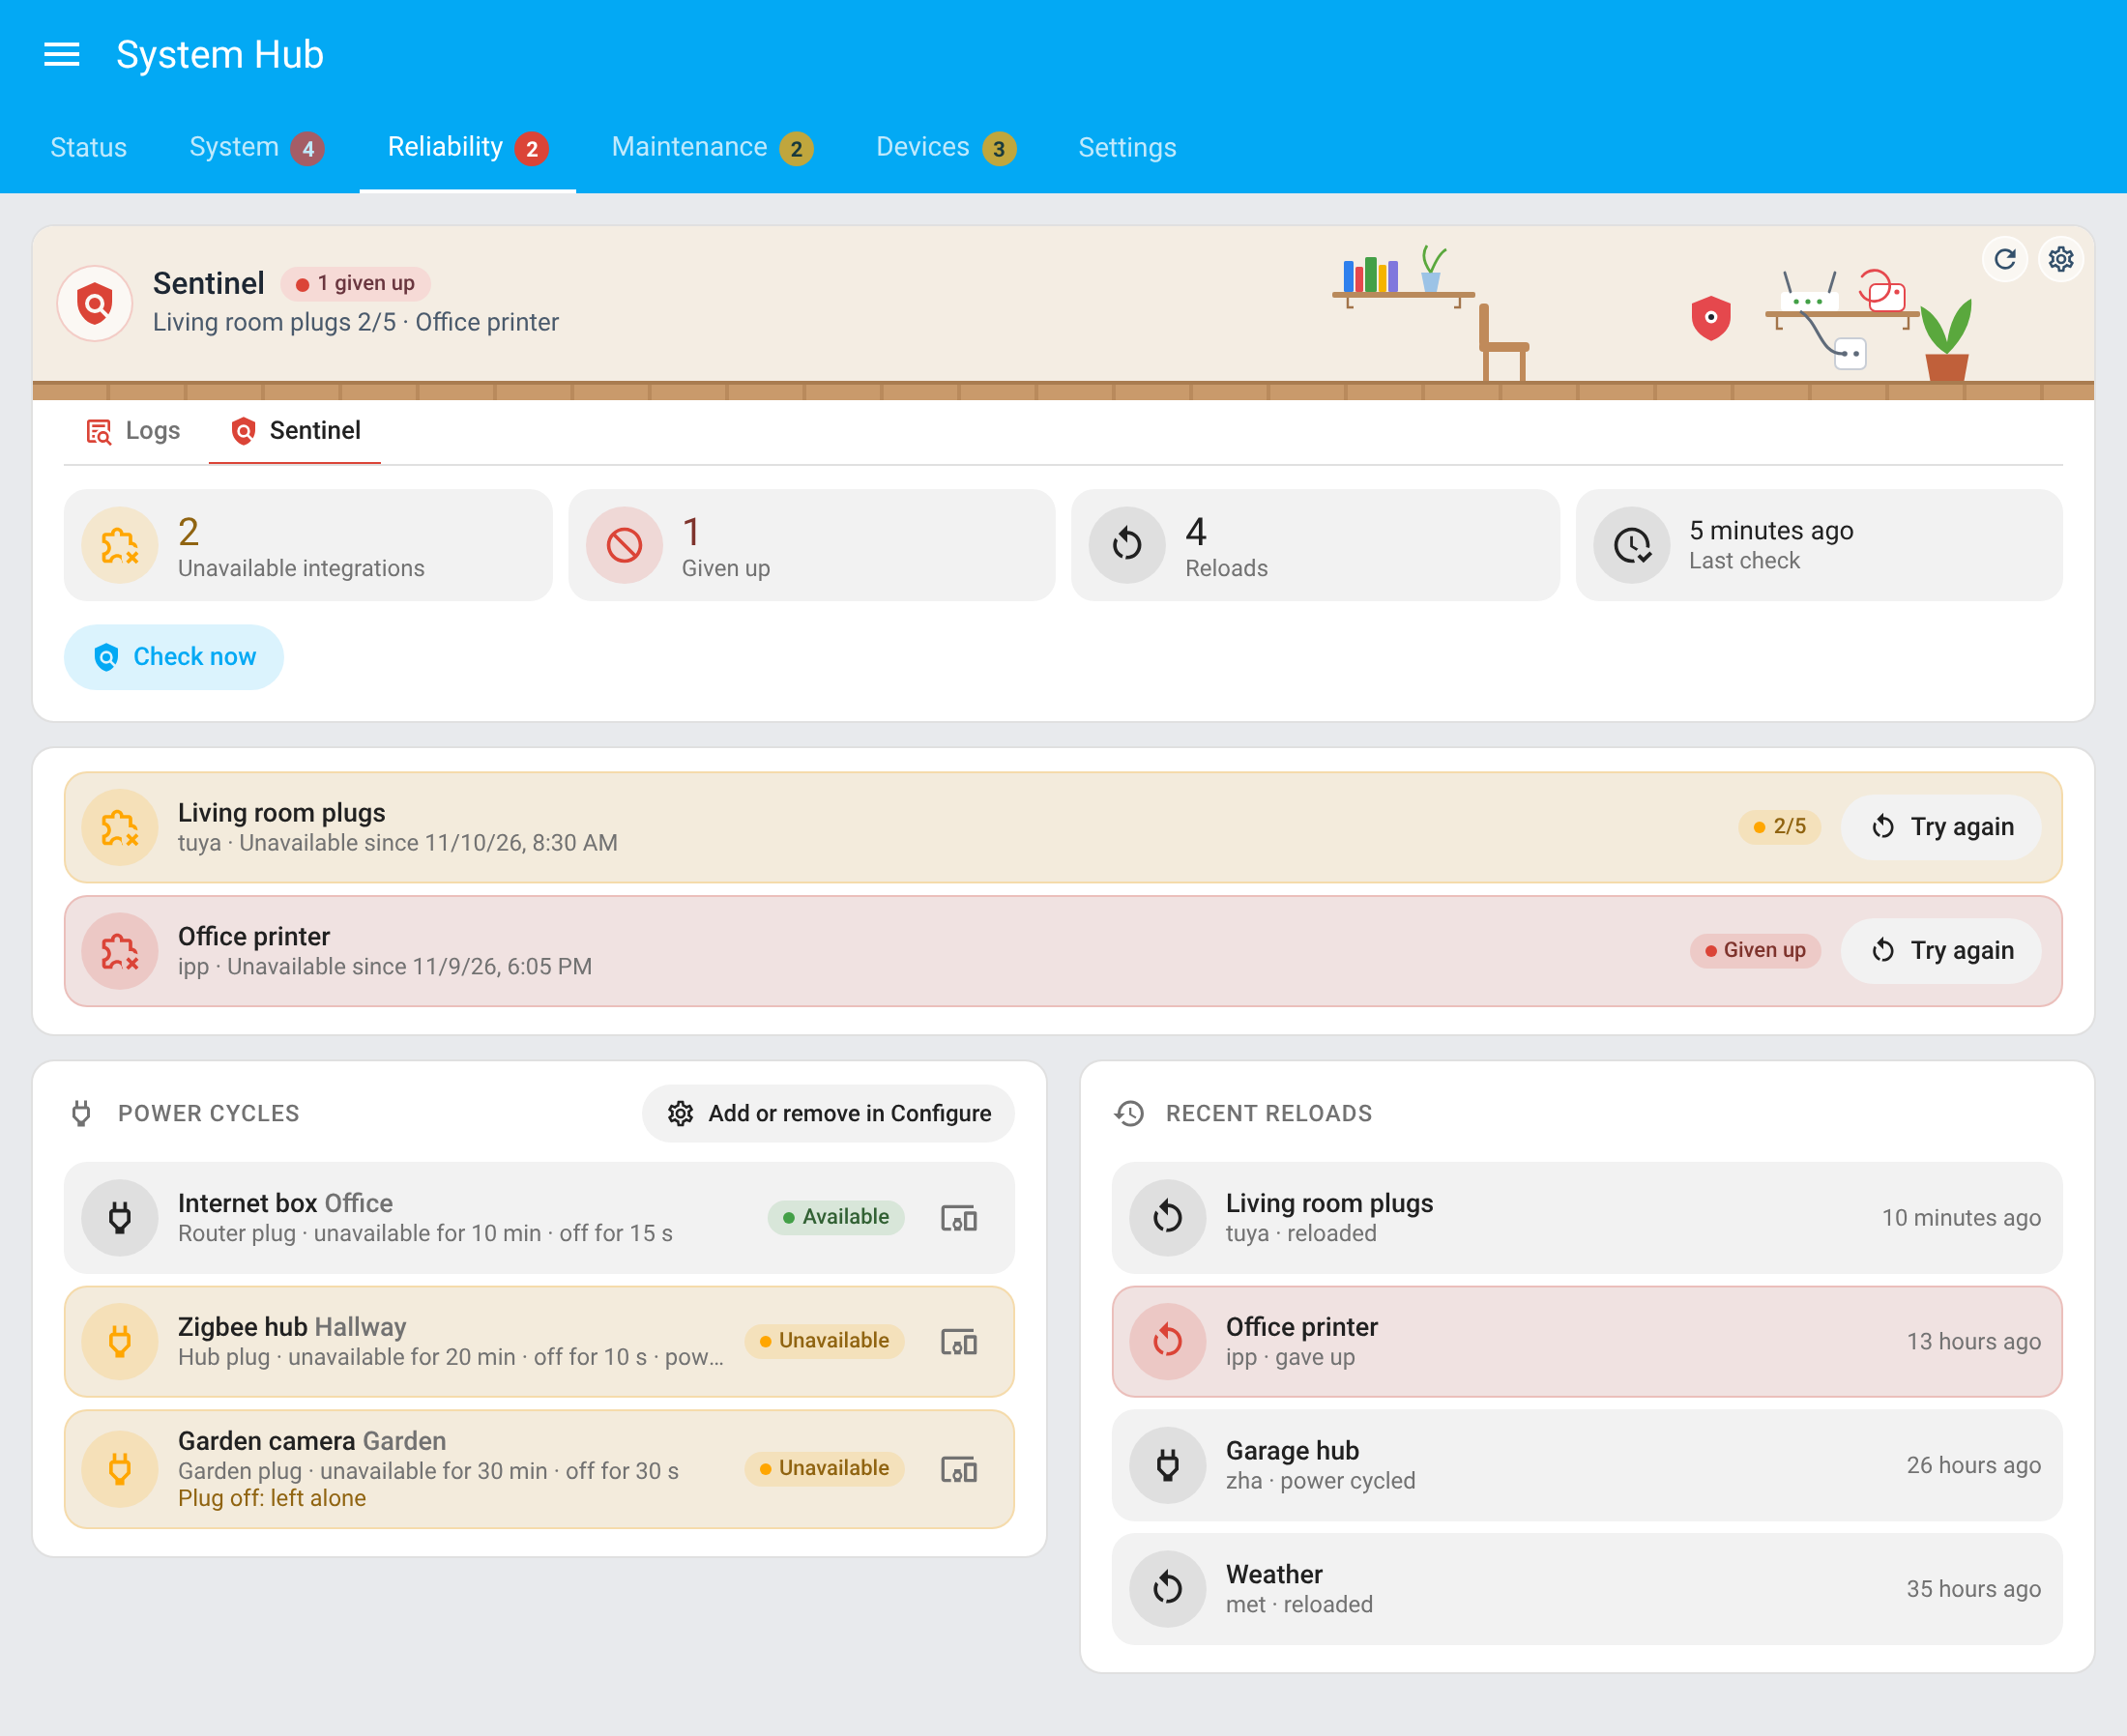 |
 |
| Marketplace | 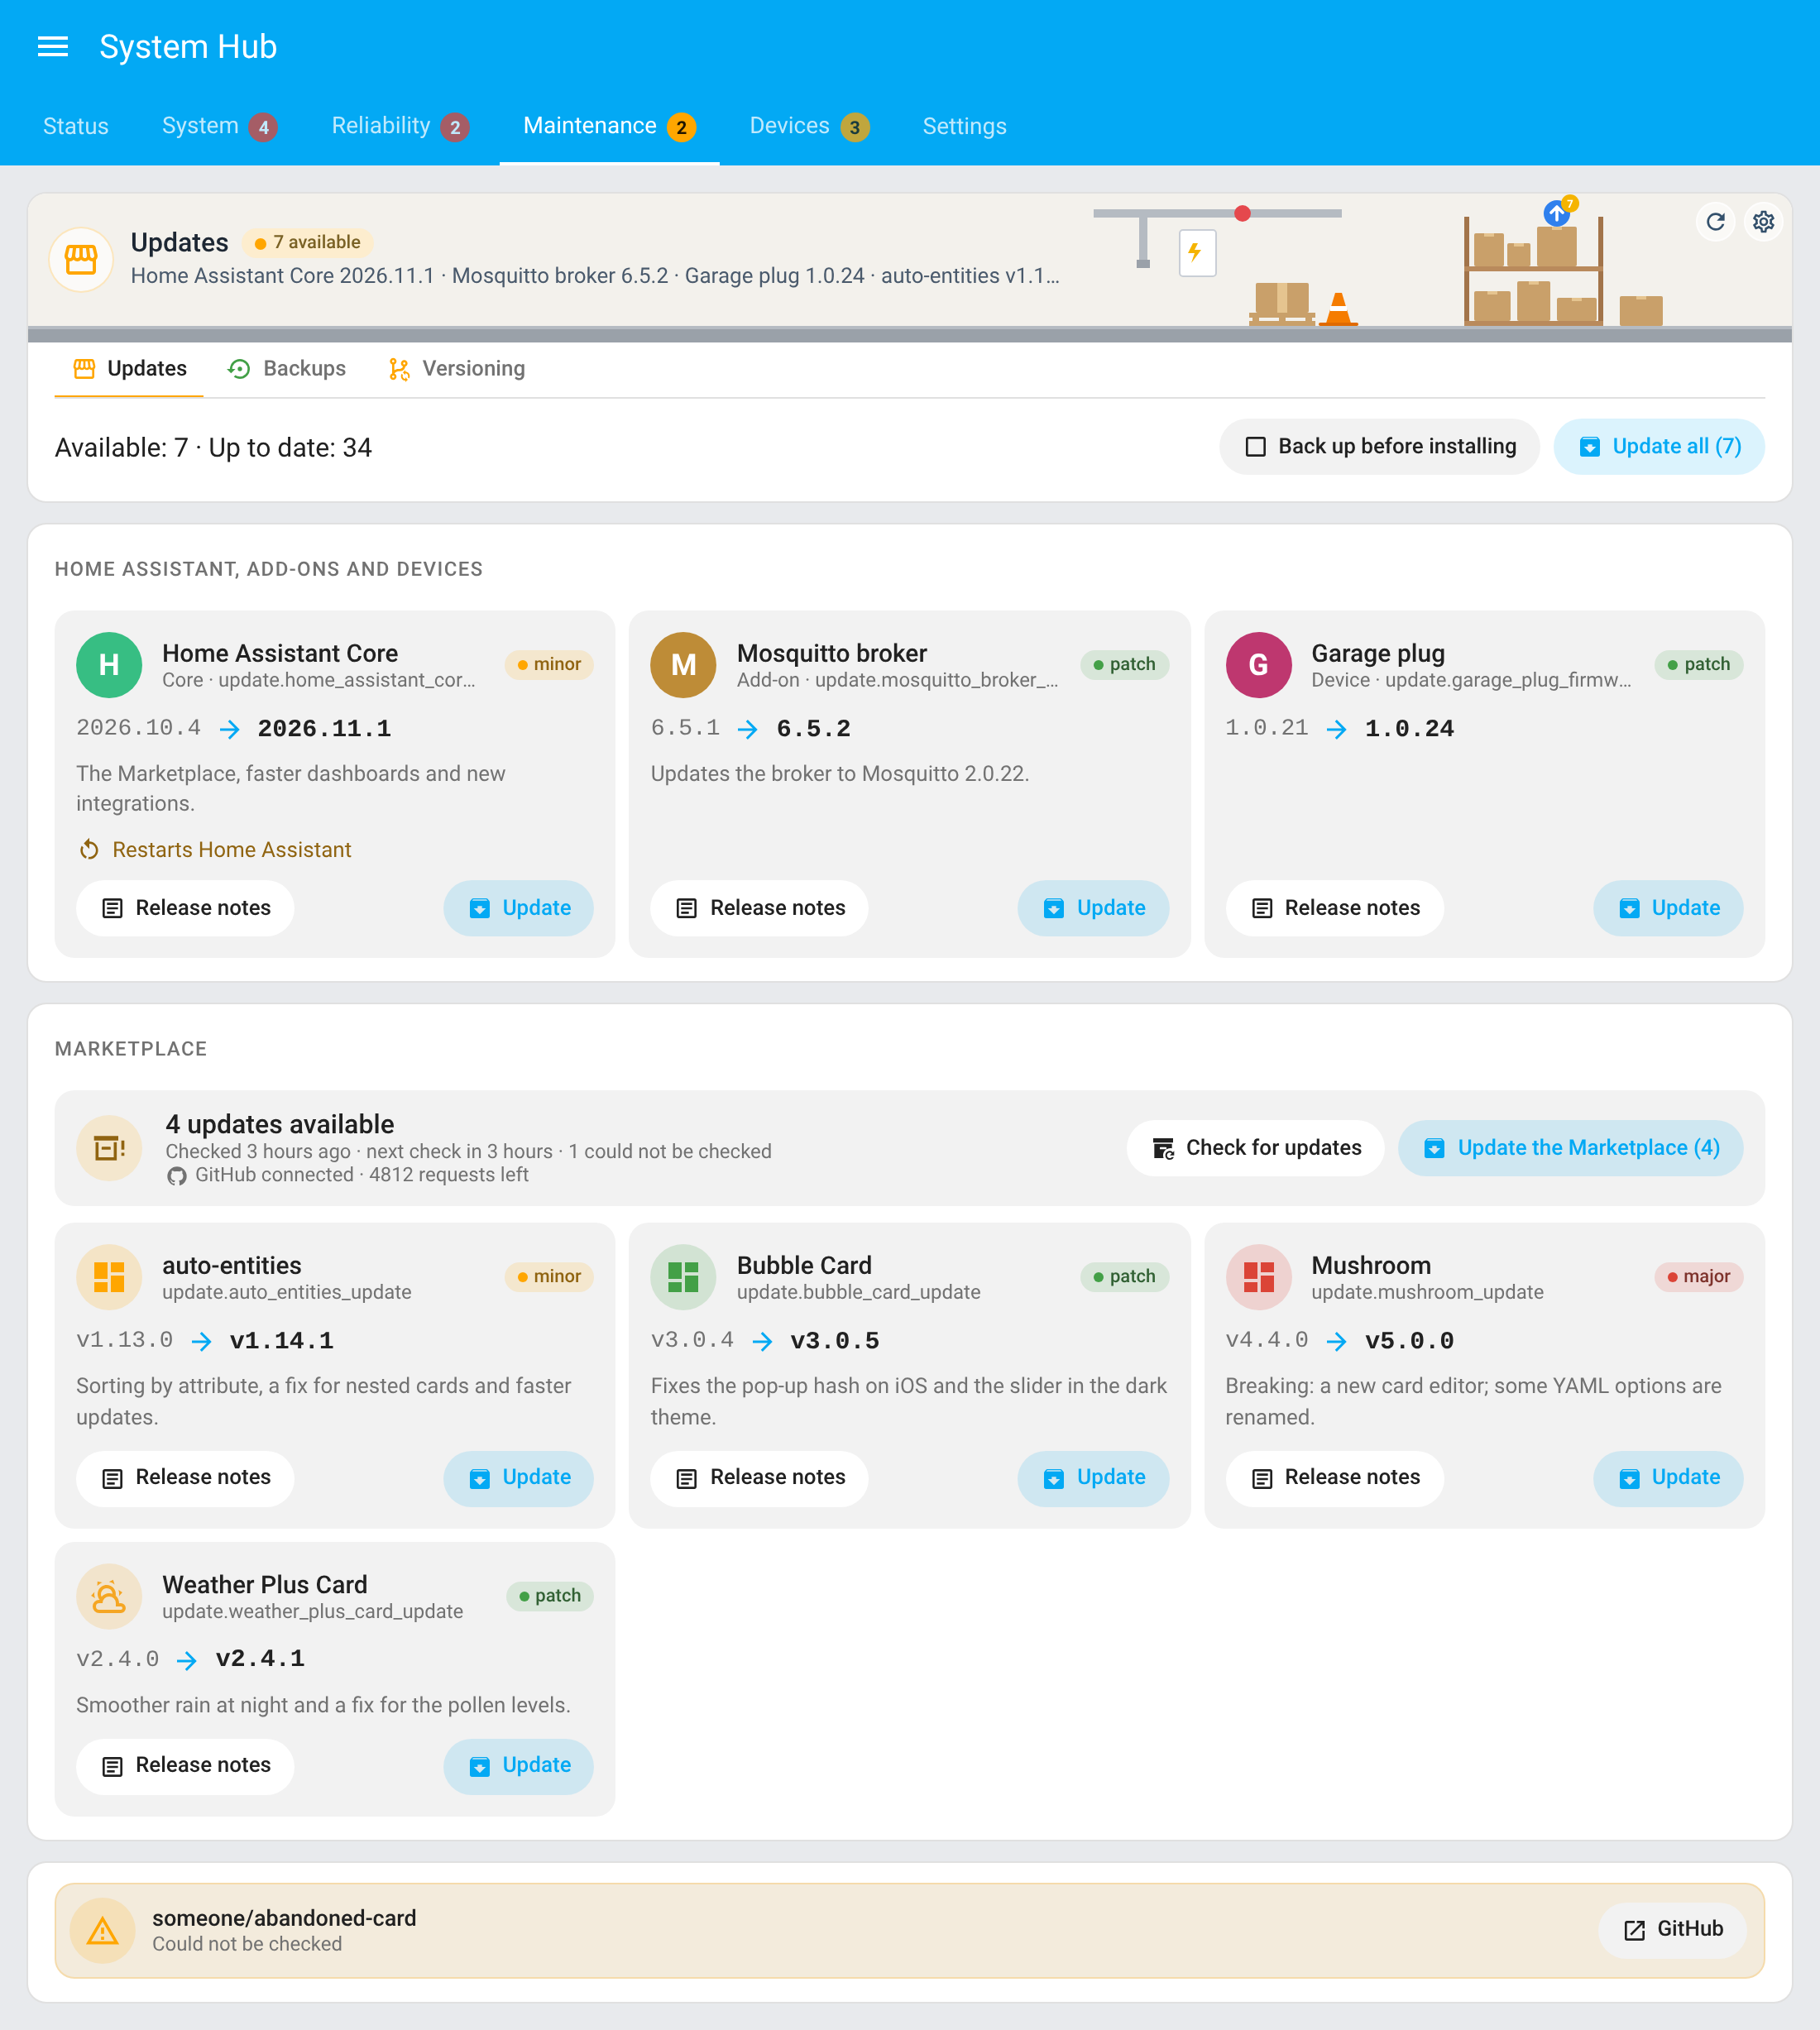 |
 |
| Batteries | 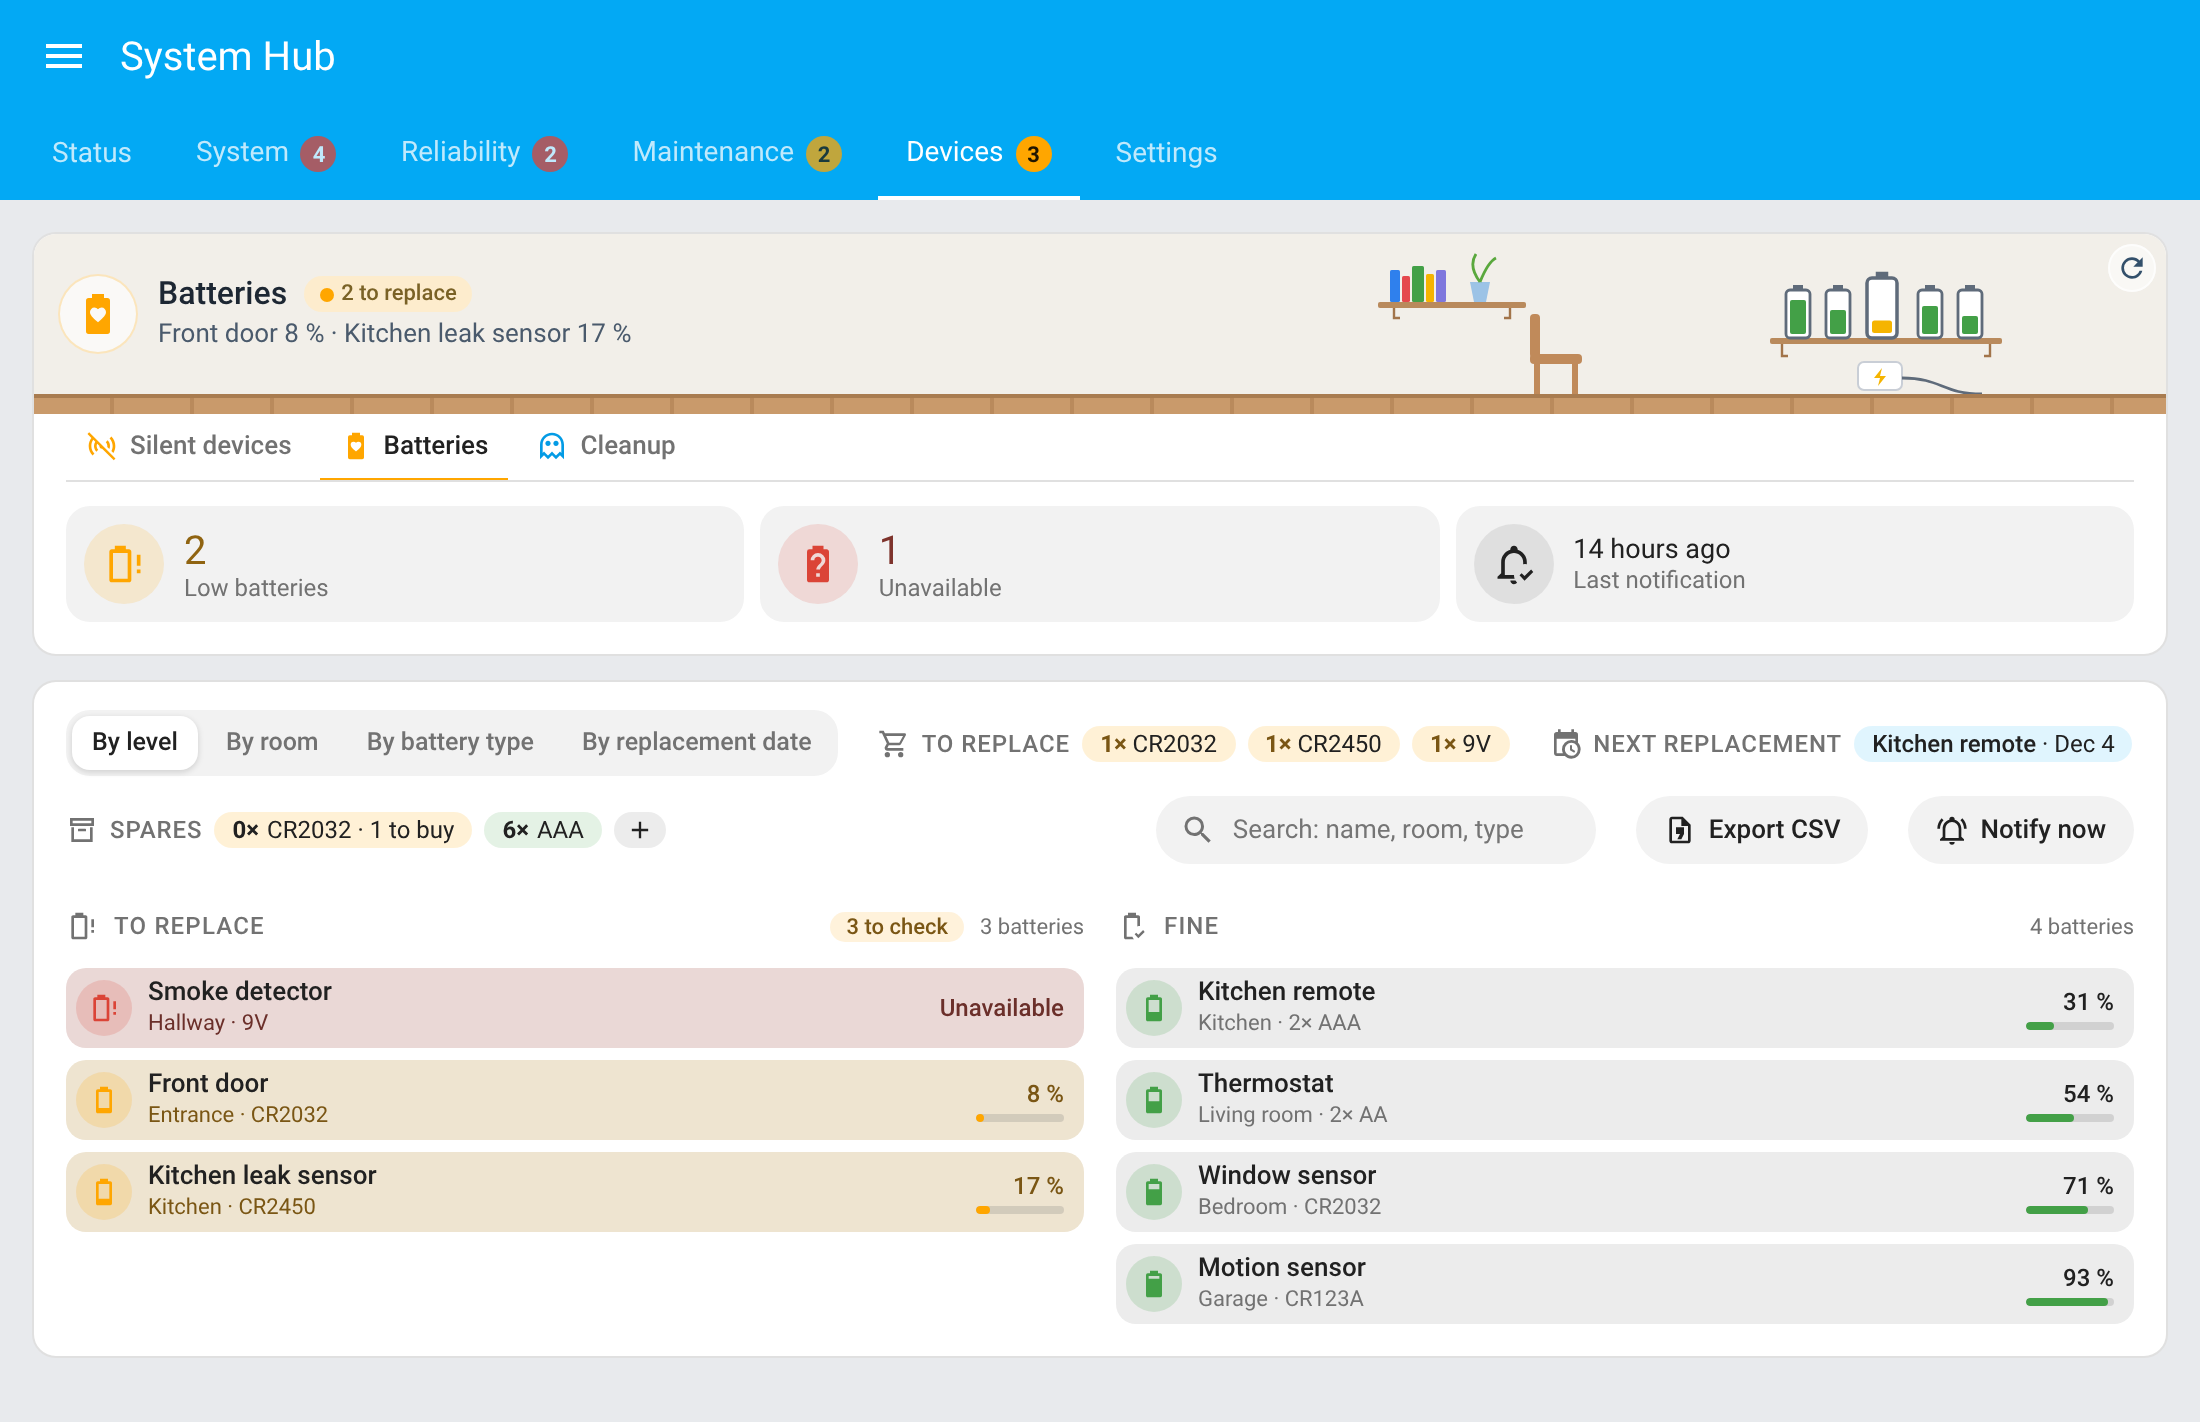 |
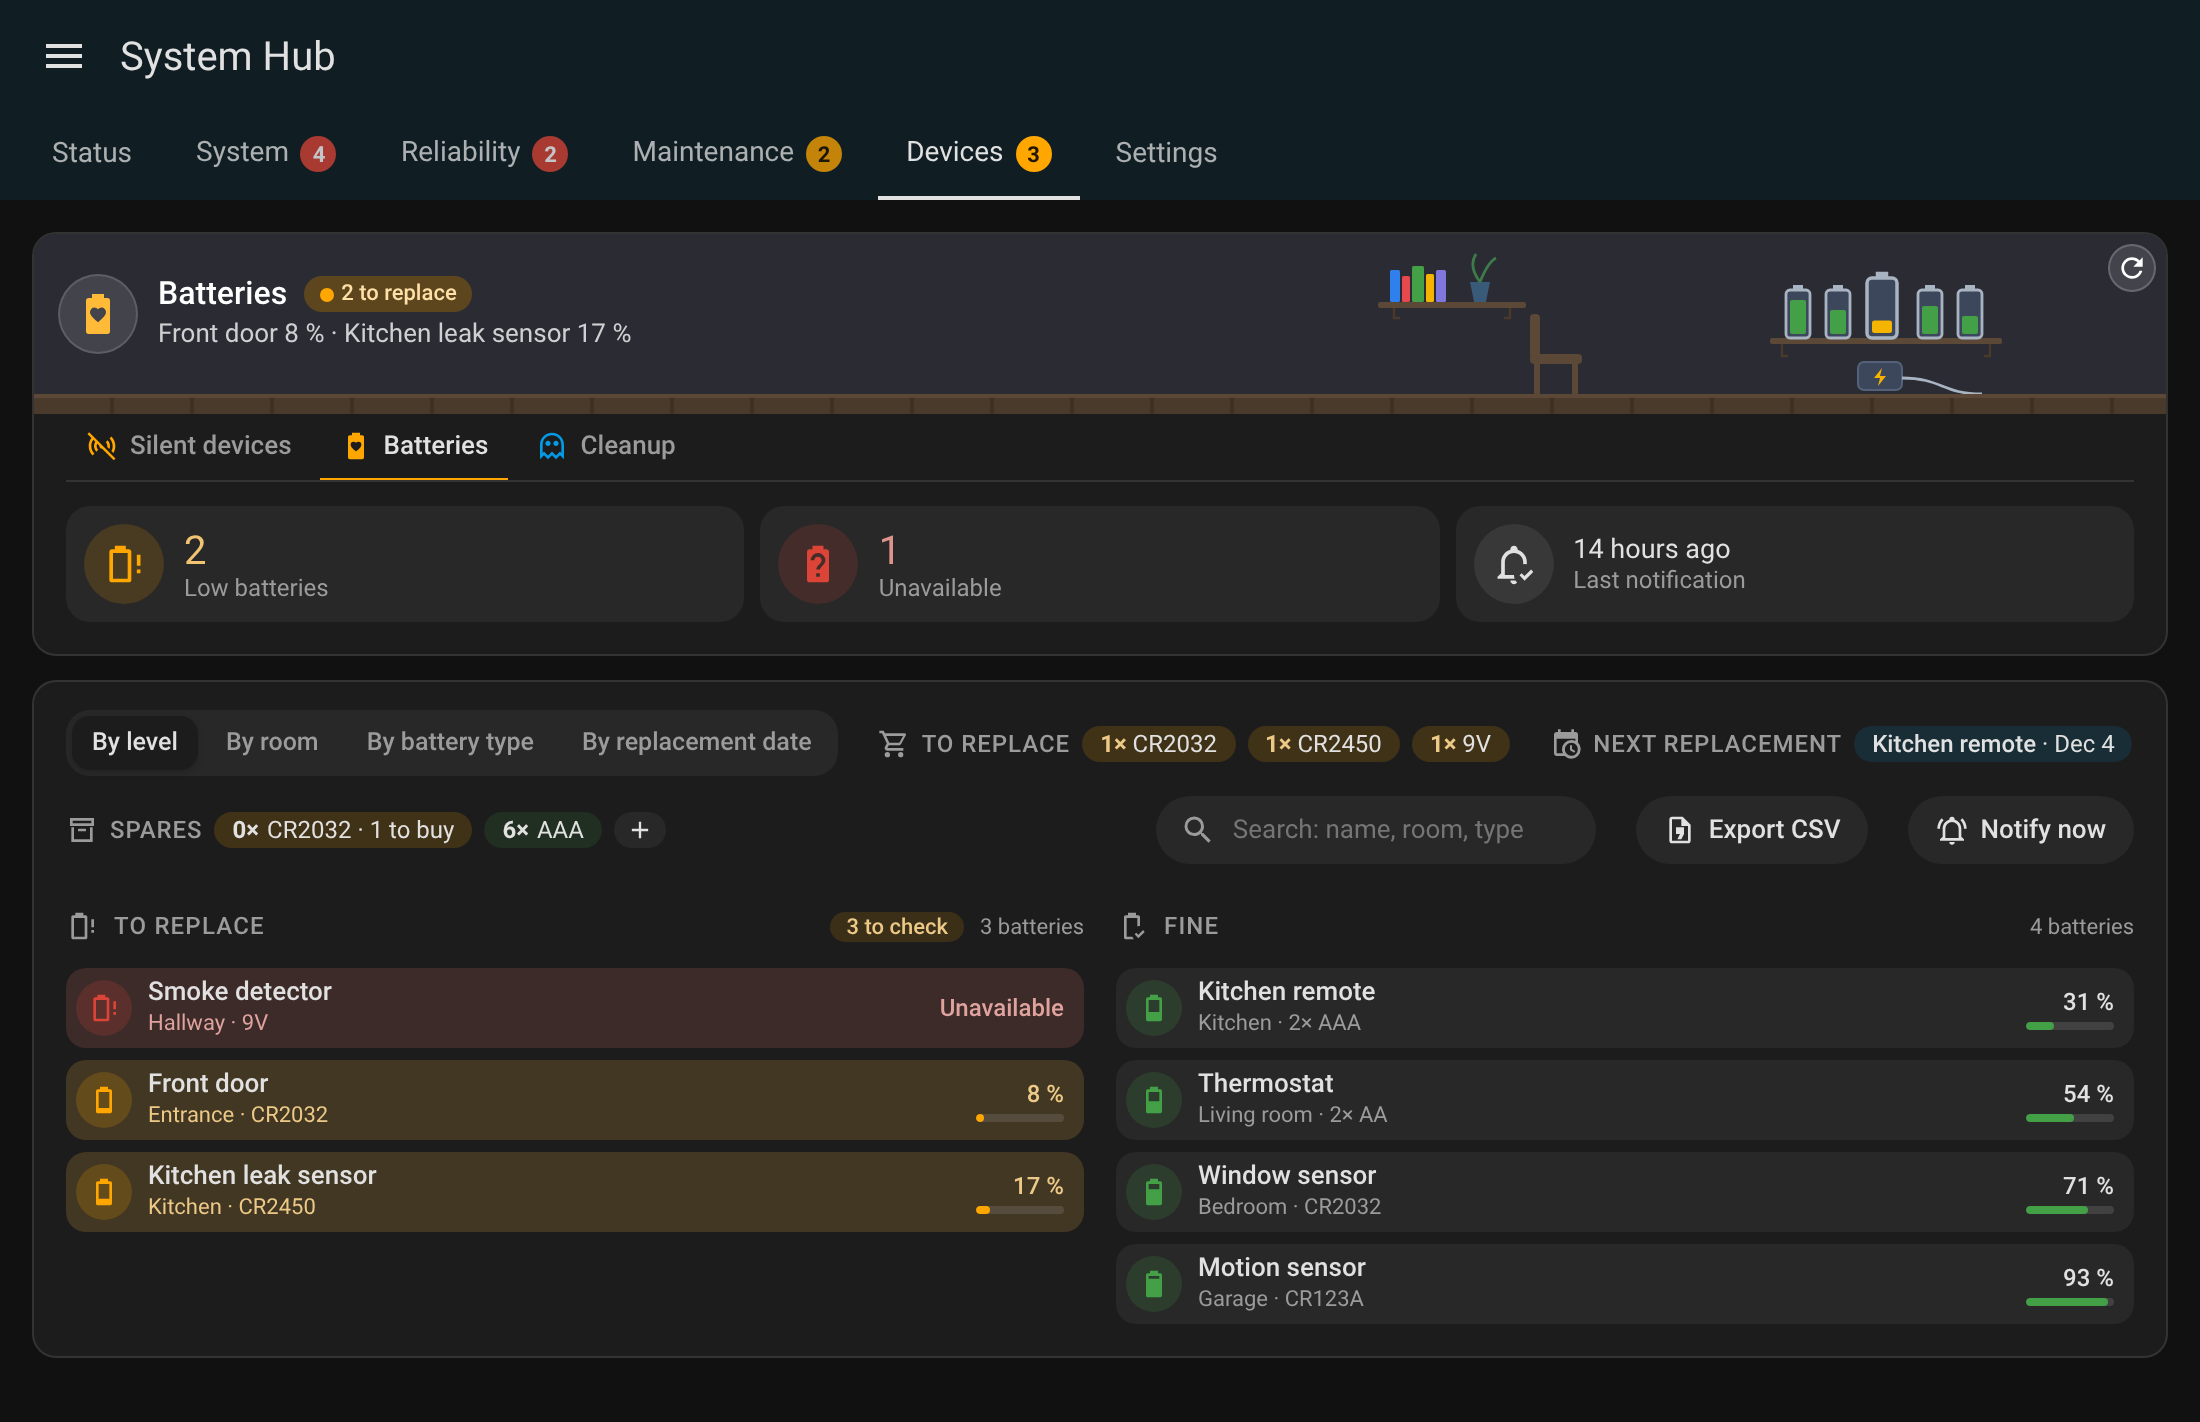 |
| Git Sync | 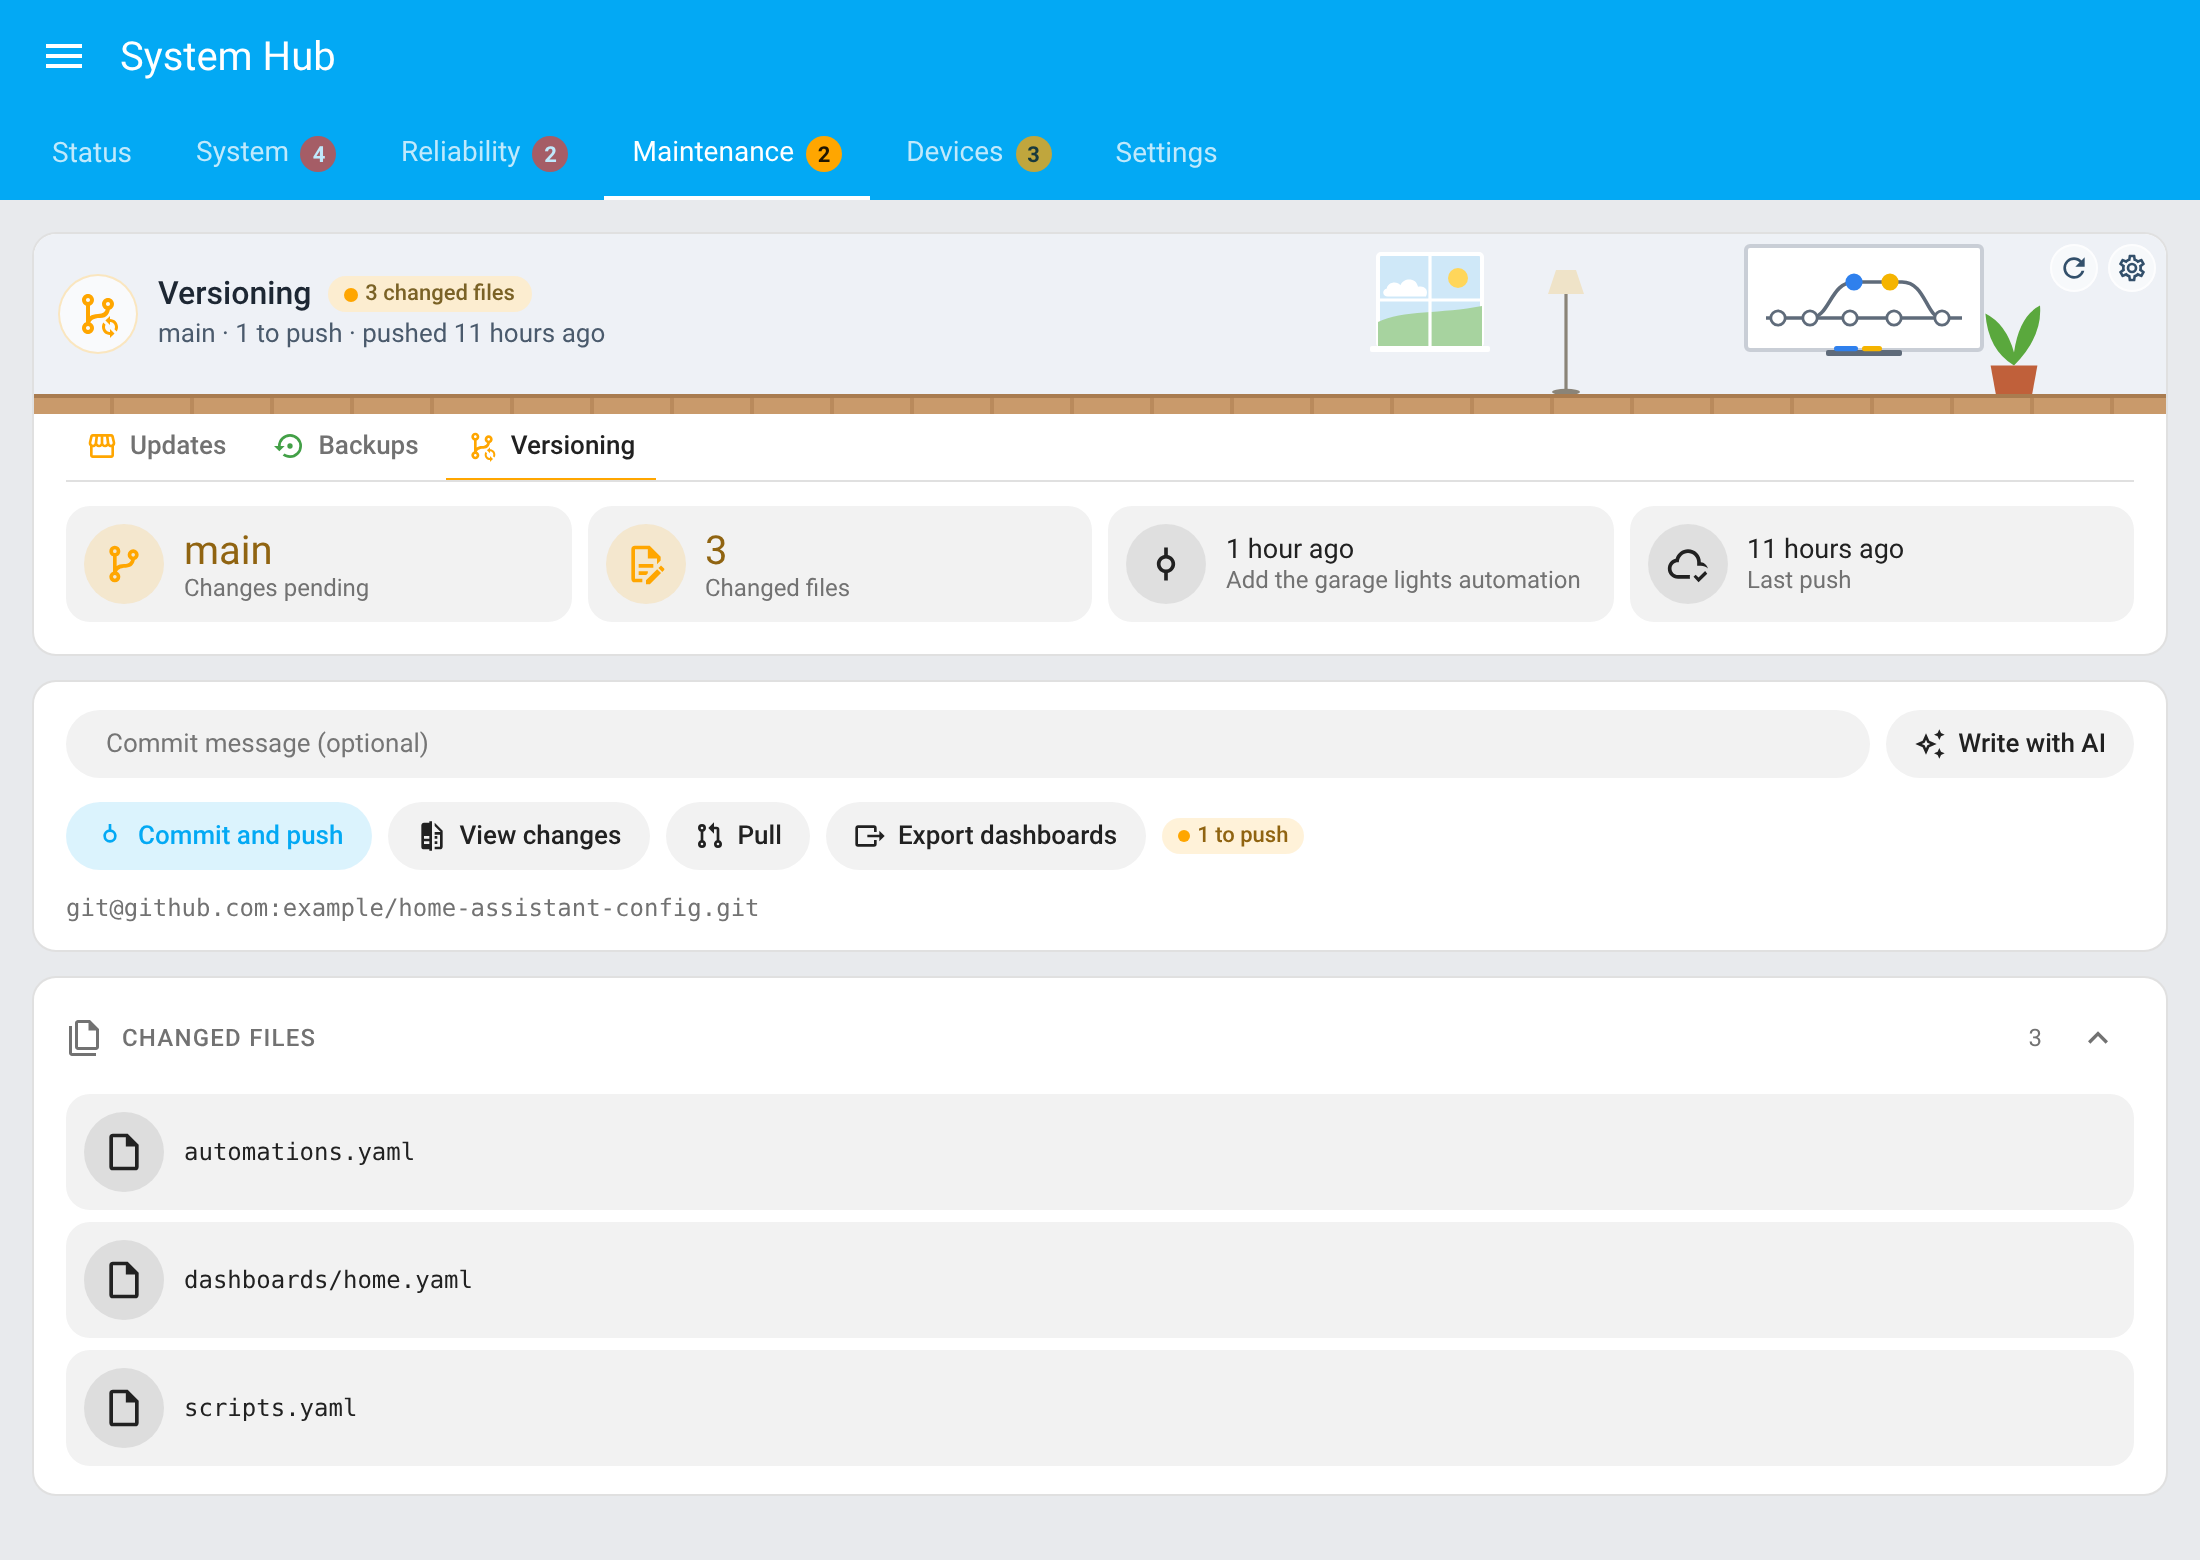 |
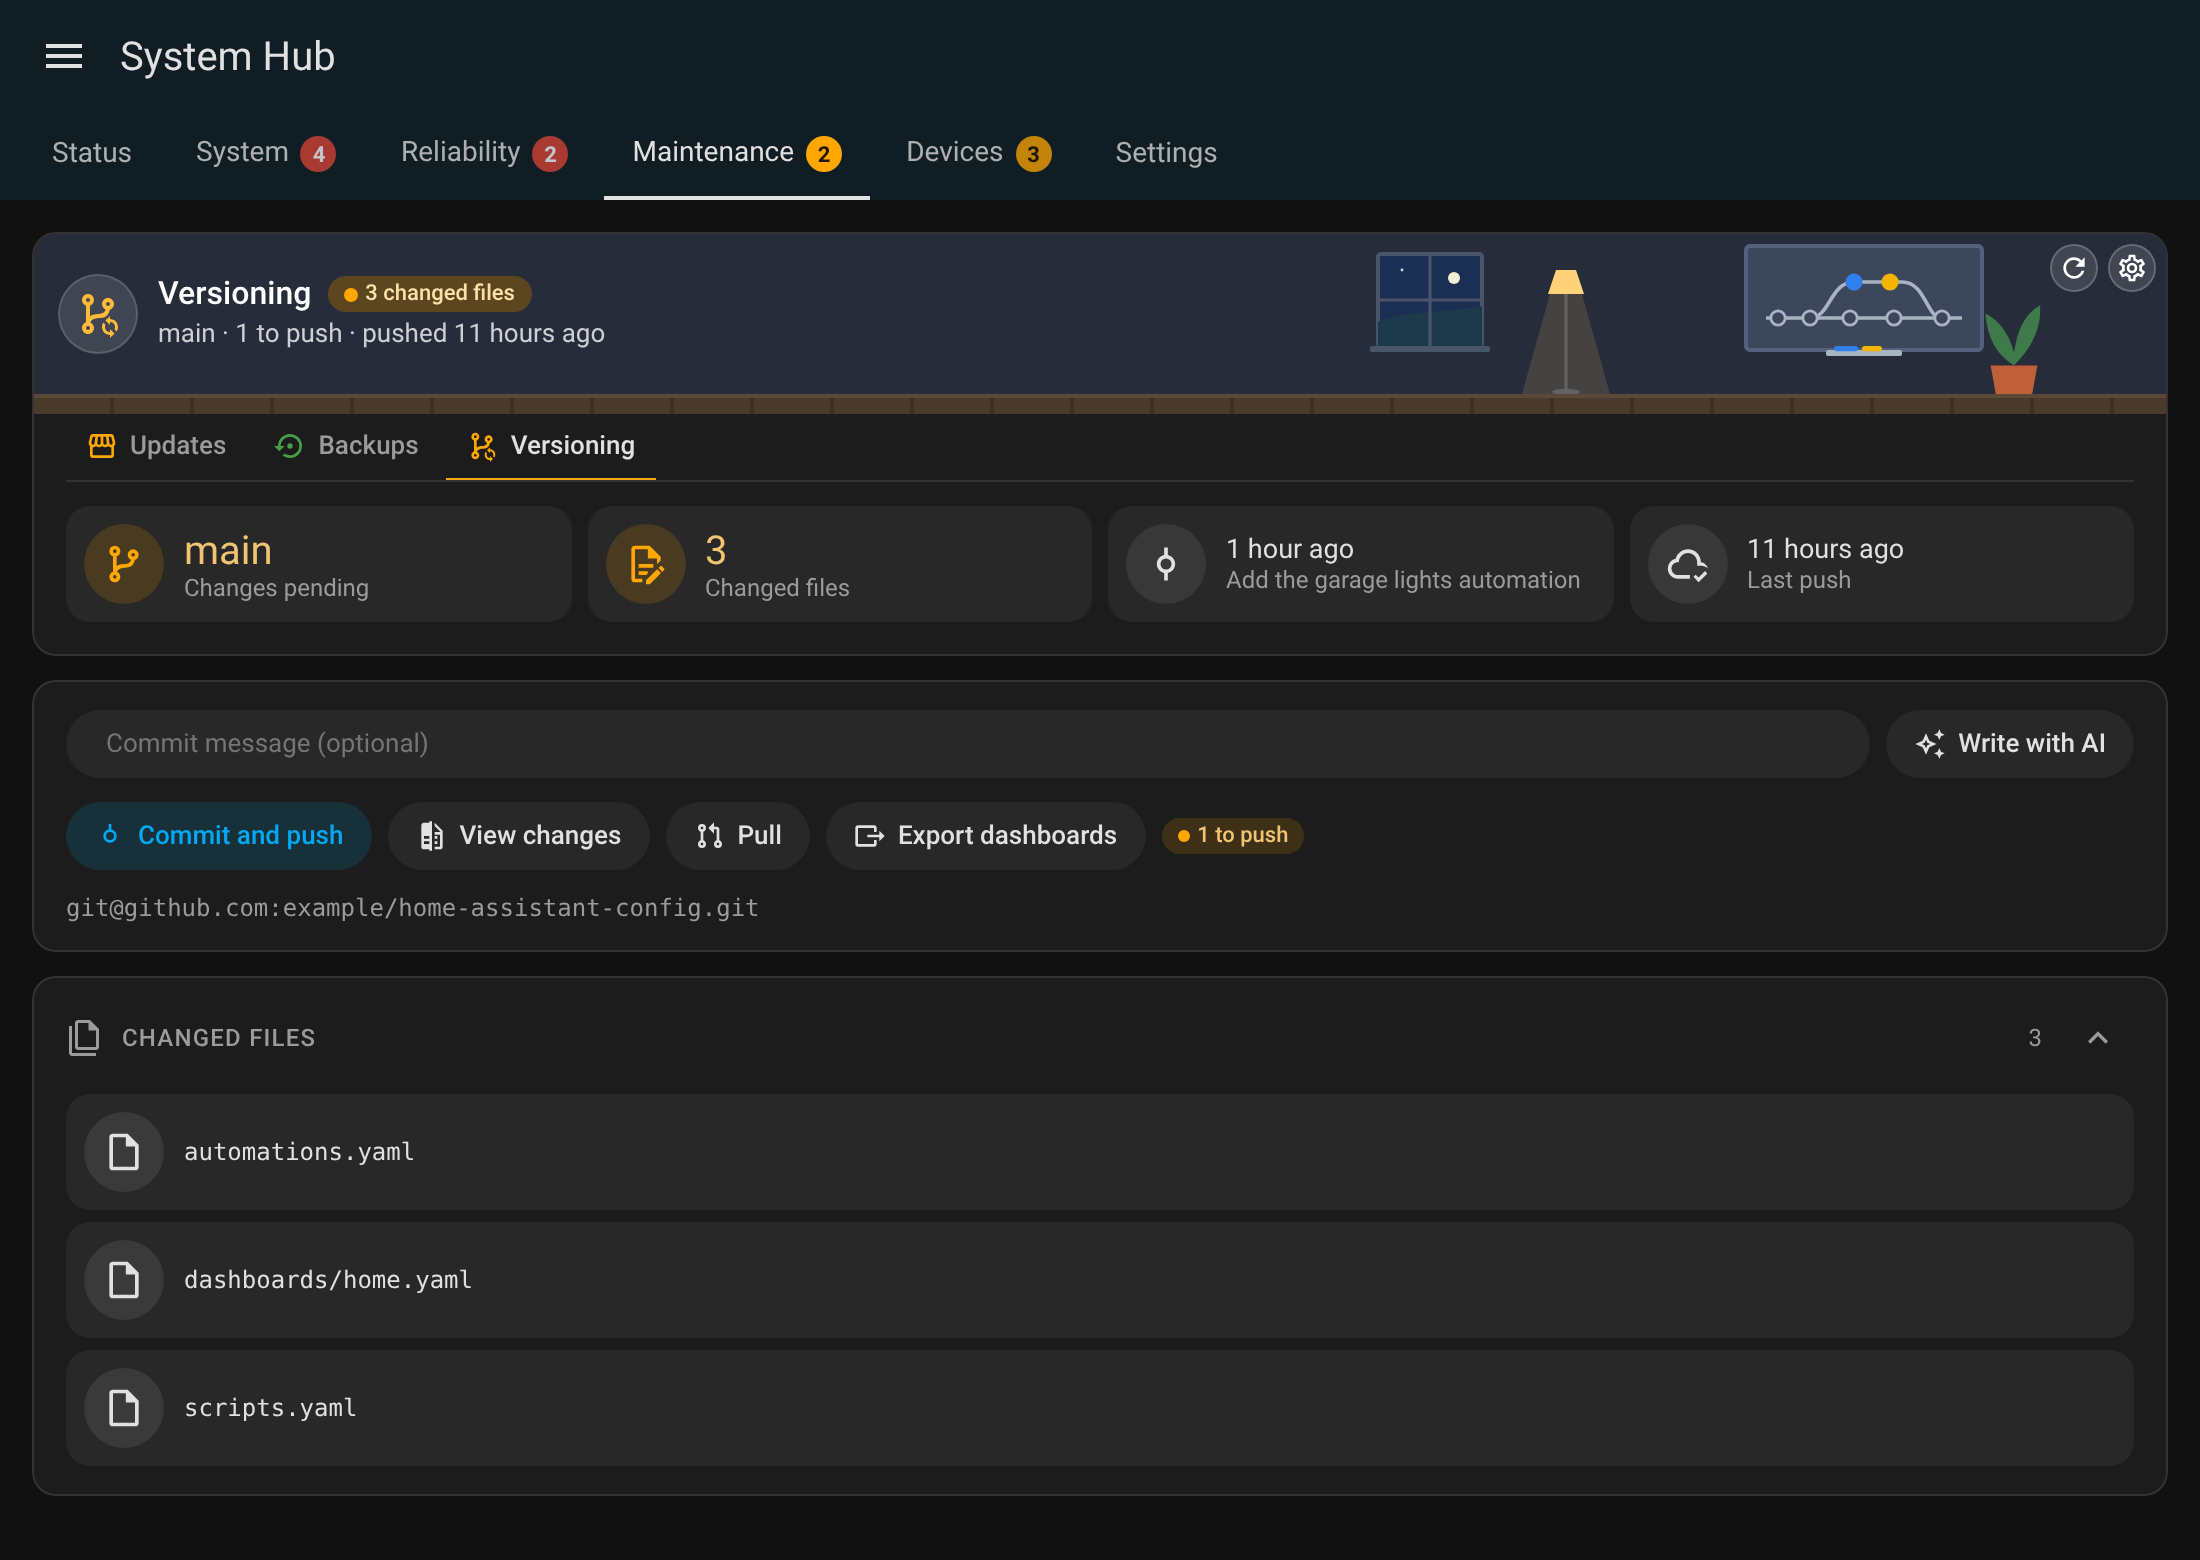 |
| Automations | 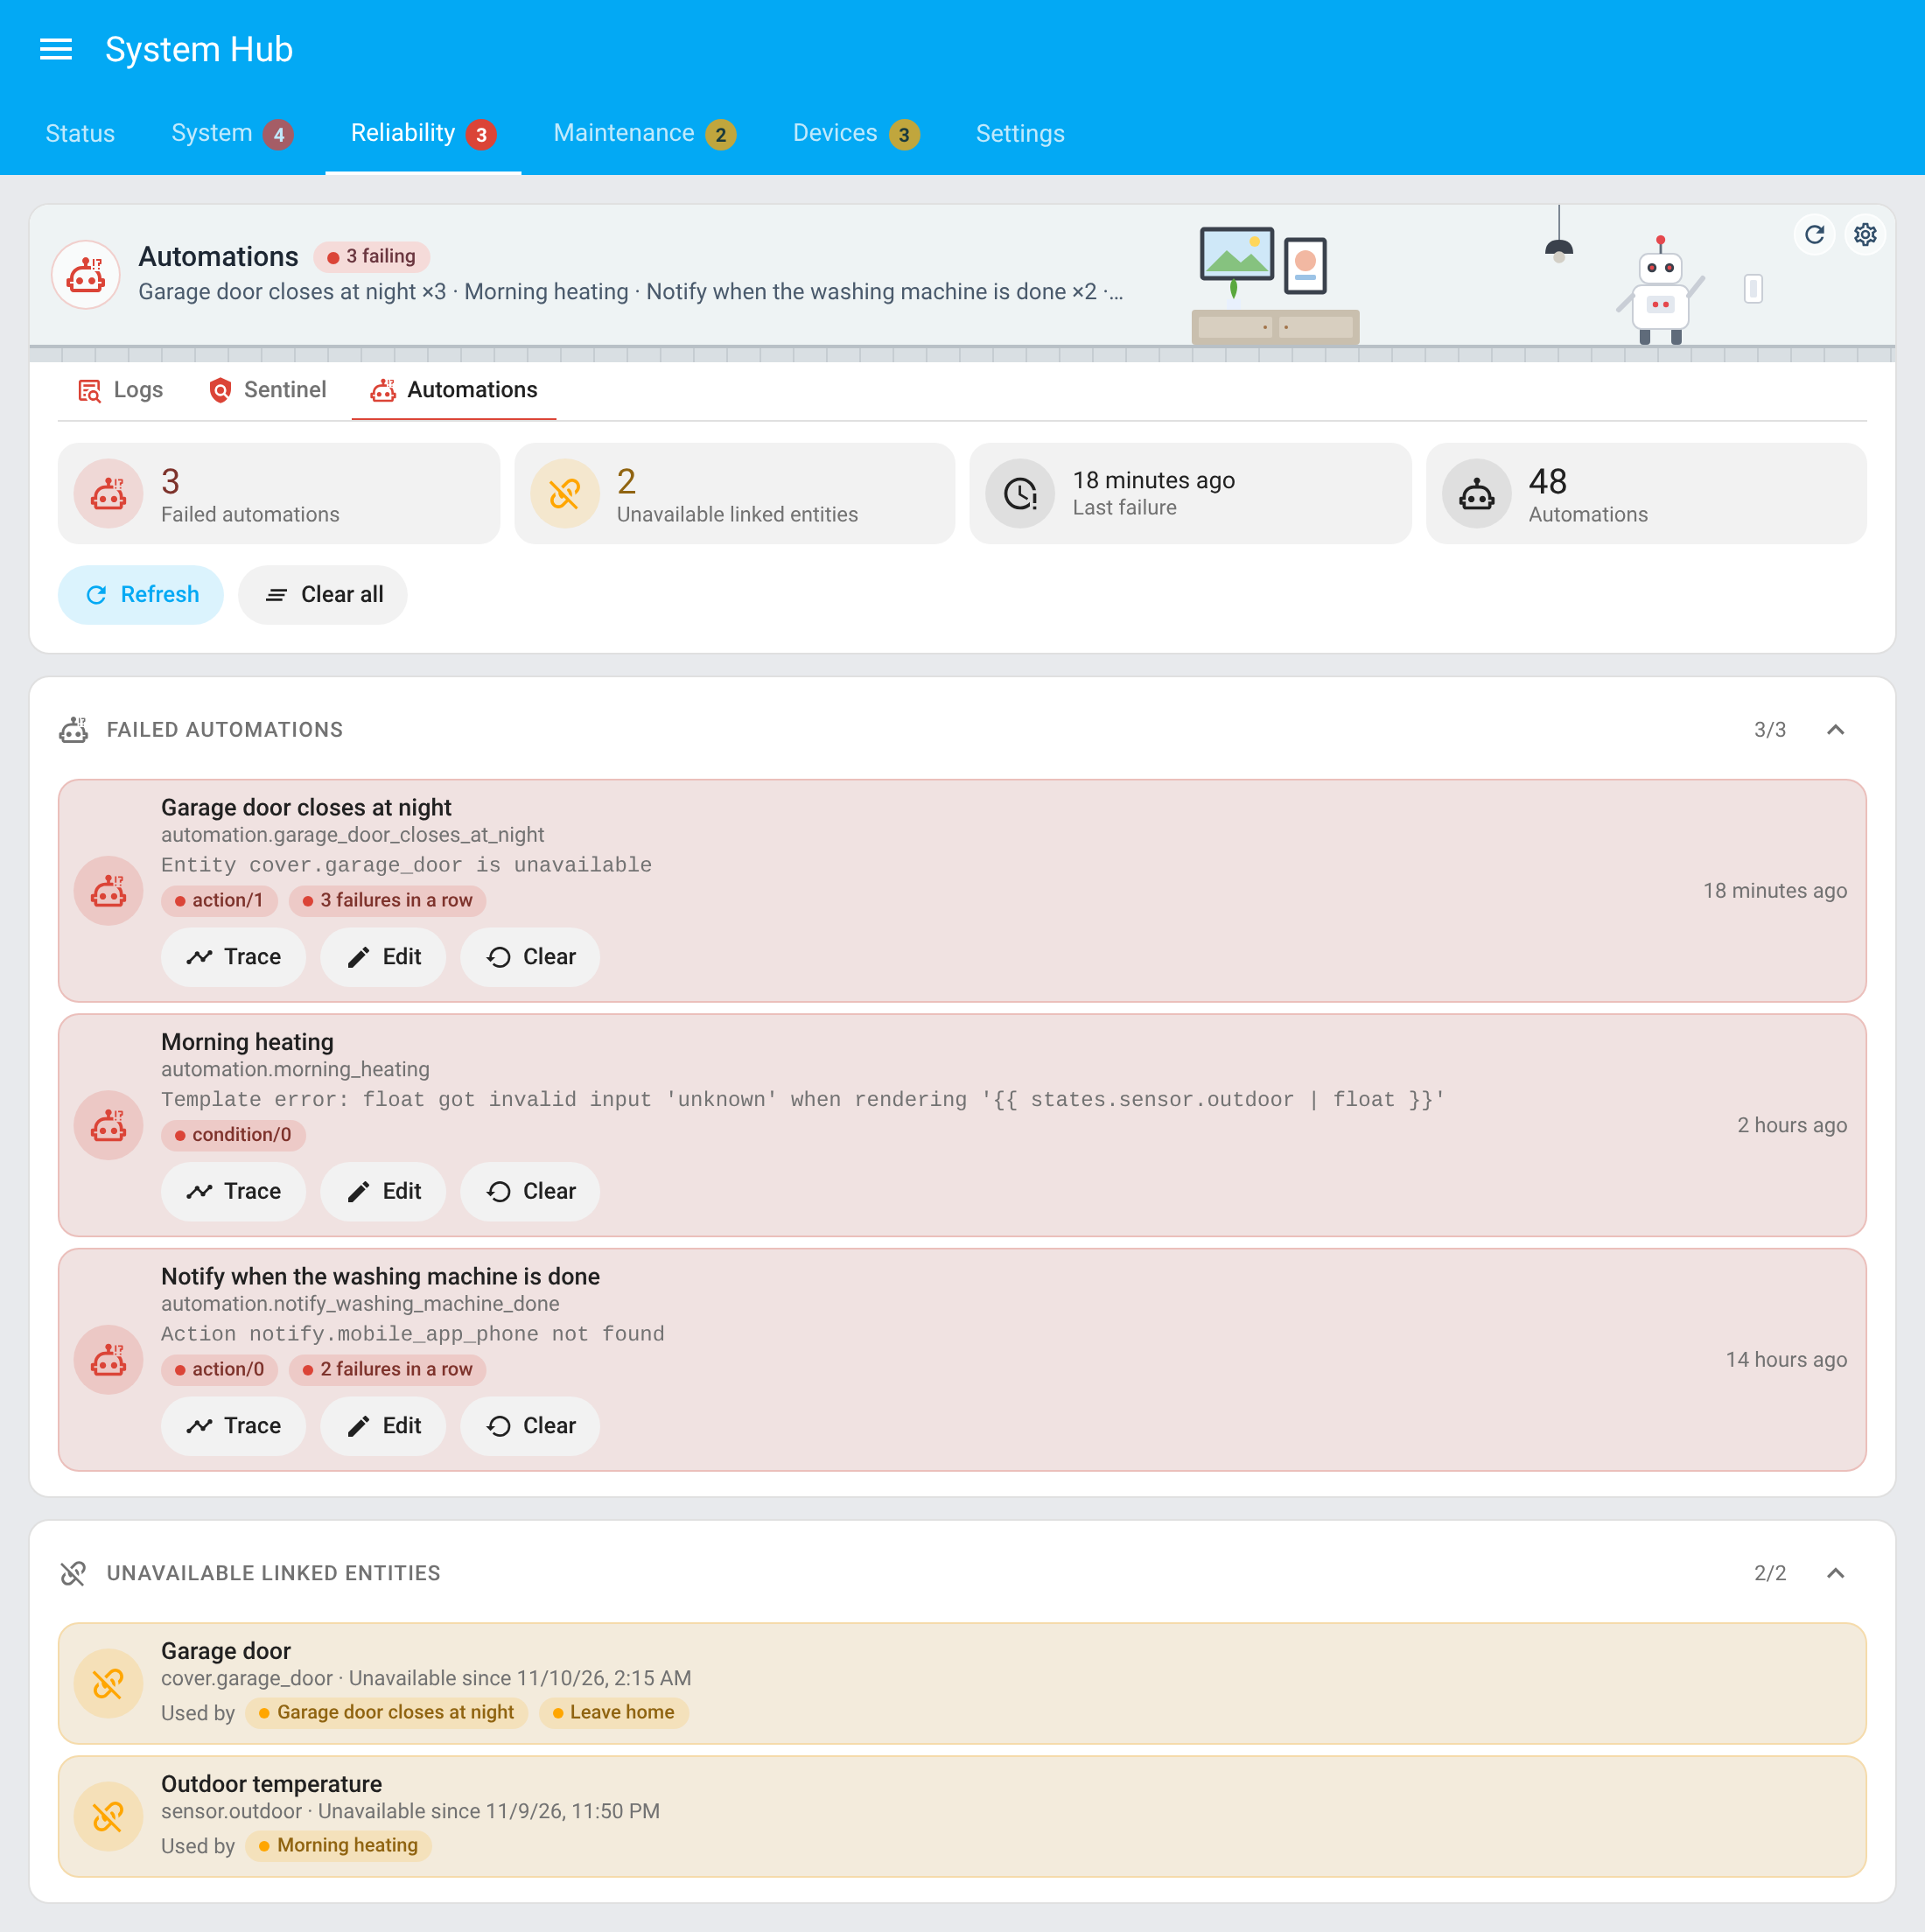 |
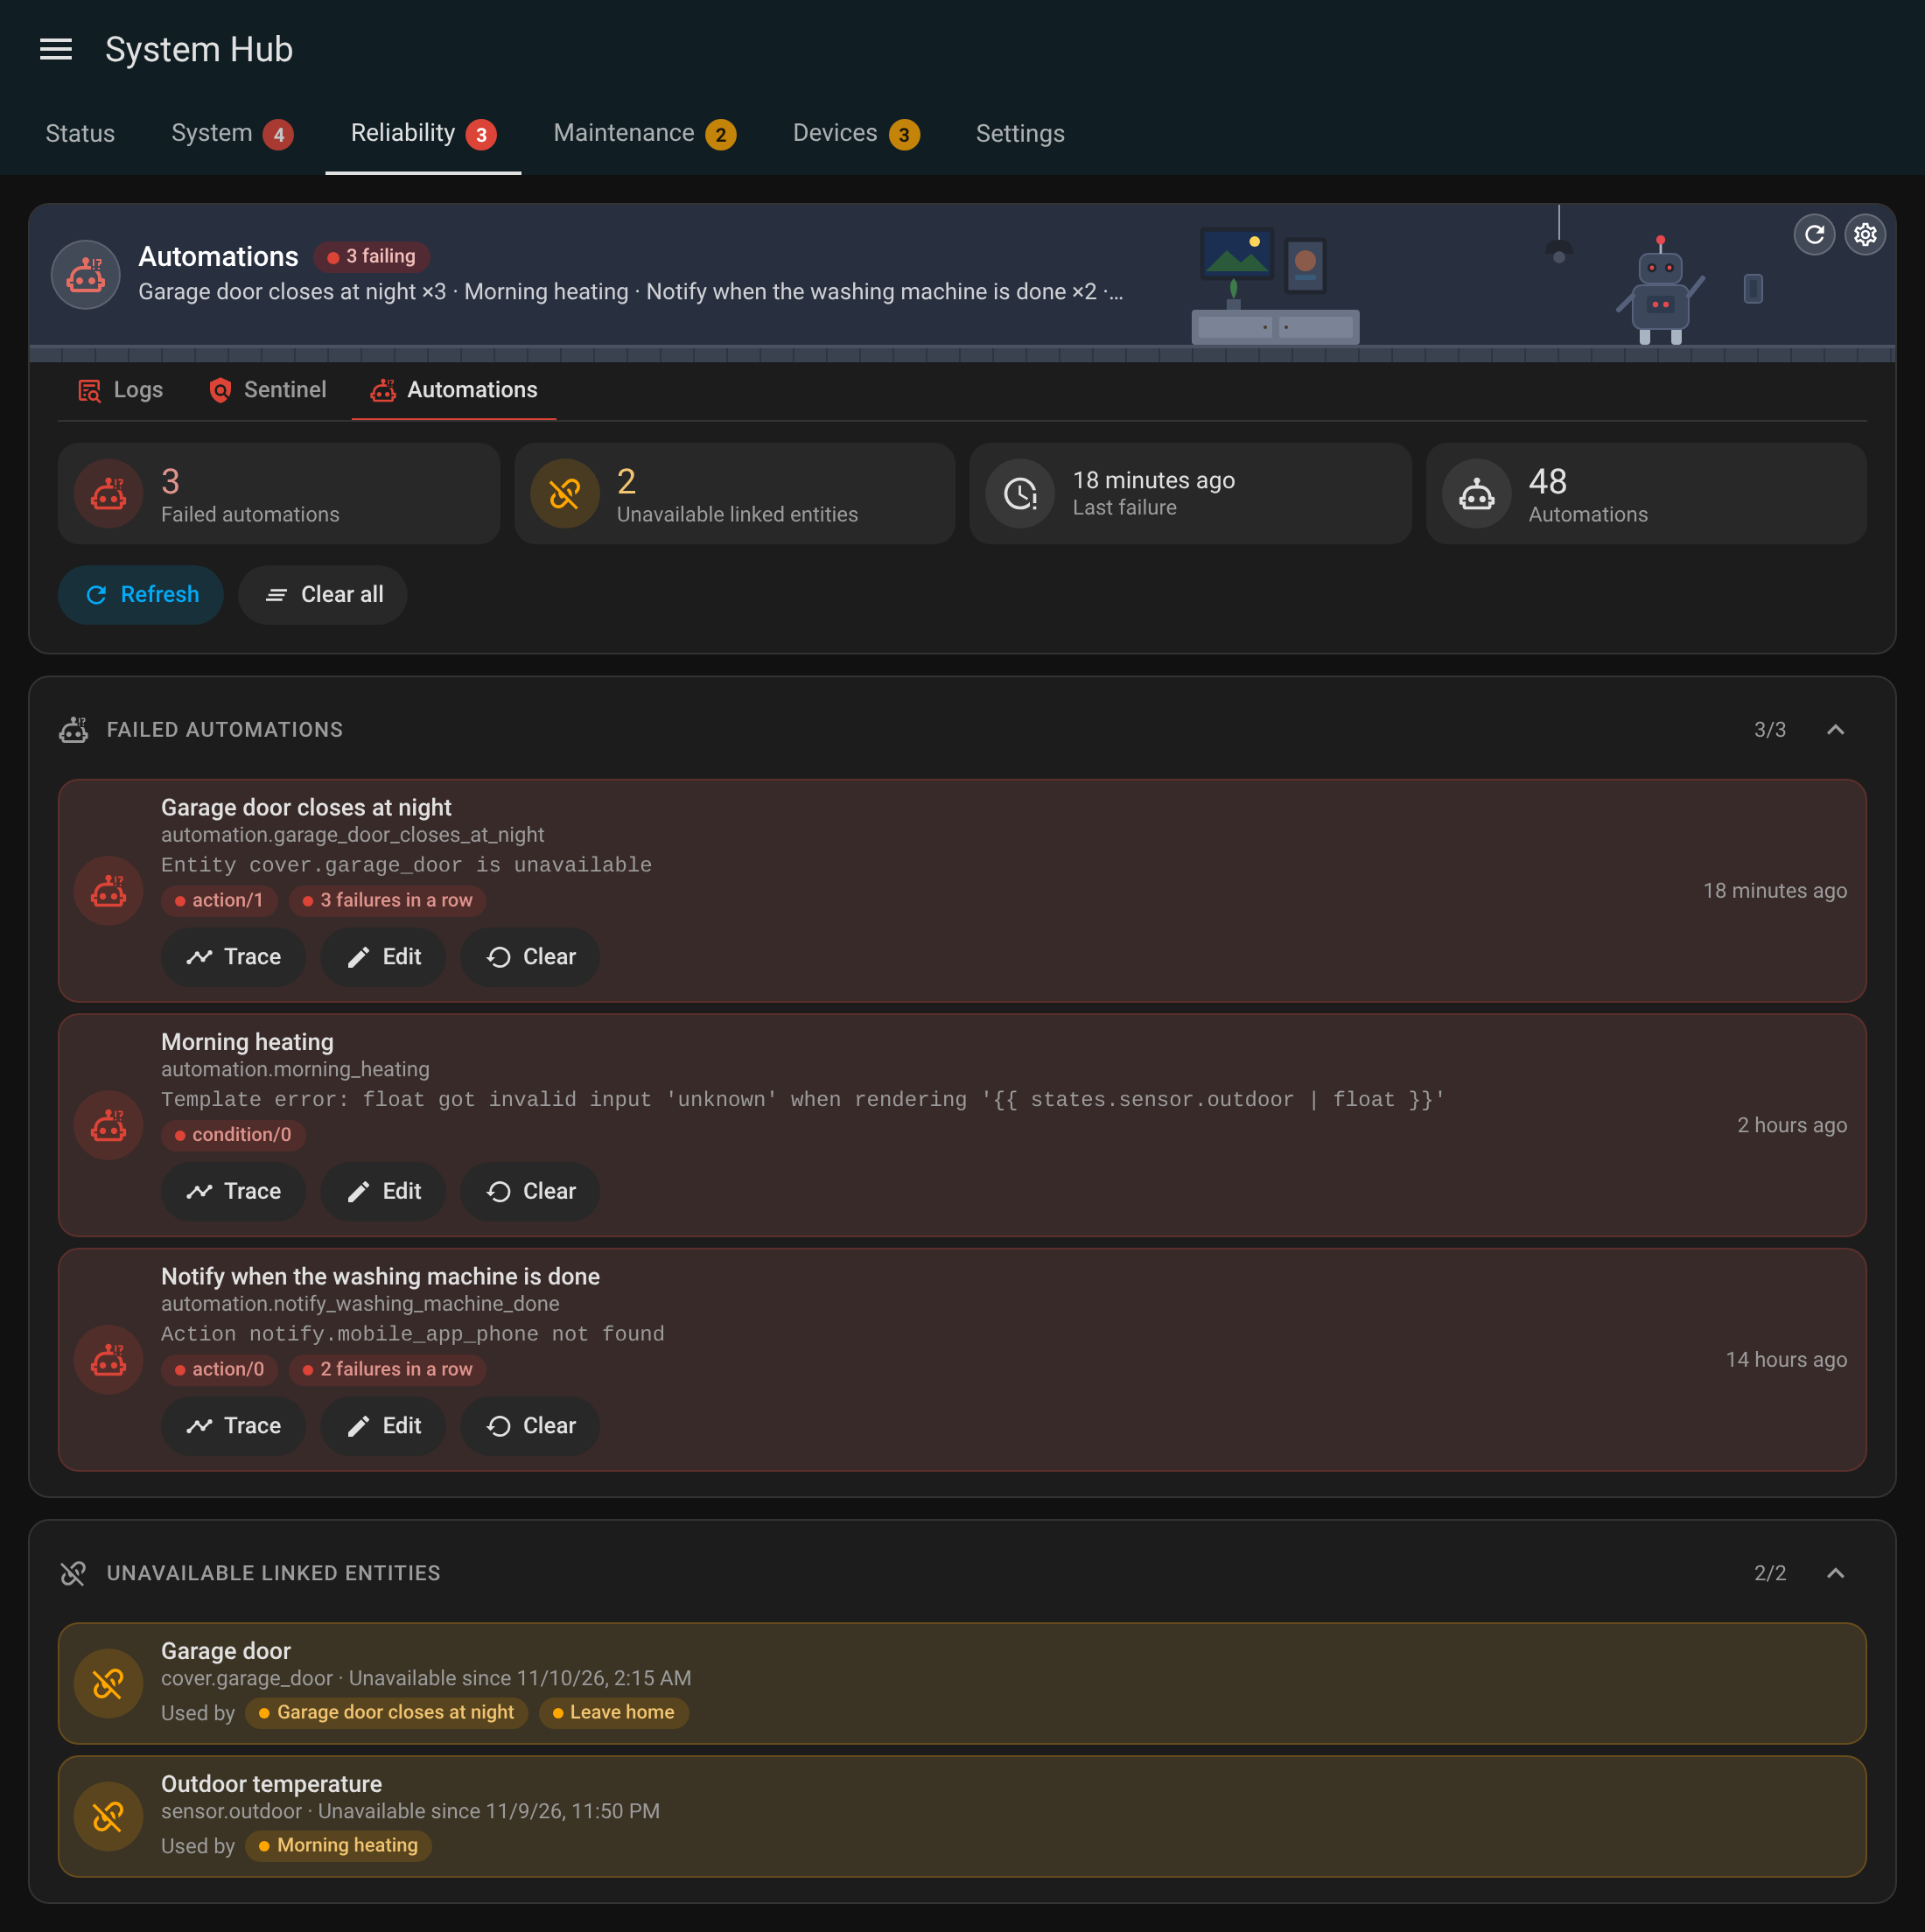 |
| Orphans | 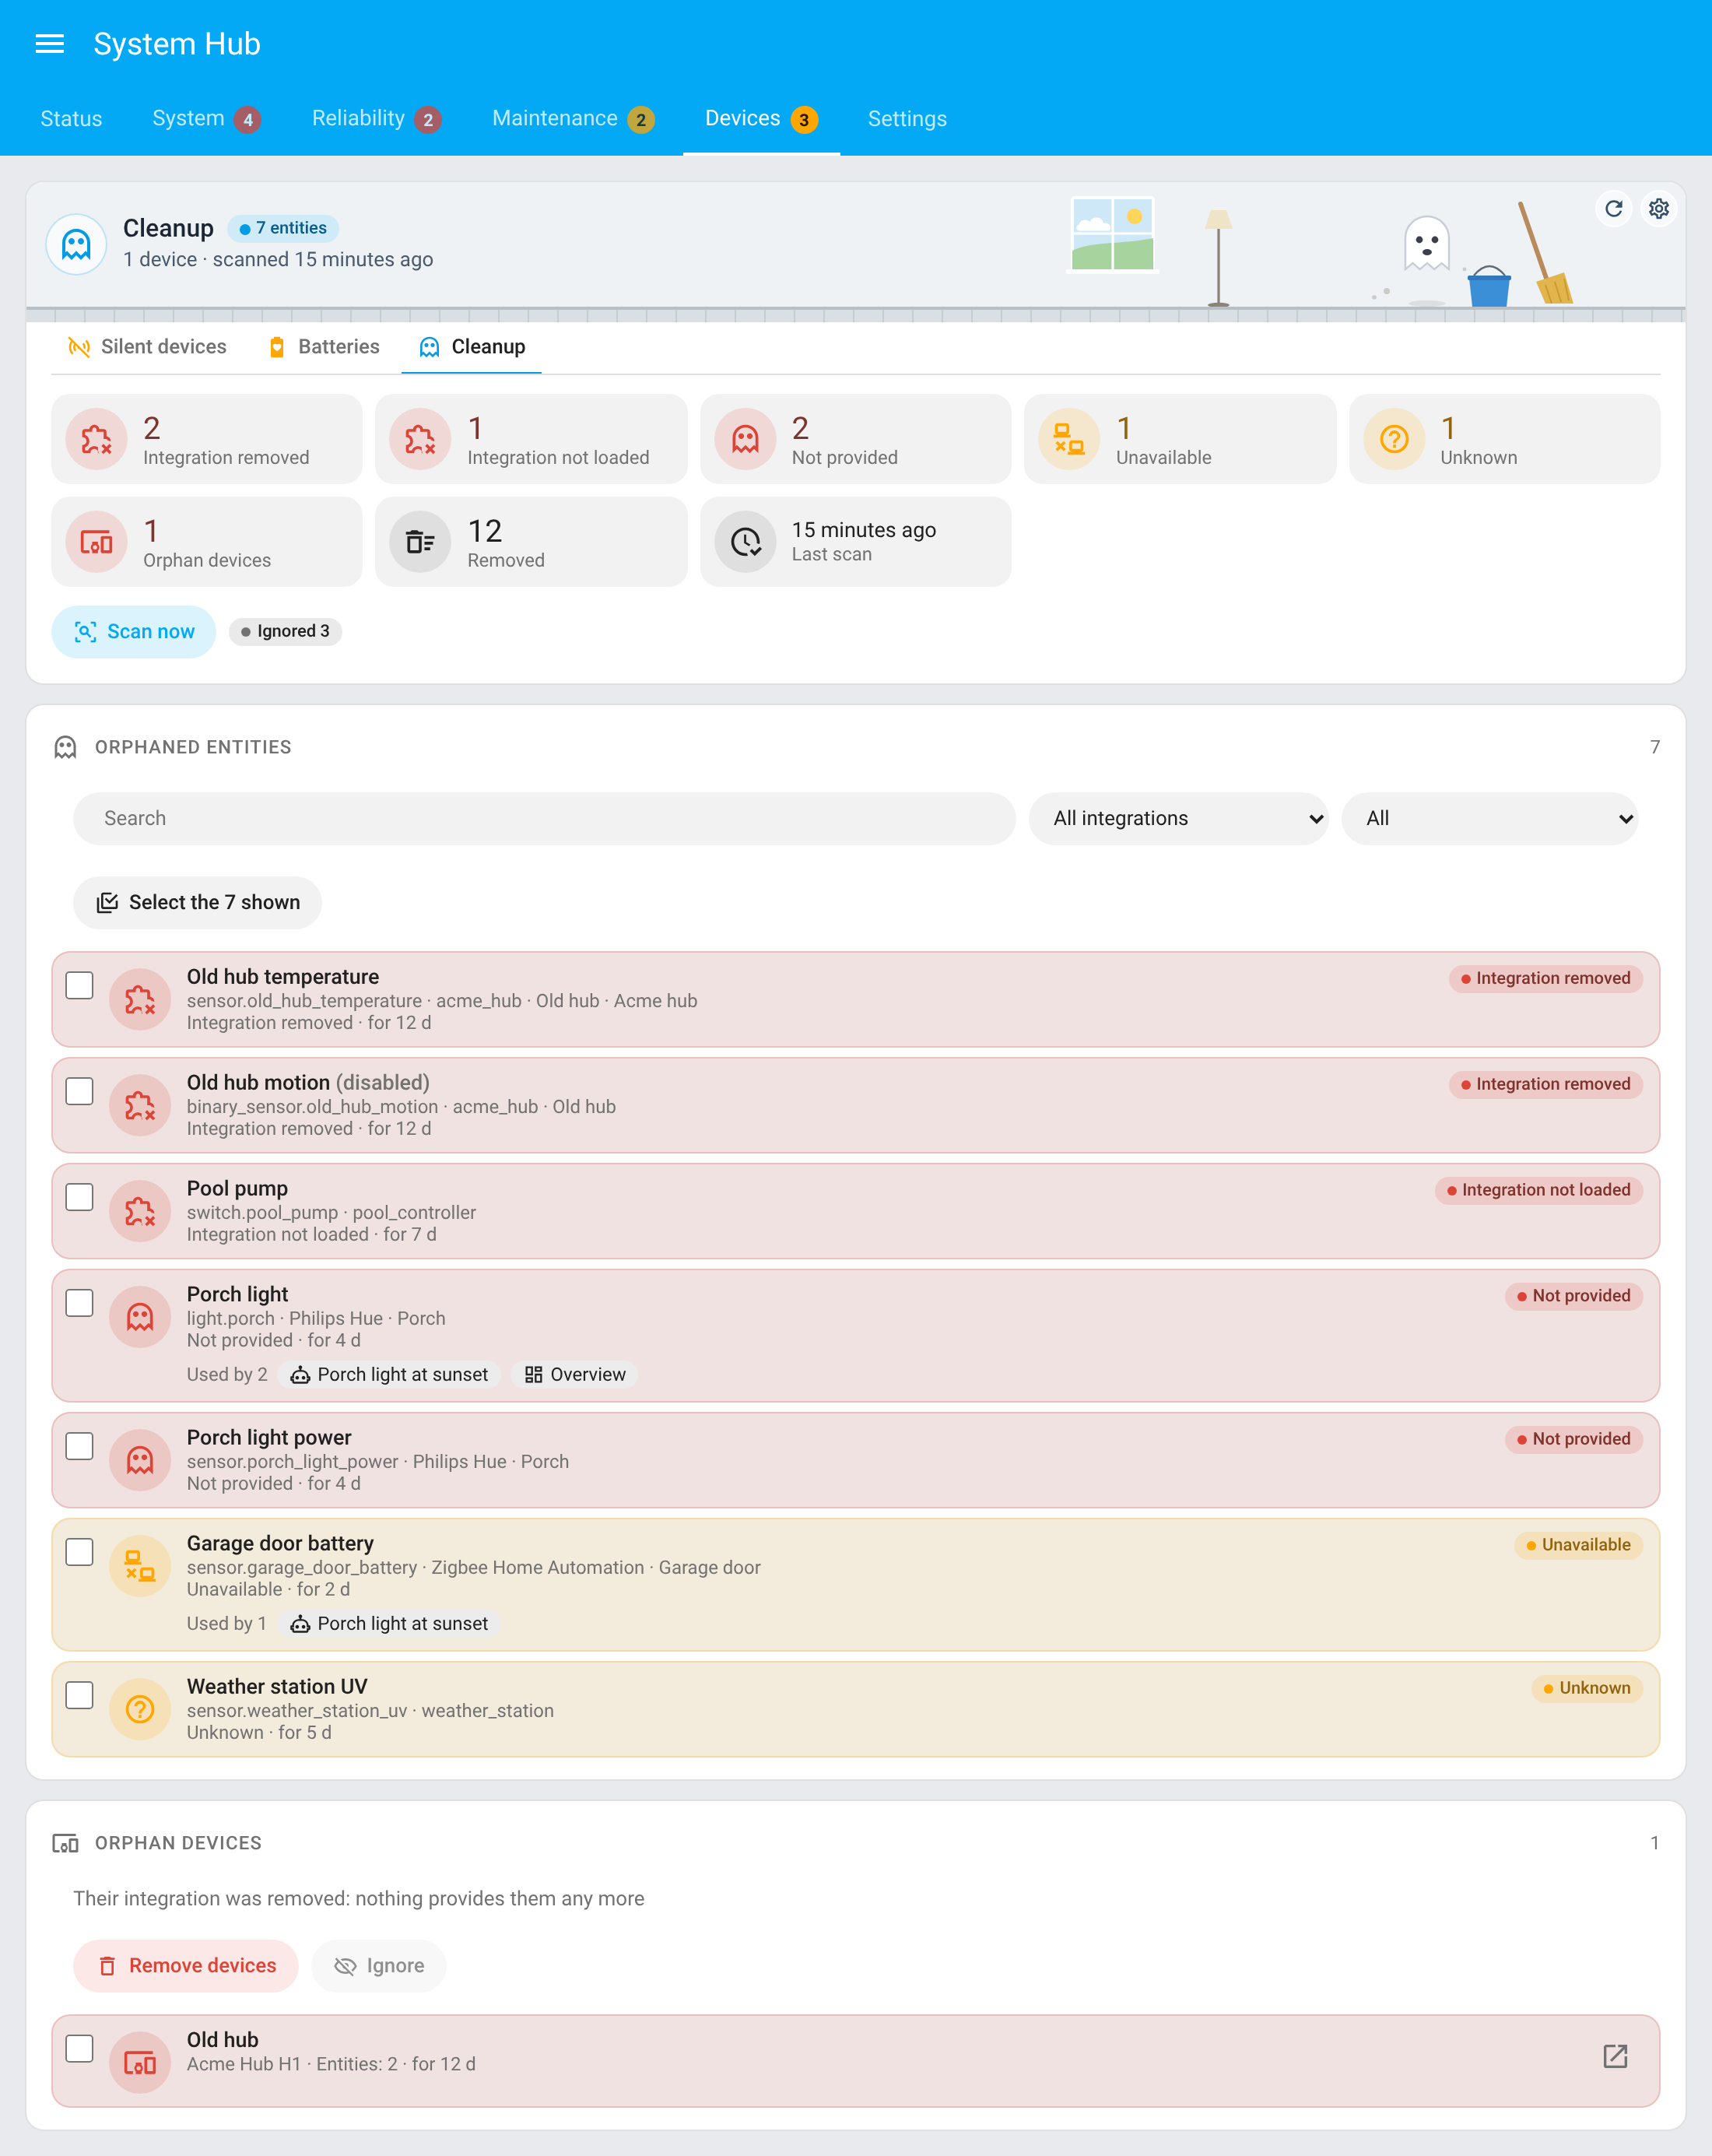 |
 |
| Settings | |
|
The Marketplace check running, the Zigbee and Matter networks of the Silent devices tab, the batteries by room, by type and by replacement date, the Git Sync diff viewer and the Orphans removal asked first:
| View | Light | Dark |
|---|---|---|
| Marketplace check running | 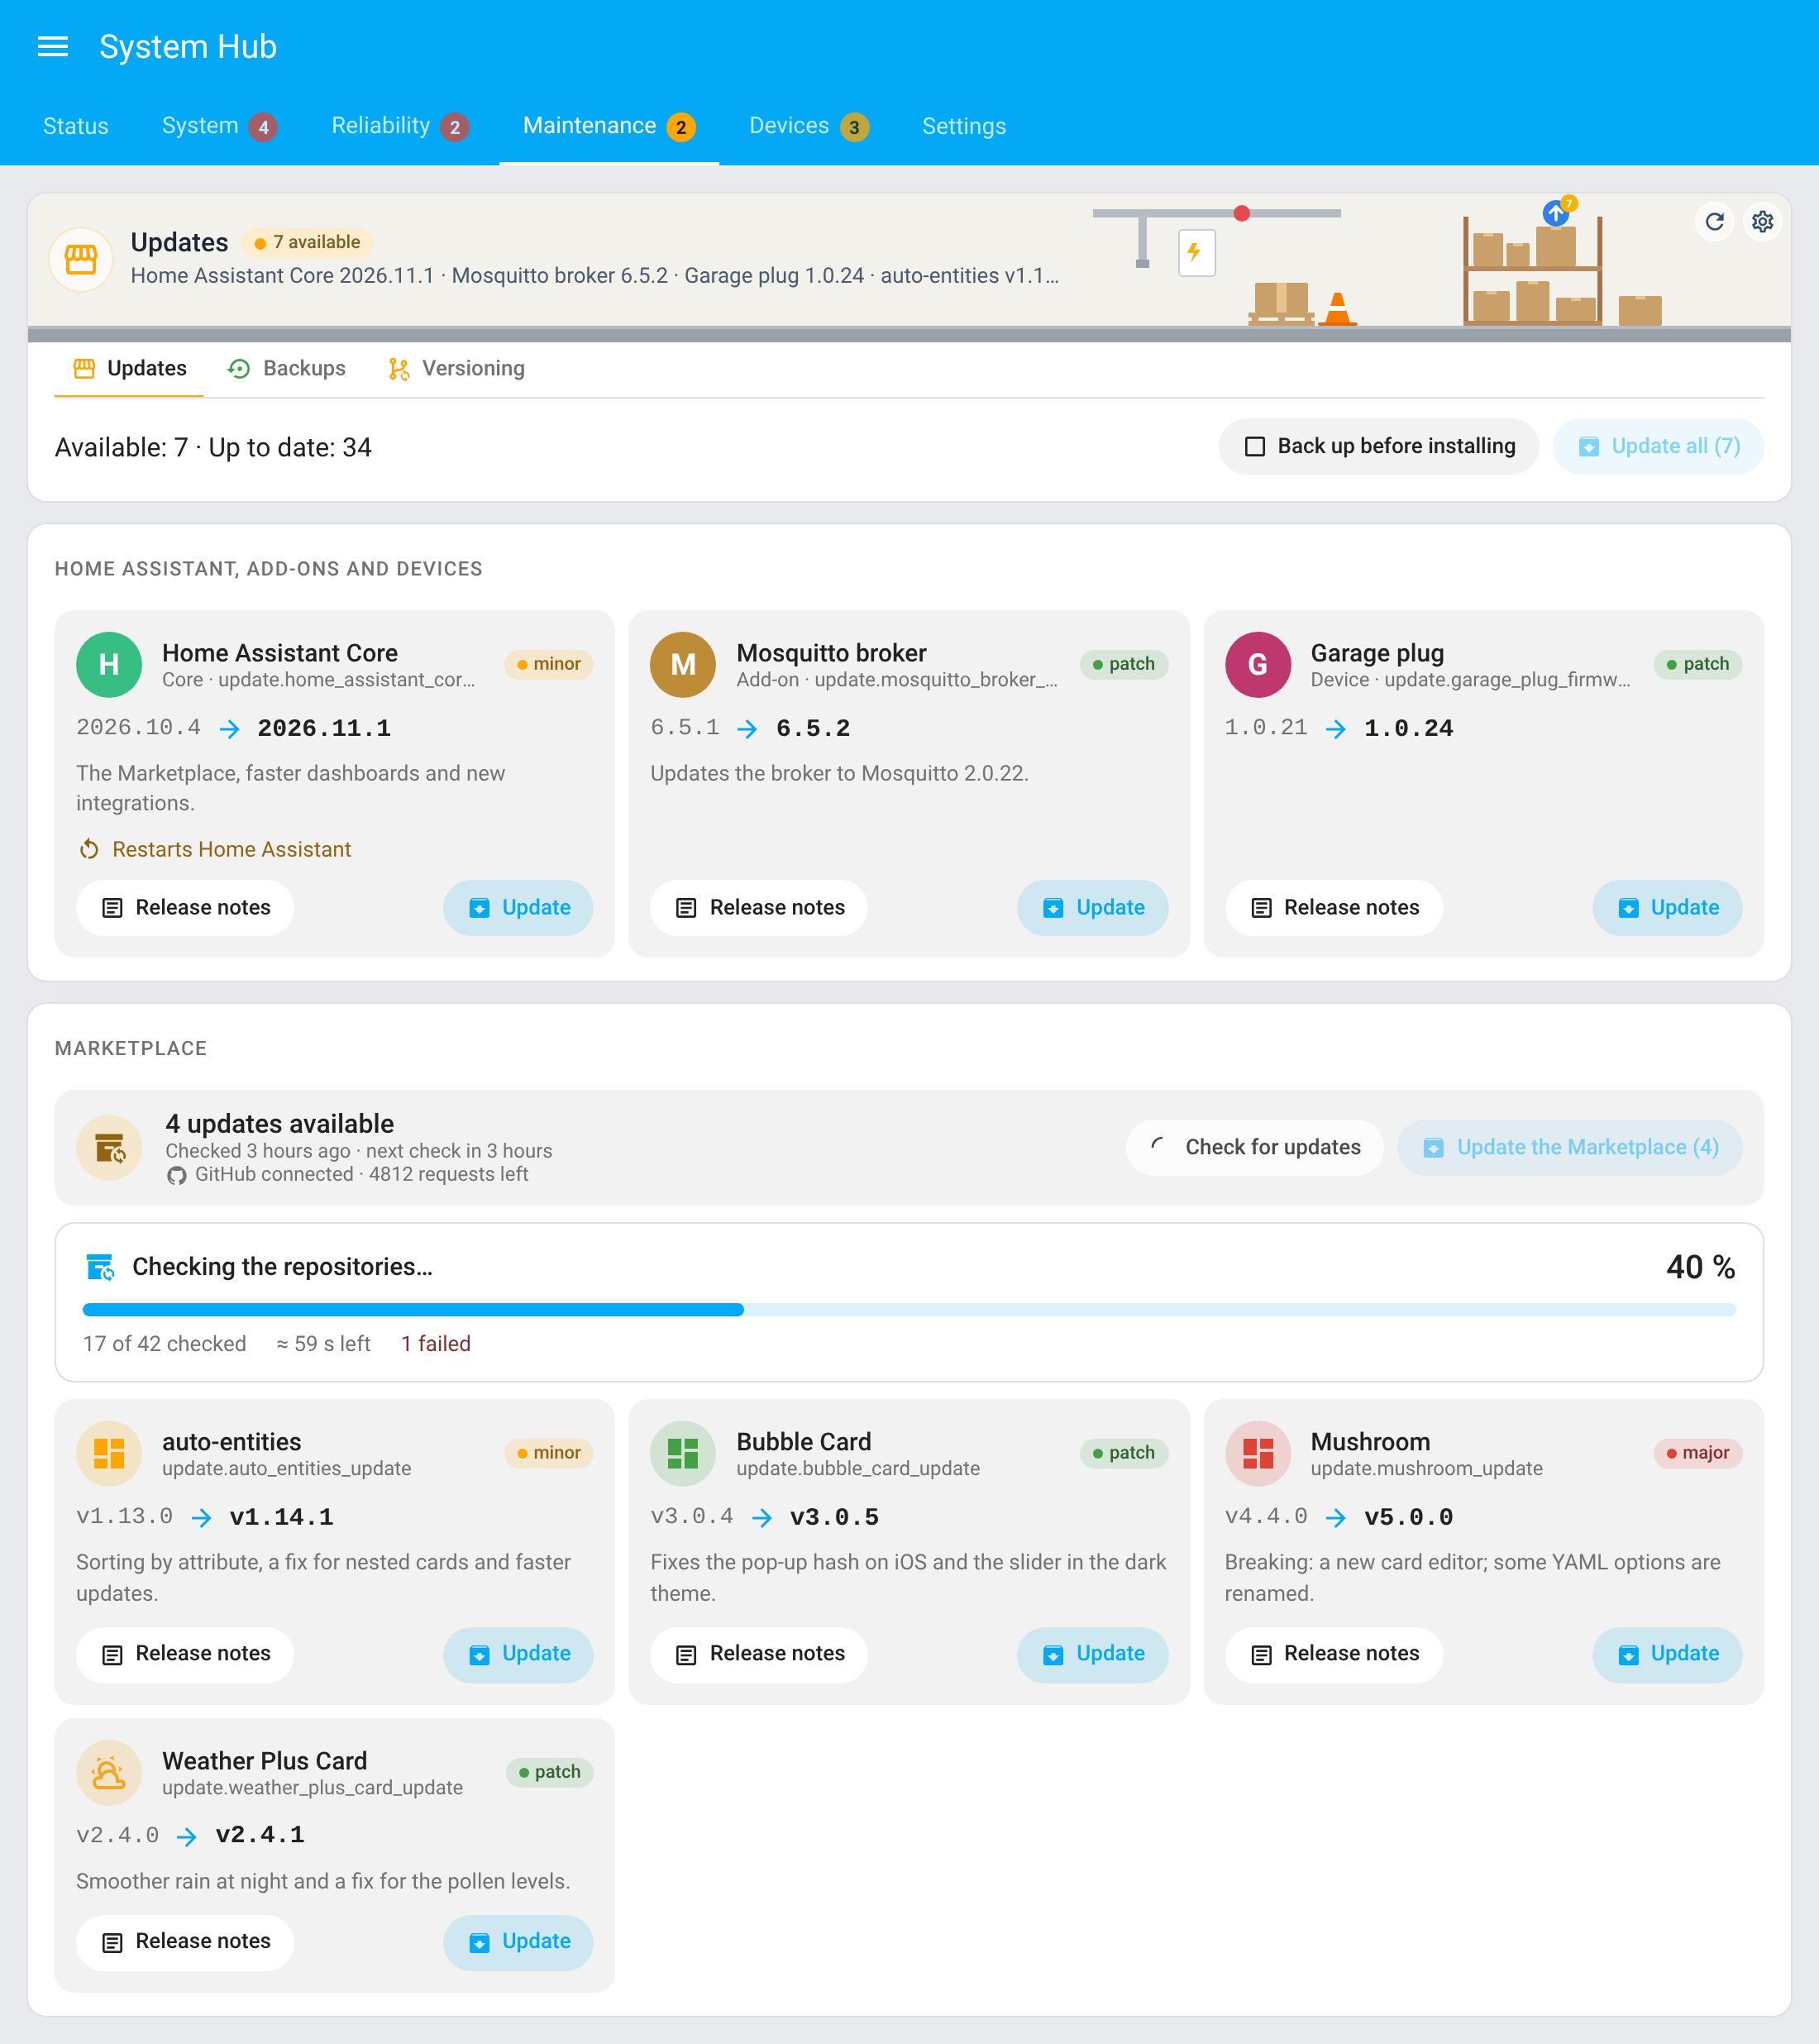 |
 |
| Zigbee network | 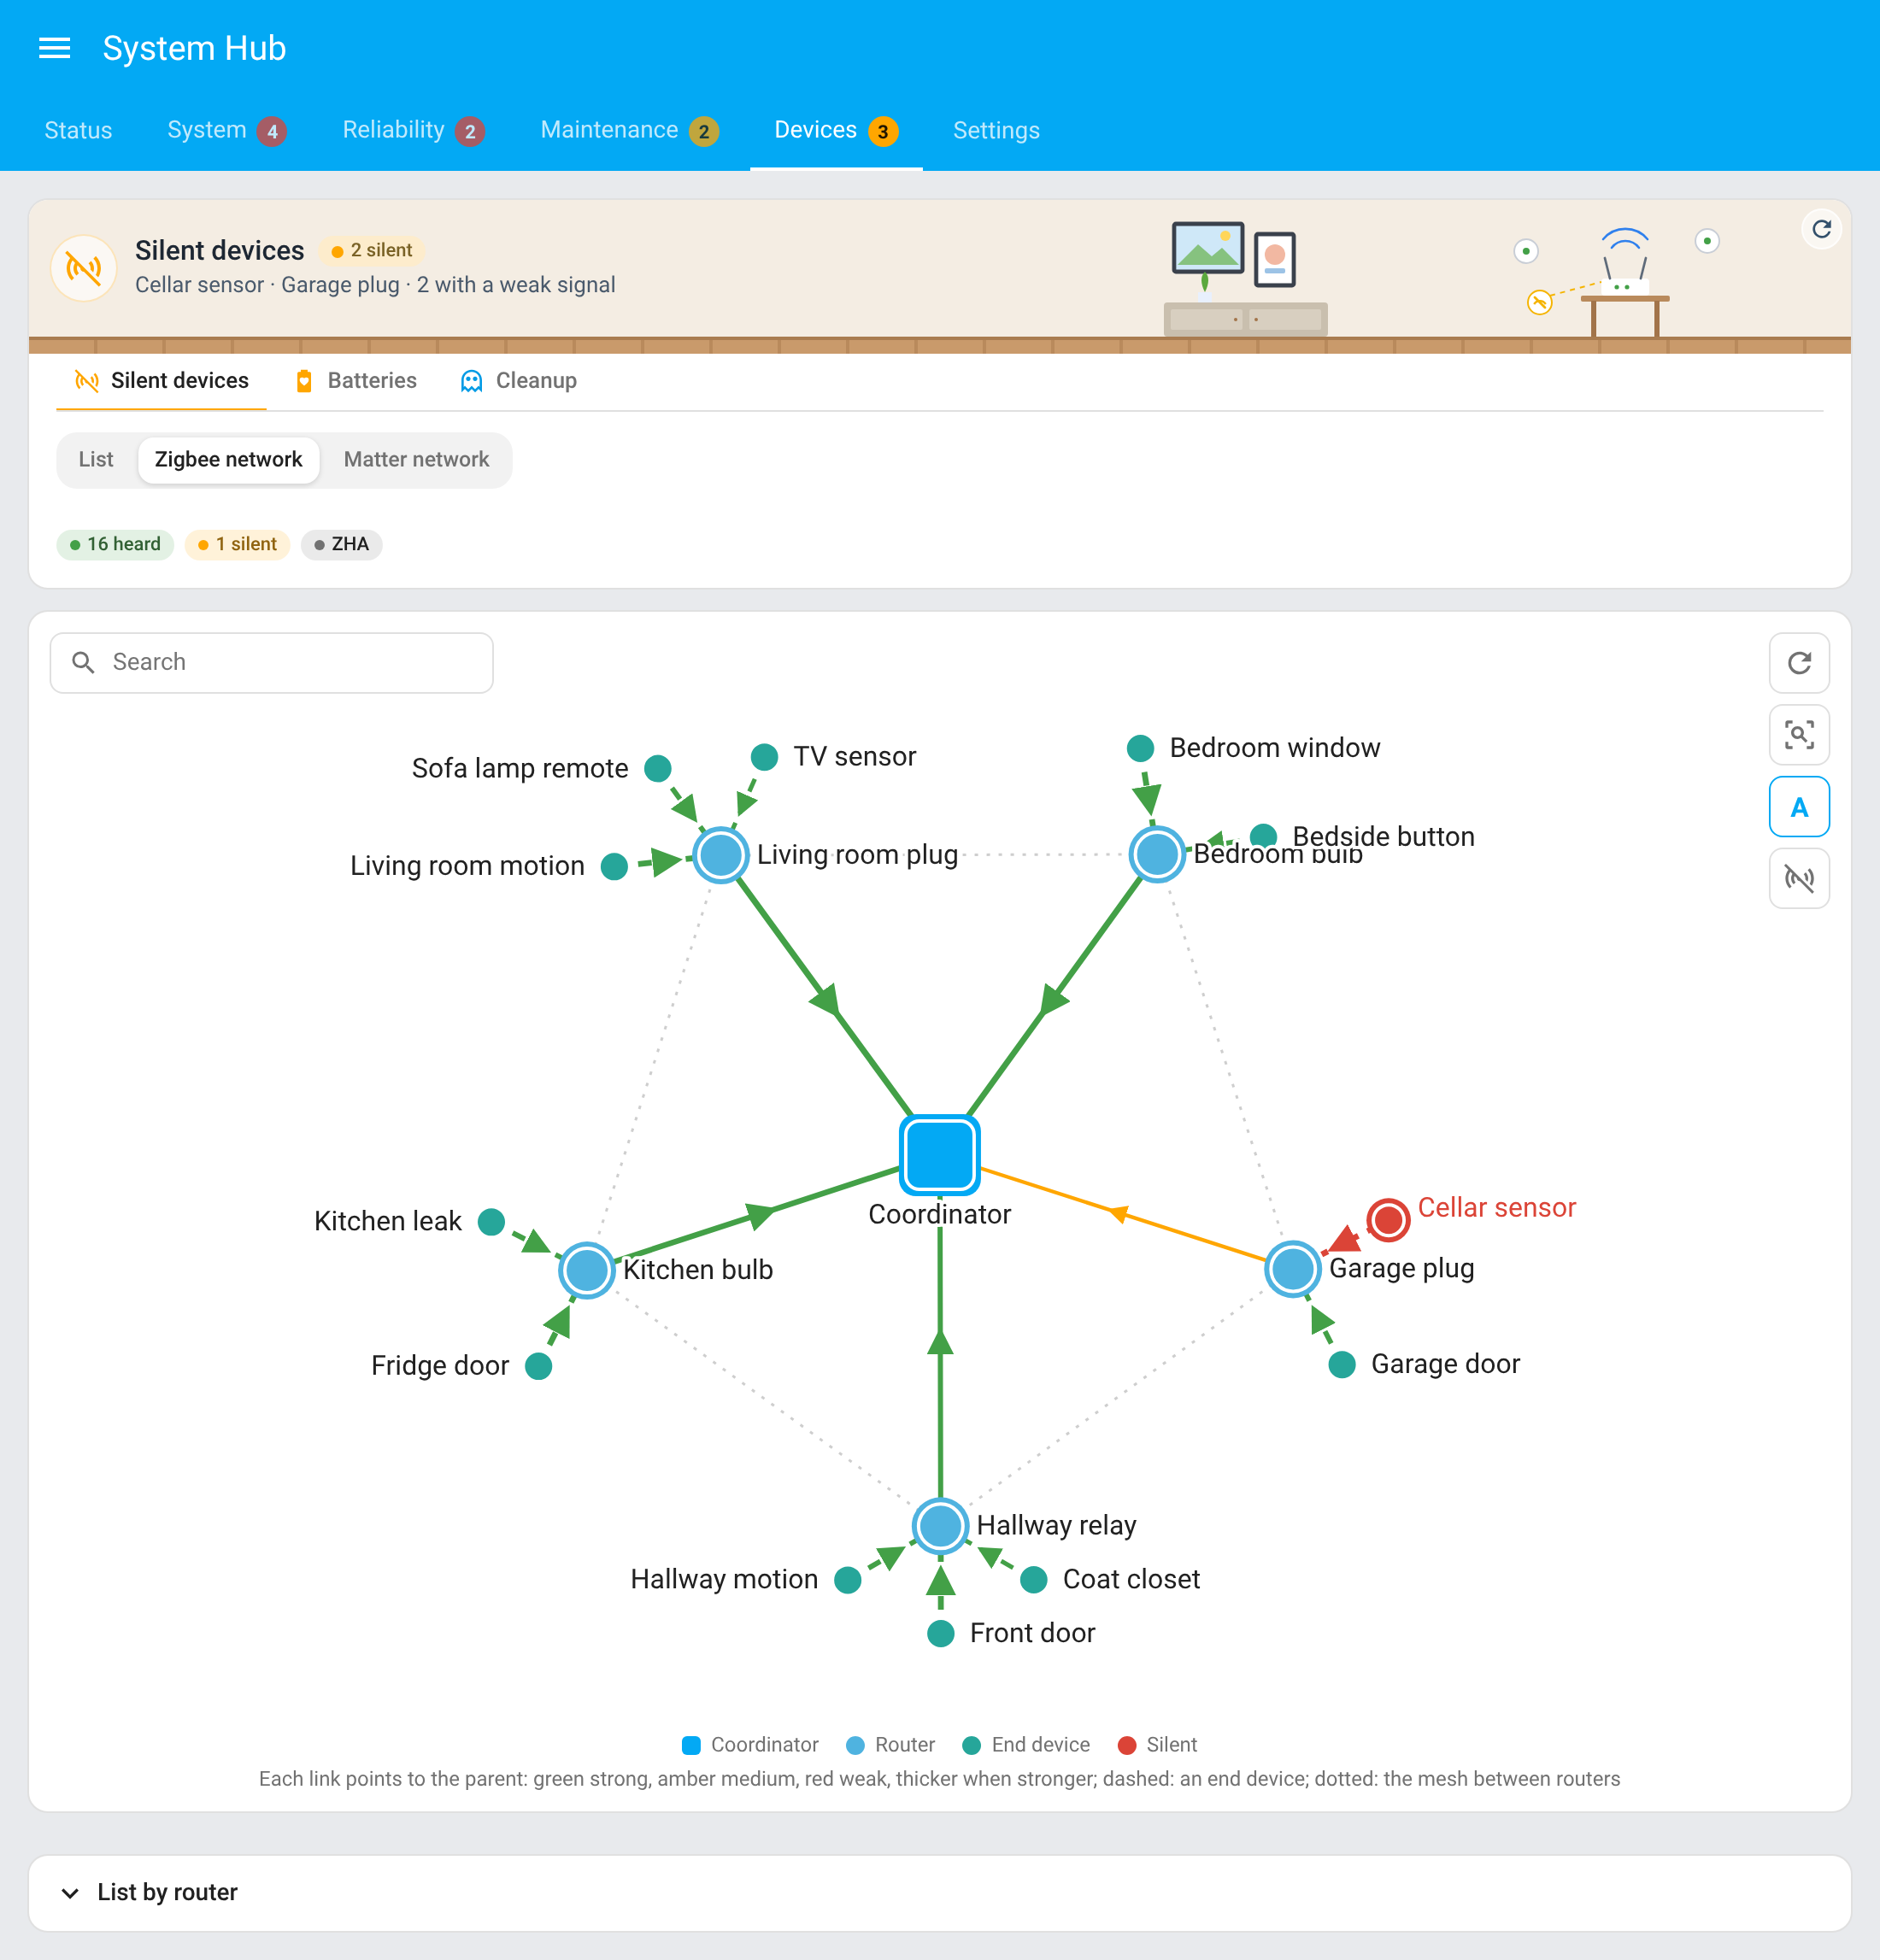 |
 |
| Matter network | 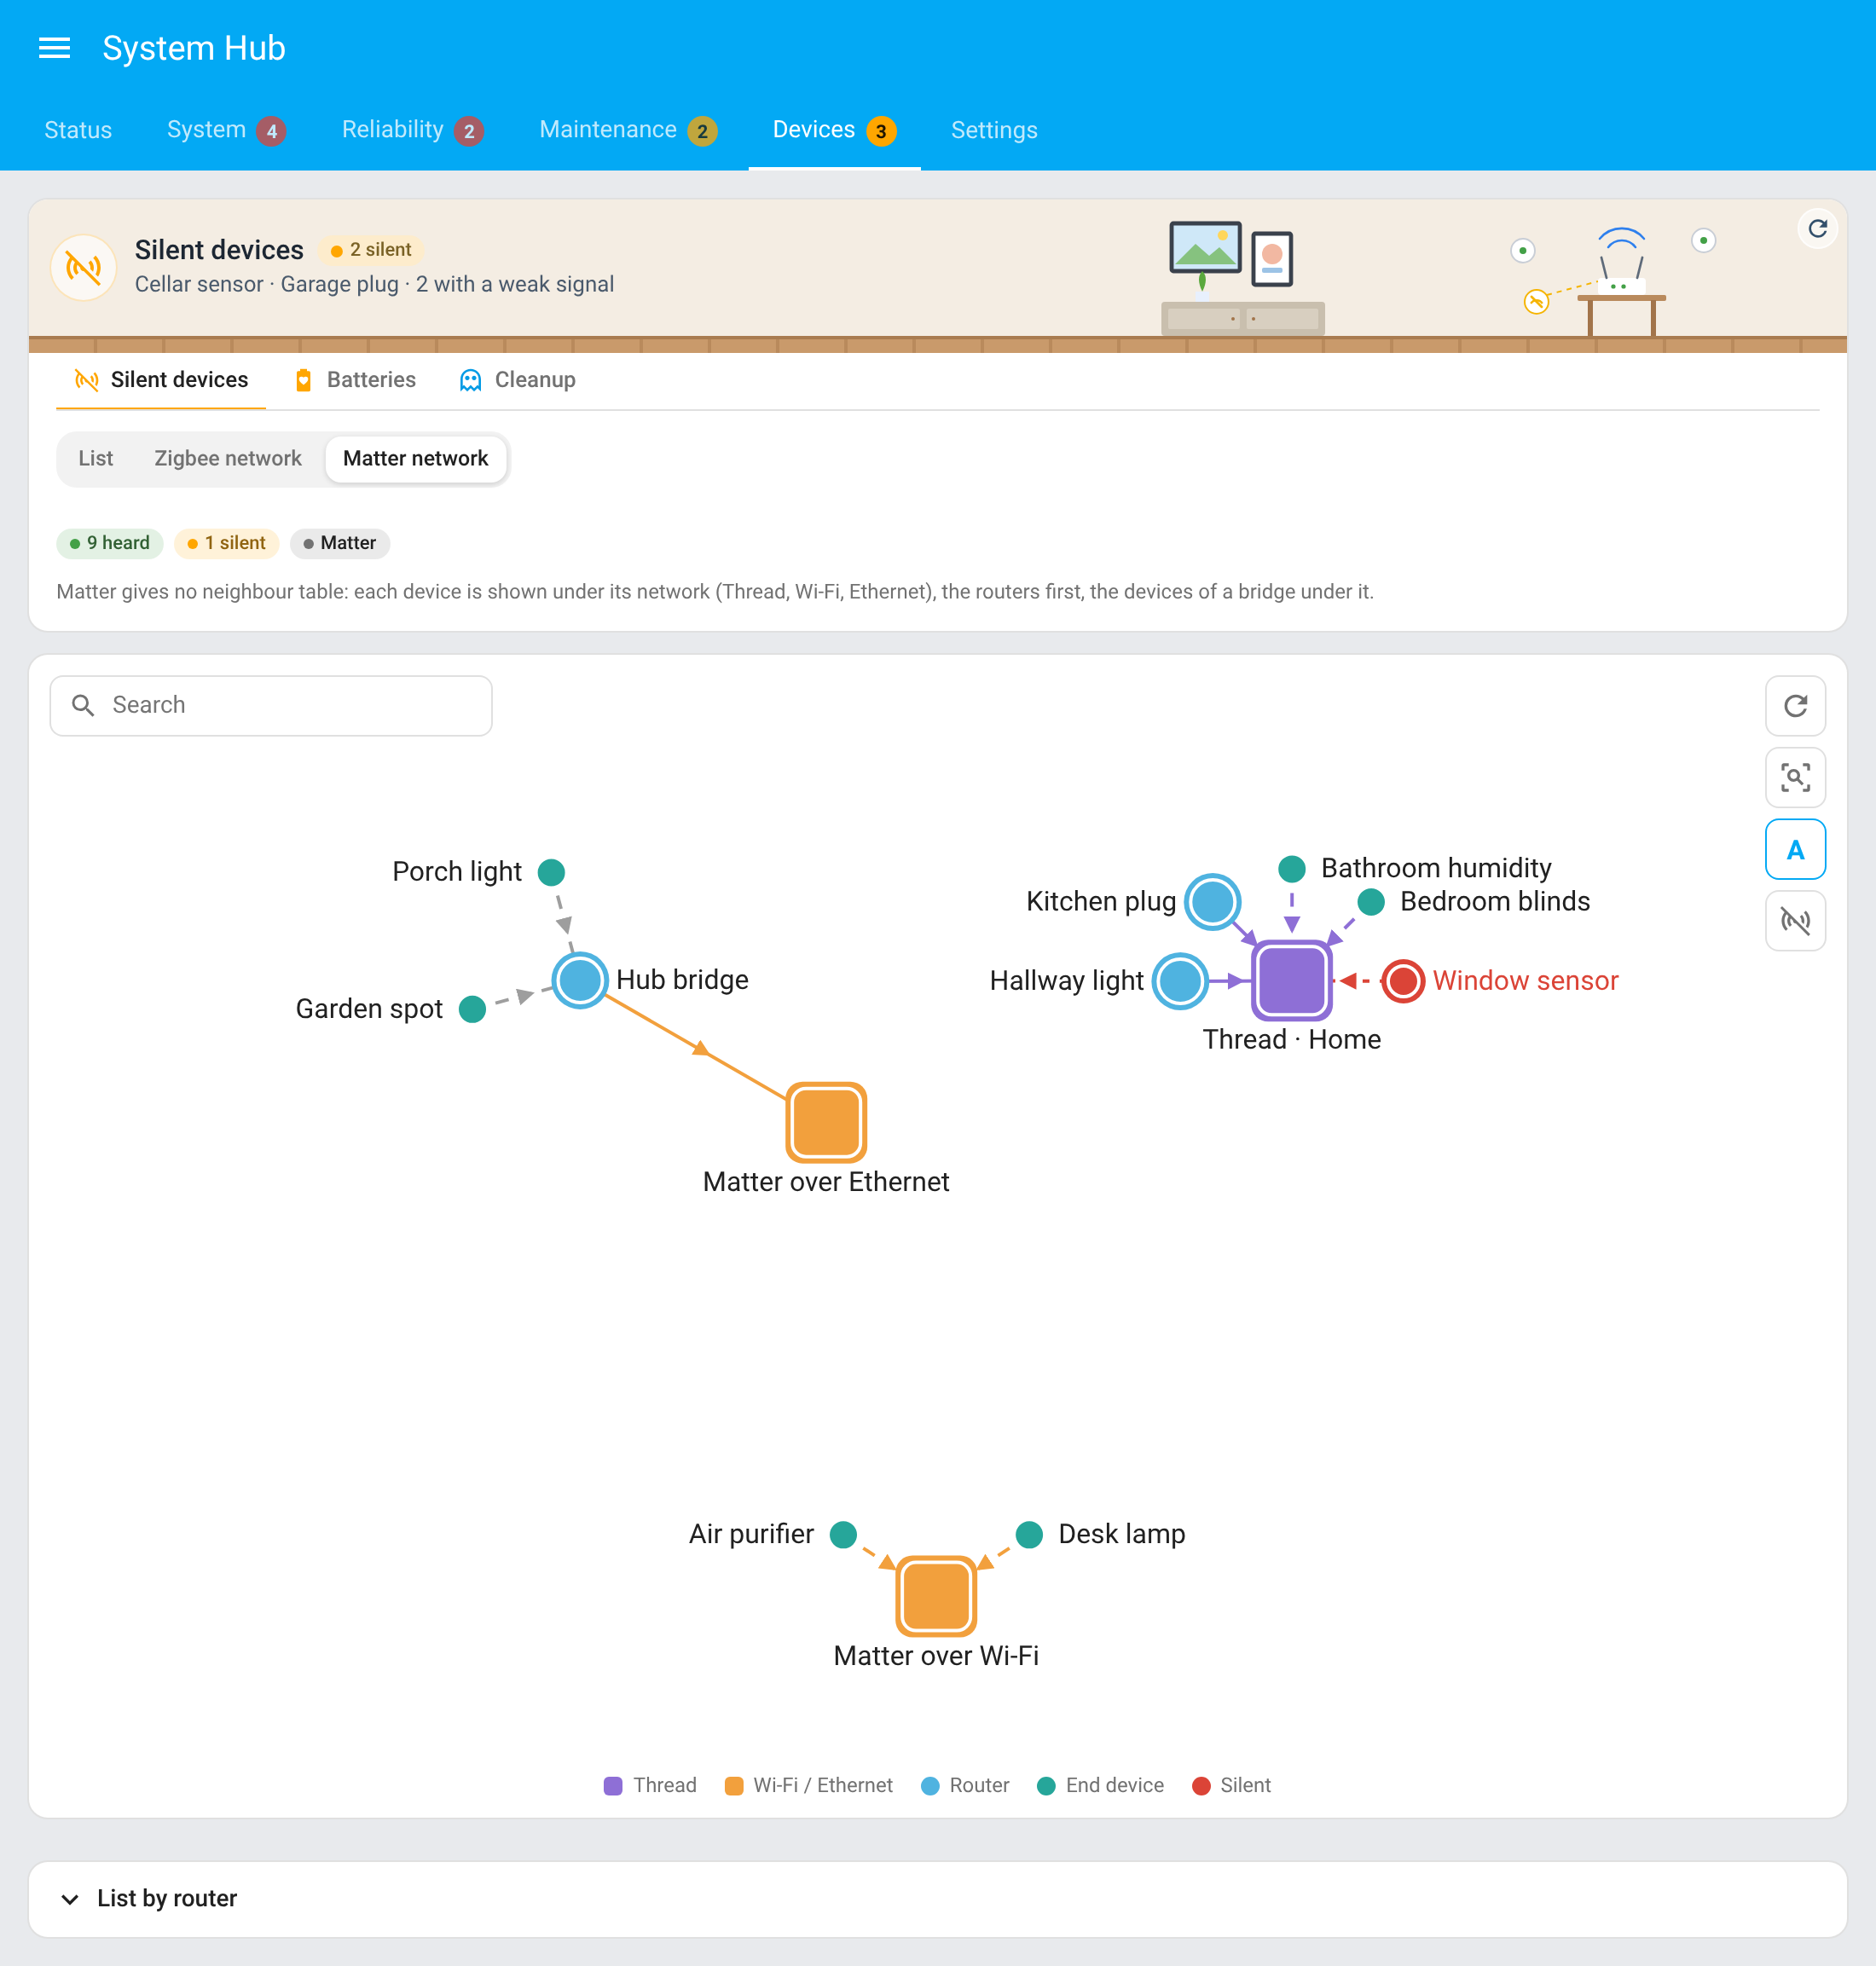 |
 |
| By room | 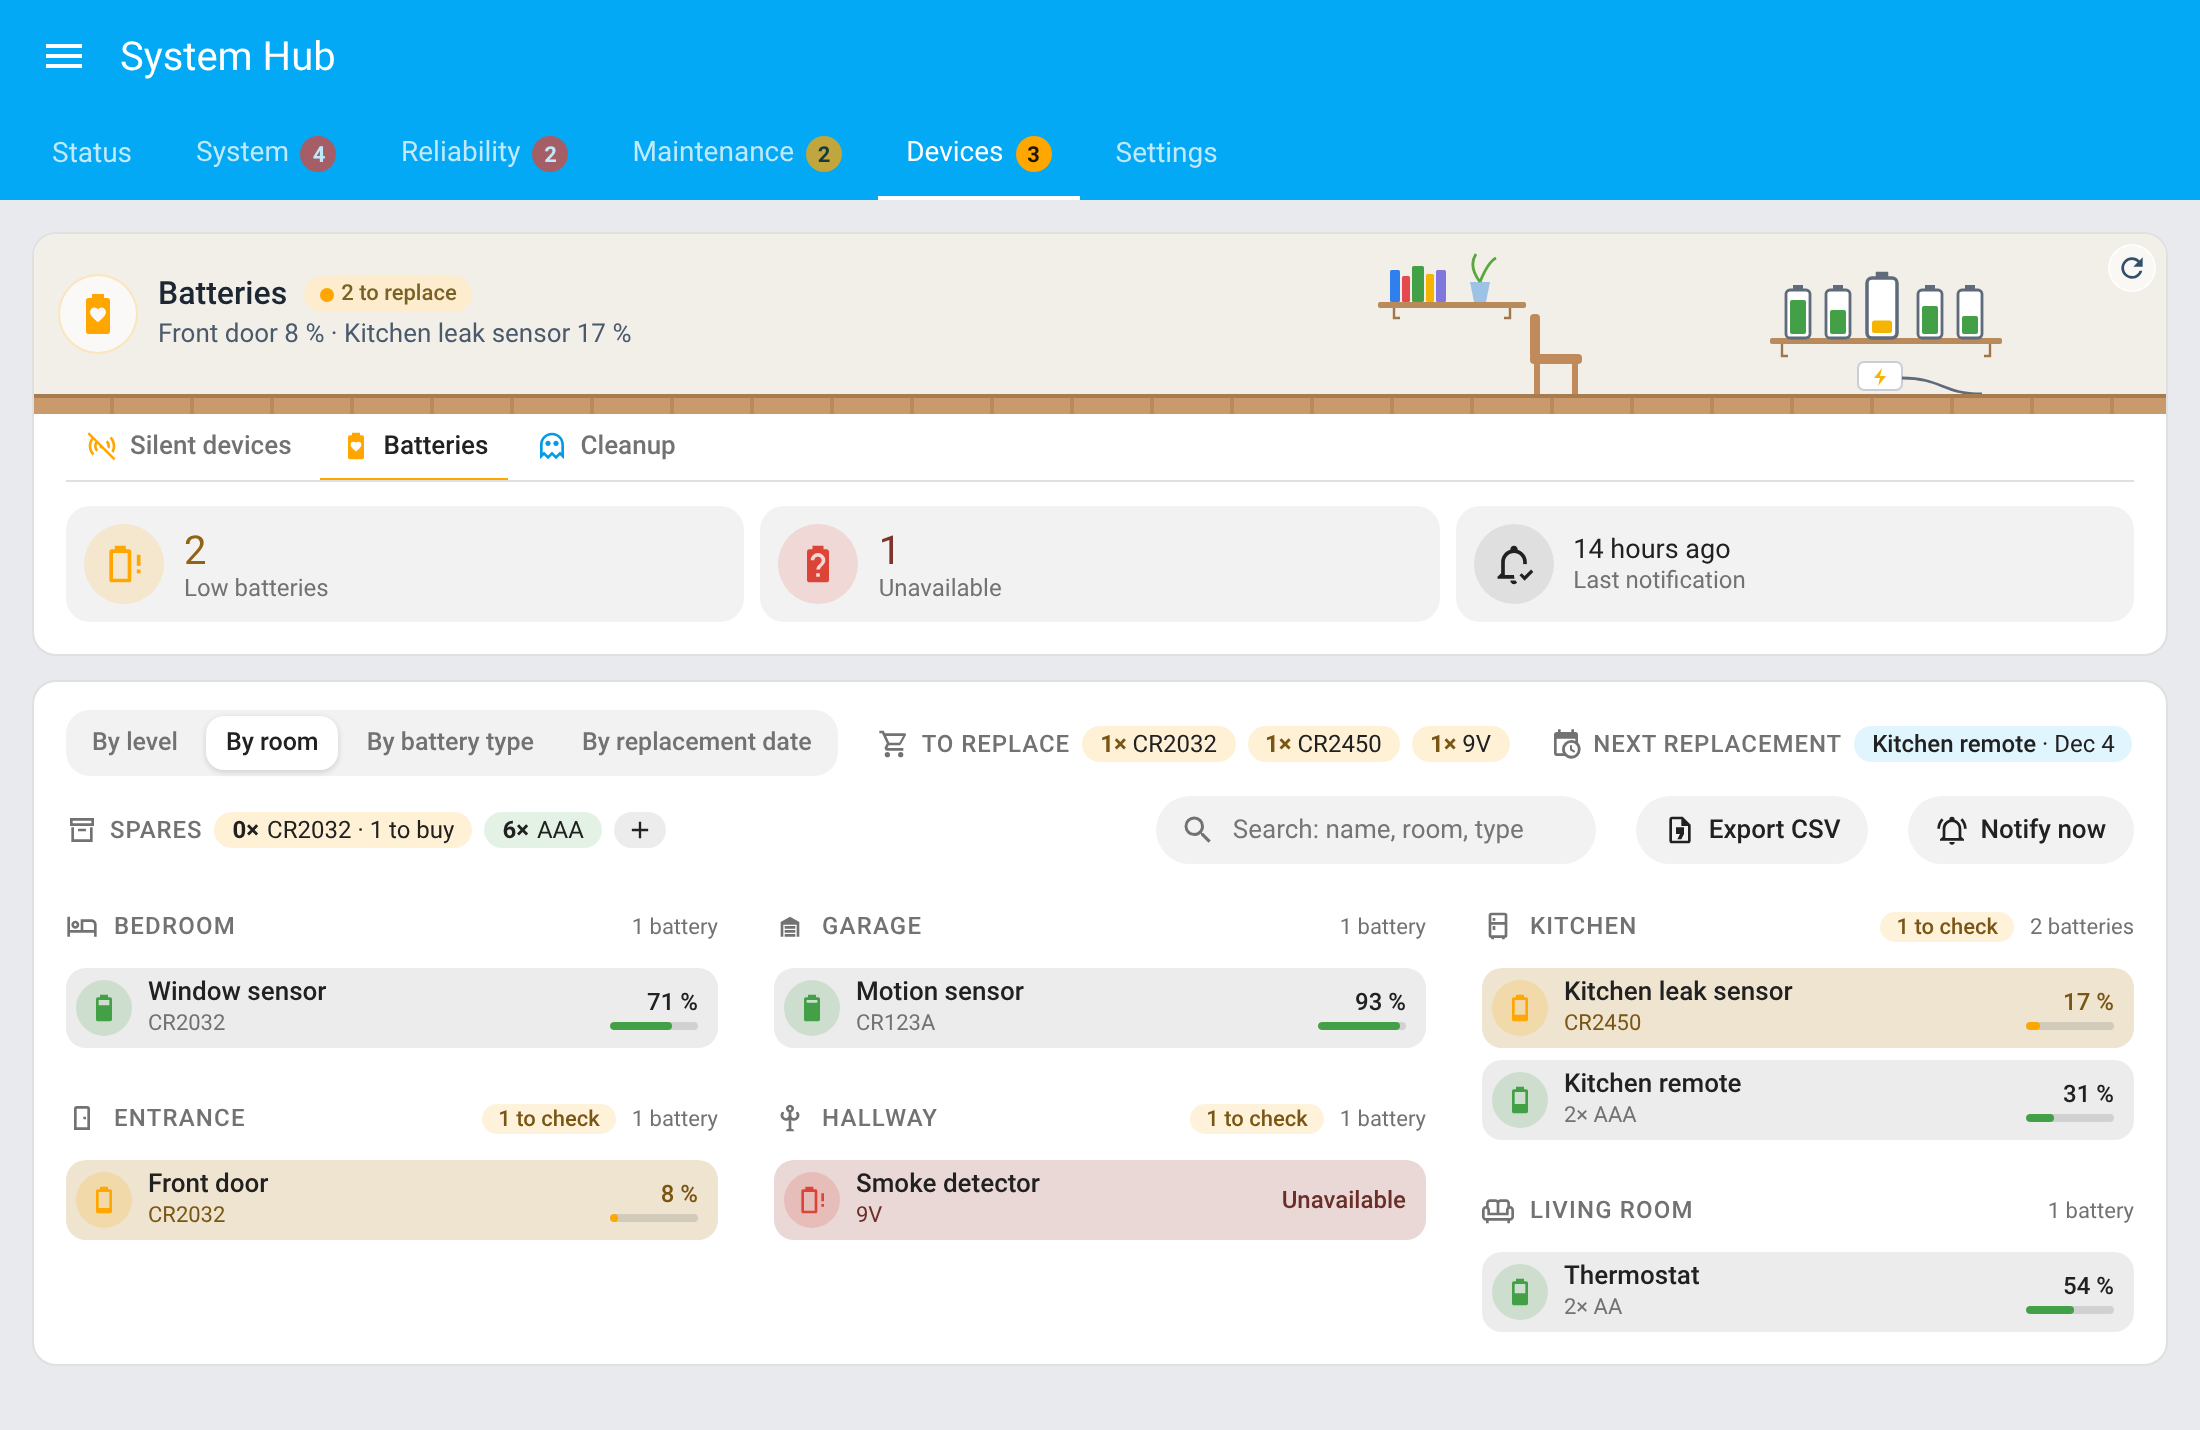 |
 |
| By battery type | 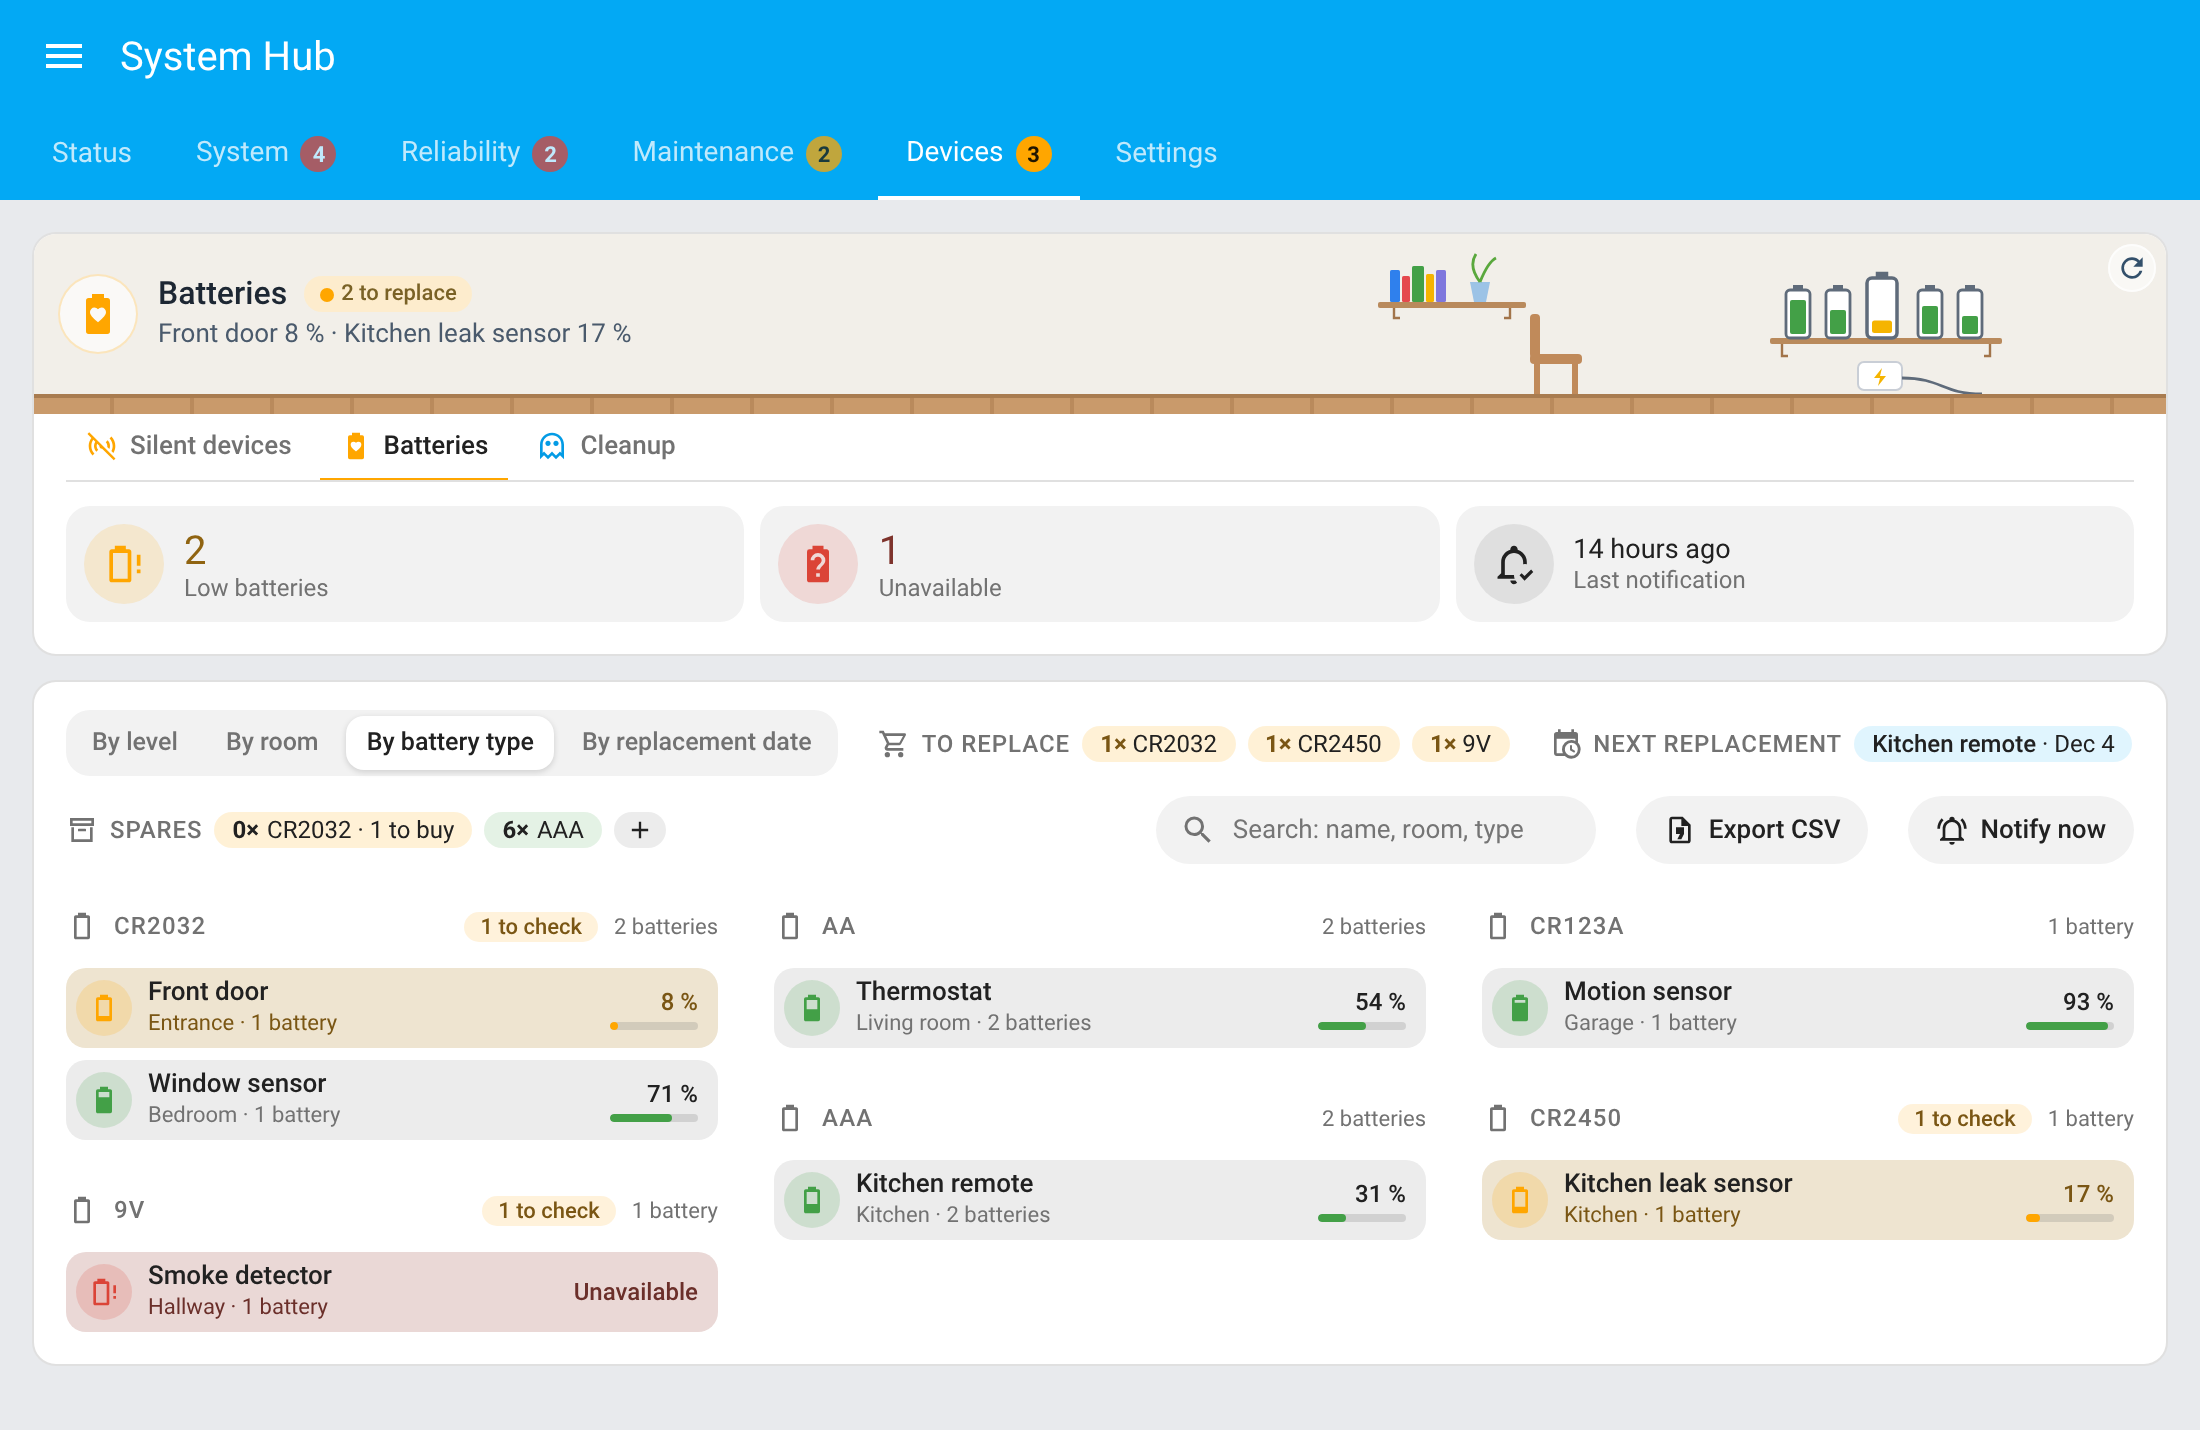 |
 |
| By replacement date | 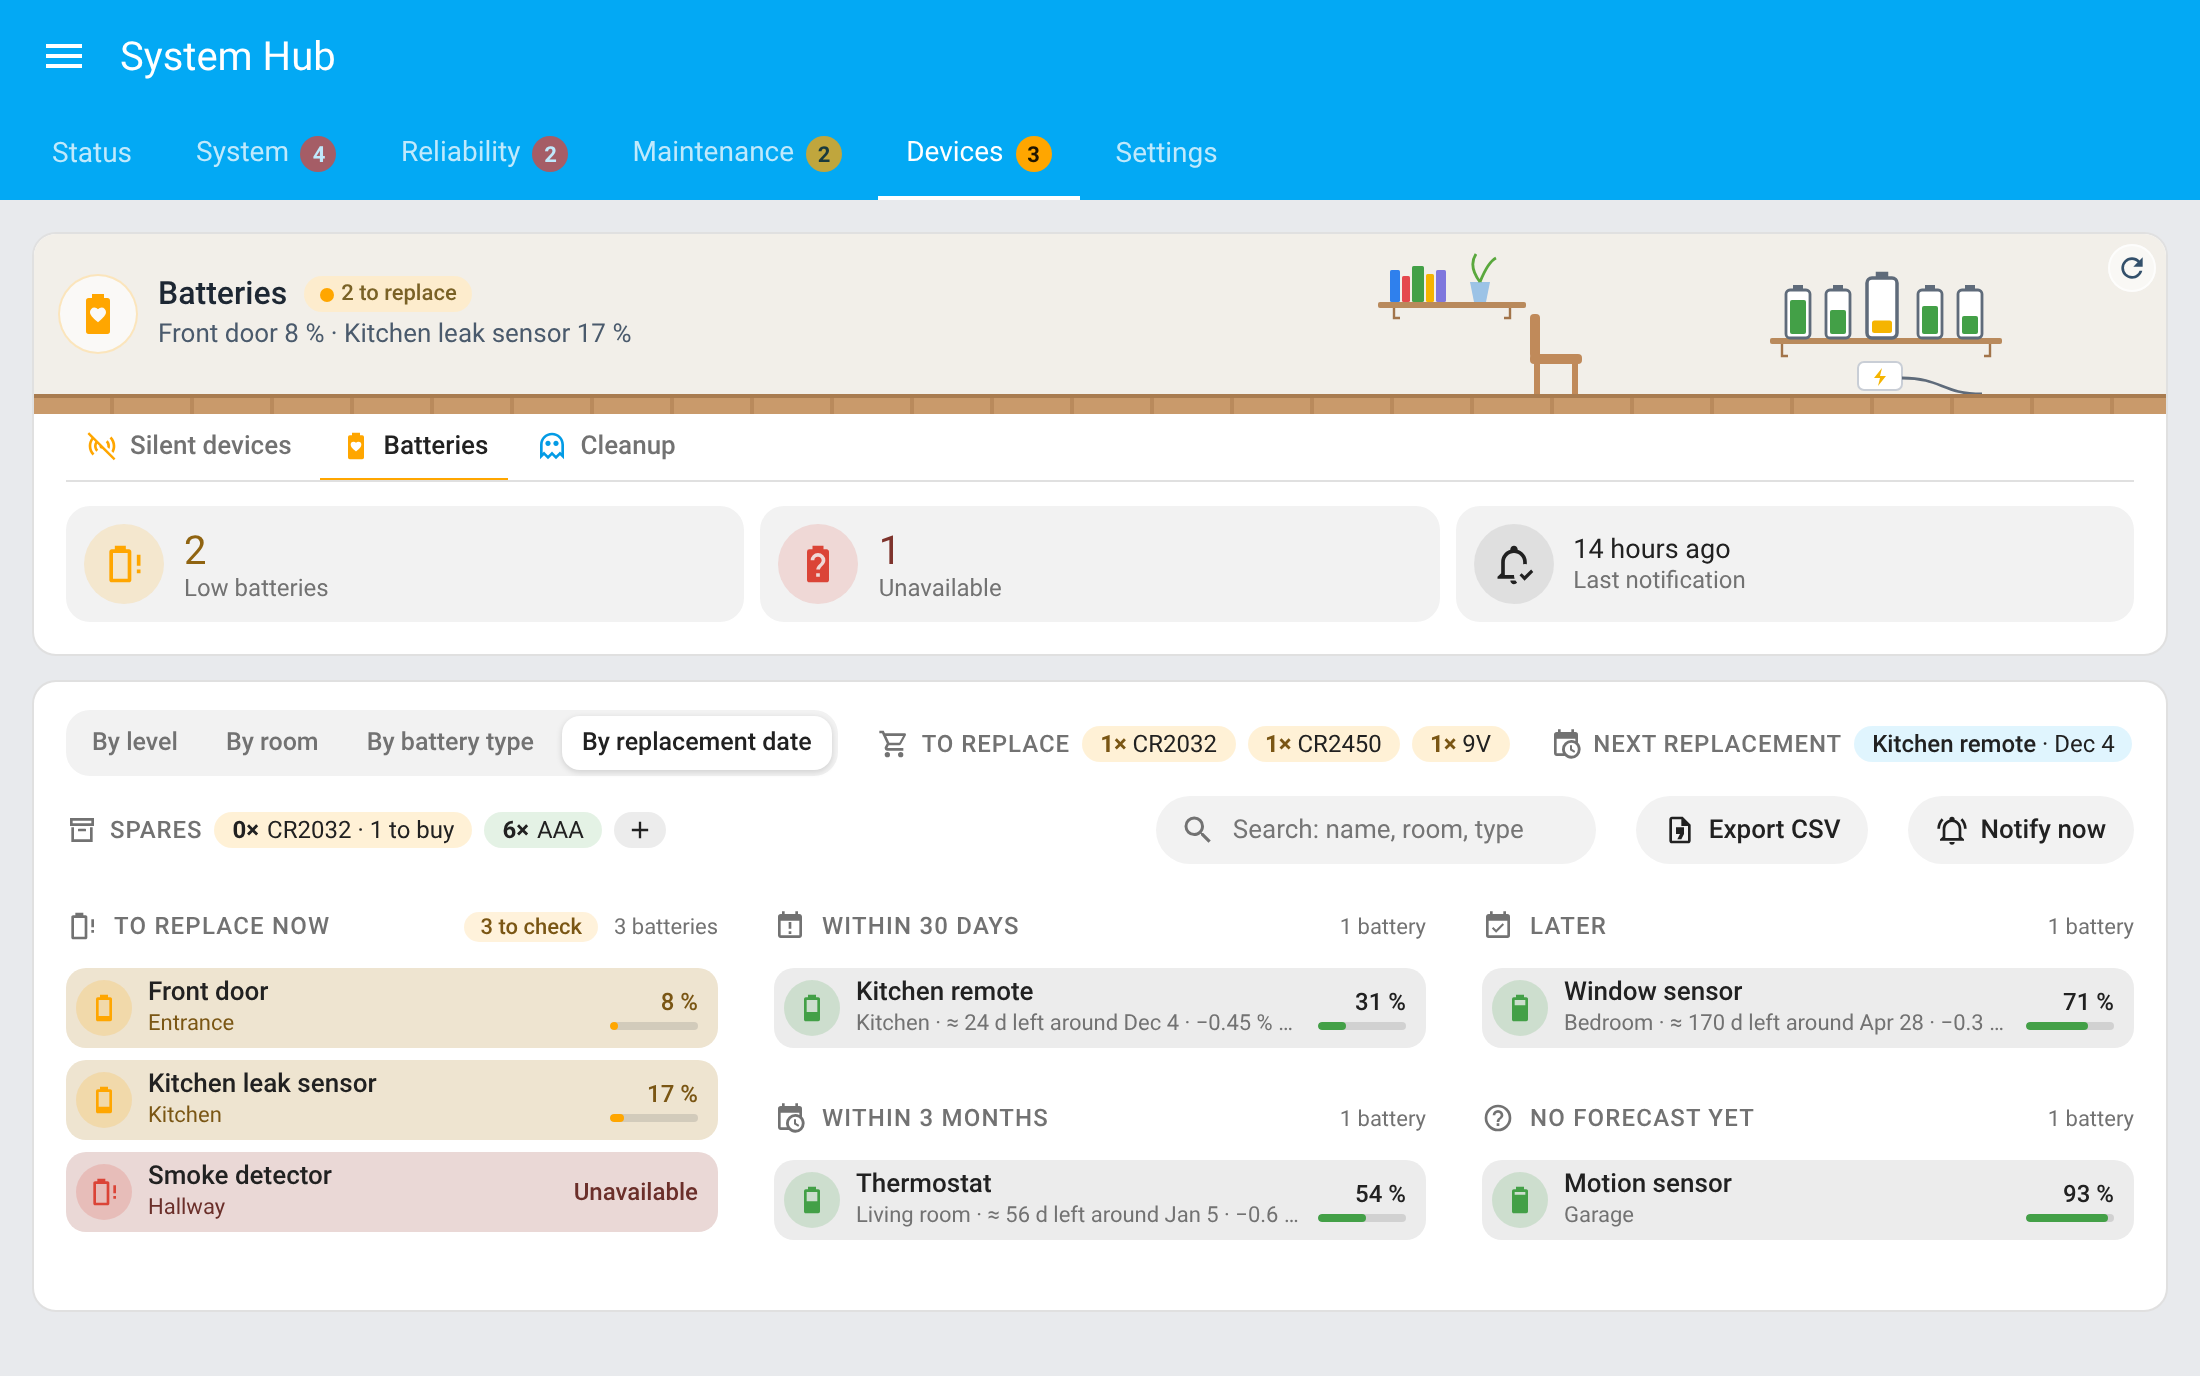 |
 |
| View changes | 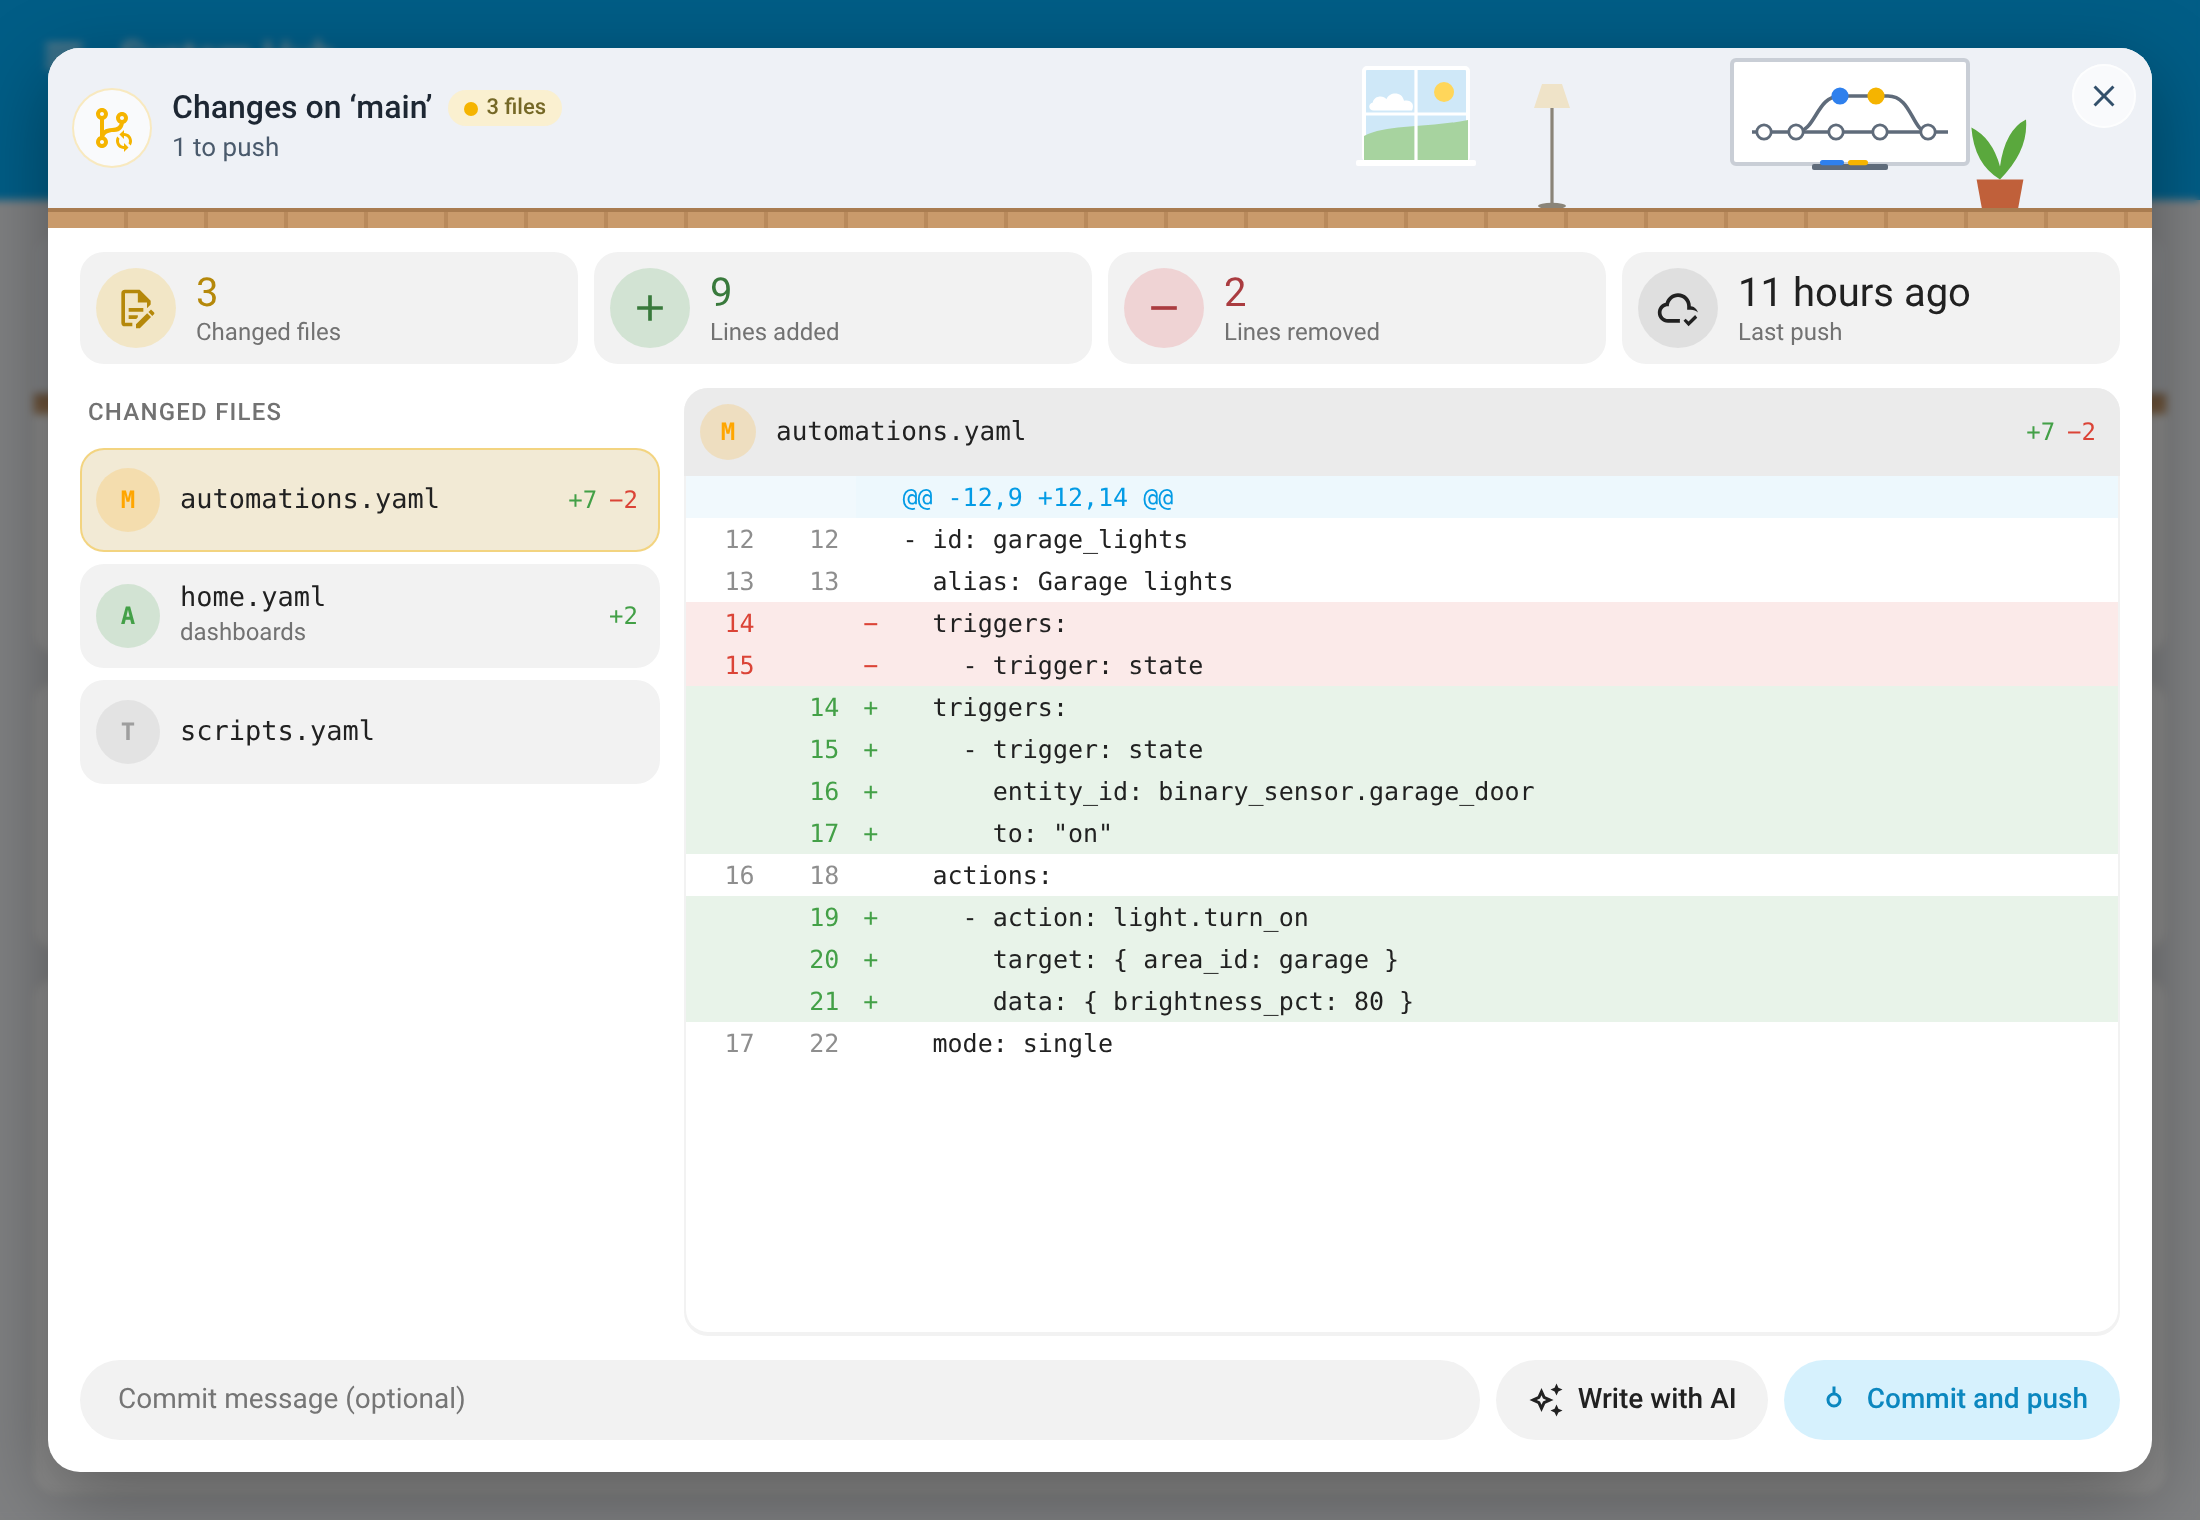 |
 |
| Orphans, Remove asked first | 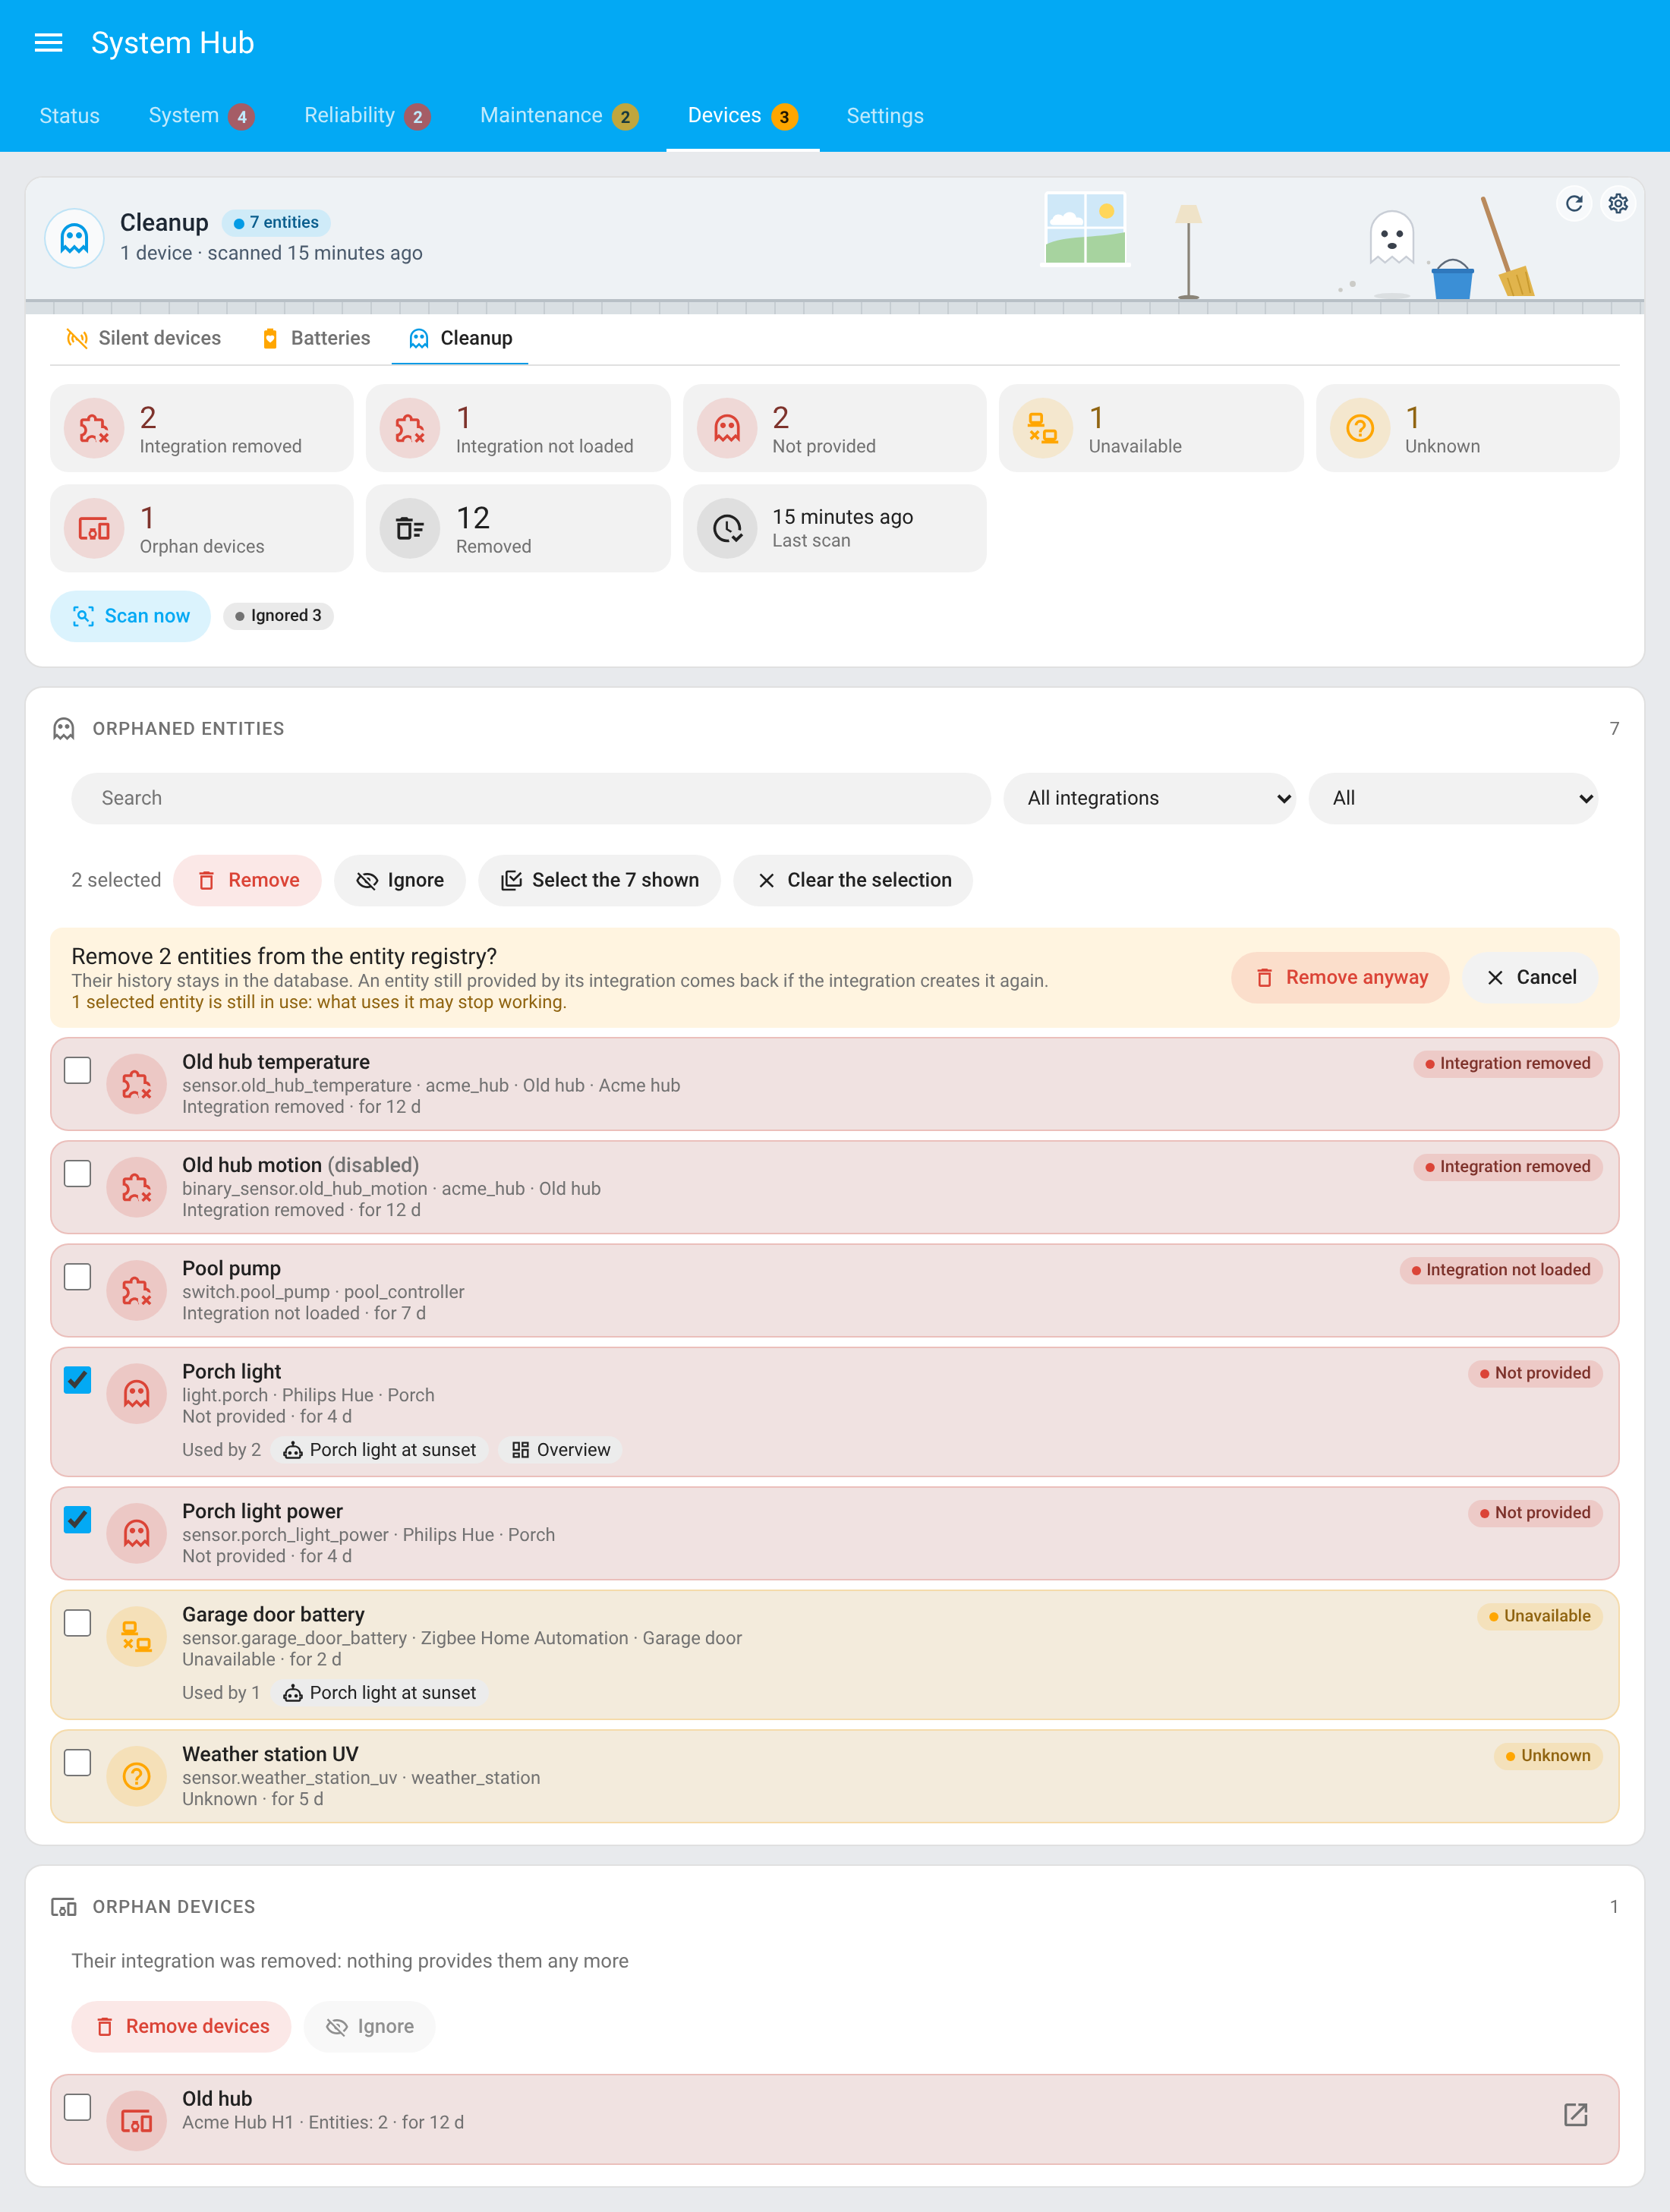 |
 |
On a phone:
| Light | Dark |
|---|---|
 |
 |
Lovelace cards
System Hub has two cards, custom:system-hub-card and custom:system-hub-mini-card: module: picks what they show, and the options of each module's card stay the same. There is nothing to install: they are added to Settings → Dashboards → Resources by themselves (/system_hub_static/cards/<file>.js, with the version in its URL so an update is fetched again), and removed with the integration. With the dashboard resources in YAML mode, they are loaded on every page instead. In the visual editor, pick the module first, then its options.
module: |
system-hub-card |
system-hub-mini-card |
Formerly |
|---|---|---|---|
status (default) |
The Status tab at a glance | On one line | — |
system |
System Monitor | ✓ | system-monitor-card, ha-system-monitor-card |
watchdog |
Sentinel | ✓ | integration-watchdog-card, ha-integration-watchdog |
marketplace |
Updates | — | marketplace-refresh-card, ha-marketplace-refresh |
batteries |
Batteries | ✓ | battery-monitor-card, ha-battery-monitor |
git_sync |
Versioning | ✓ | git-sync-card, ha-git-sync |
automations |
Automations | ✓ | automation-monitor-card, ha-automation-monitor-card |
orphans |
Cleanup | ✓ | orphan-entities-card, ha-orphan-entities |
Illustrated header: every module's card (and mini card) opens on the same 90 px header as the Status cards, with a small animated scene of its own drawn like the Status one: the main piece in the colour of the card's status (green, amber, red, grey) — the shield (Watchdog), the battery (Batteries), the store (Marketplace), the gauge (System Monitor), the branch head (Git Sync), the puzzle (Orphans), the robot (Automations) — with what it watches around it on dashed links, over the concrete floor, and the header's buttons as small frosted buttons in its top right corner. It turns to night with a dark Home Assistant theme; illustration_theme: day | night forces it, and illustration: false keeps the classic header. Both options are in each card's visual editor.
Cards only: the cards are files of the integration, served by it, so System Hub must be added in Settings → Devices & services for a dashboard to load them; downloading it from the Marketplace is not enough, and removing the integration removes the cards from the dashboard resources. To use only the cards, add System Hub with every module turned off: nothing is monitored, no entity is created, and the cards that read other integrations (the System Monitor cards, which read the core System Monitor integration) work as before. The System Hub sidebar item can be hidden for your user like any other one: long press the sidebar's title, or Profile → Change the order and hide items from the sidebar.
From 1.x: the card types before 2.0 (custom:system-hub-card (module: batteries), custom:system-hub-mini-card (module: watchdog)…) no longer exist. At every start, System Hub moves the cards of the dashboards edited from the UI to the new type and its module, wherever they are (a view, a section, a stack, a conditional card, a popup), their options kept; each dashboard is saved first in .storage/system_hub.dashboards_backup. A dashboard written in YAML is not rewritten: a repair in Settings → Repairs lists its cards to change, and goes away once none is left.
Status cards
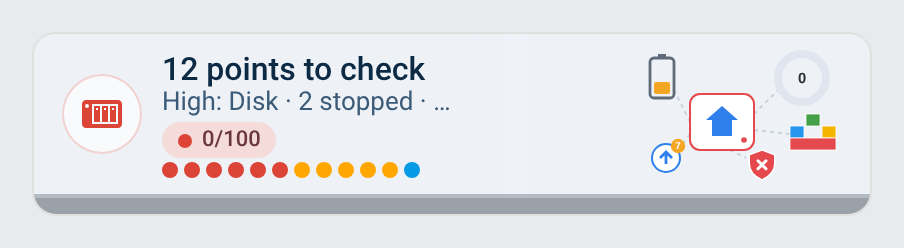
module: status (the default) shows the Status tab of the panel: an illustrated header with the points to check and the score, then each area by group with its level and details; a click on an area opens its tab in the panel, a click on the header opens the Status tab. The mini card shows the same header with the points to check, the details of the first areas to look at and a dot per area.
The header (90 px, on both cards) draws a home server's dashboard: the server icon in the colour of the status (green when all is good, amber with points to watch, red with critical ones), the host, the health score ring, the containers, the batteries, the updates and the watchdog, each in the colour of its own area, animated (motion is stopped when the system asks for reduced motion), over a concrete floor. It turns to night when Home Assistant uses a dark theme (a light theme keeps the day picture after sunset); illustration_theme: day | night forces it, and illustration: false brings back the classic header with the status emblem. They read the status as the panel does (its own code, without showing it), every 30 seconds, so the cards, the panel and the sidebar icon always agree. Administrators only, as the panel.
type: custom:system-hub-card
groups: [system, reliability]   # optional: only these groups (system, reliability, maintenance, devices)
hide_ok: true                     # optional: hide the areas that are fine
illustration: false               # optional: the classic header instead of the illustrated one (default: true)
illustration_theme: night         # optional: auto (default: follows the Home Assistant theme), day or night
The mini card takes groups, illustration and illustration_theme (both): it already shows only the areas to look at, so show_title, show_subtitle and hide_ok apply to the full card.
system-hub-card |
system-hub-mini-card |
|---|---|
 |
 |
System Monitor cards
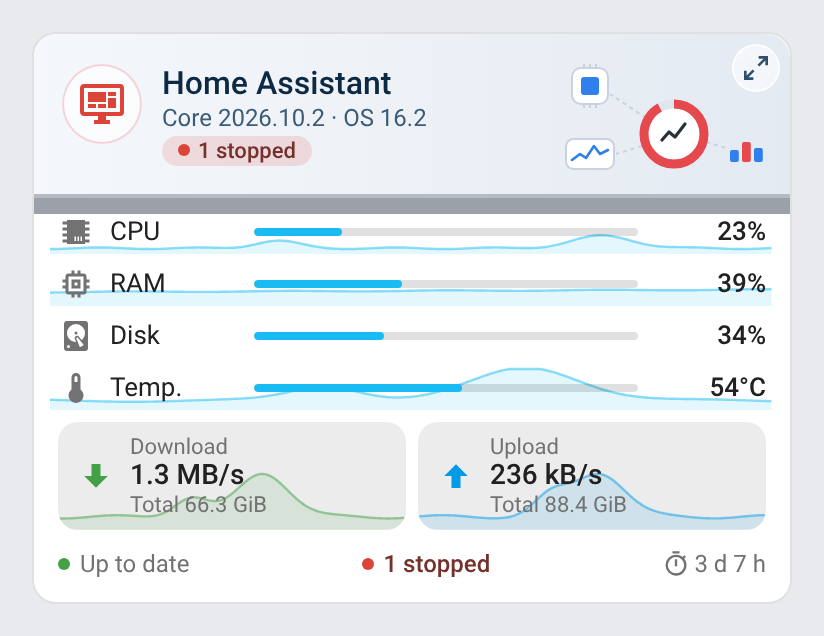
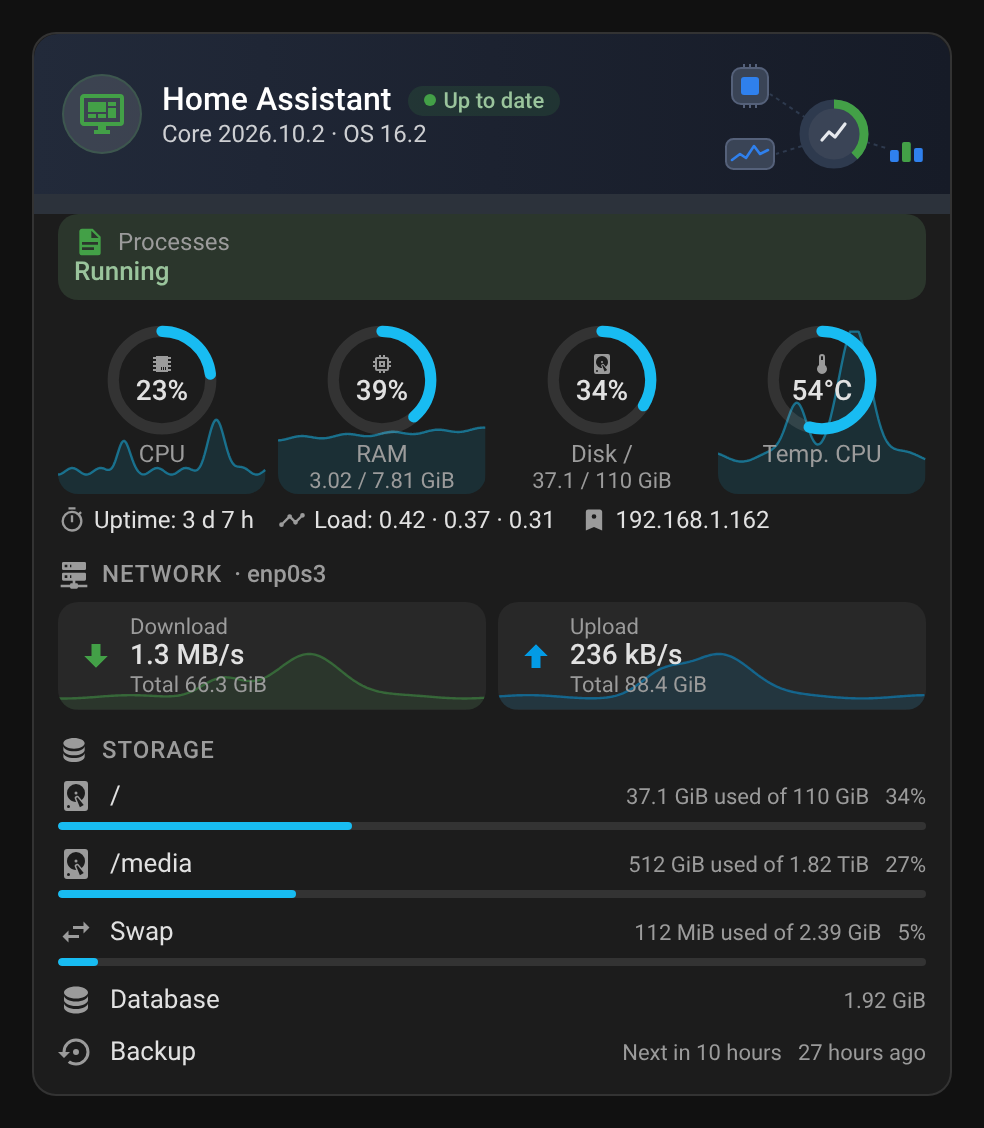
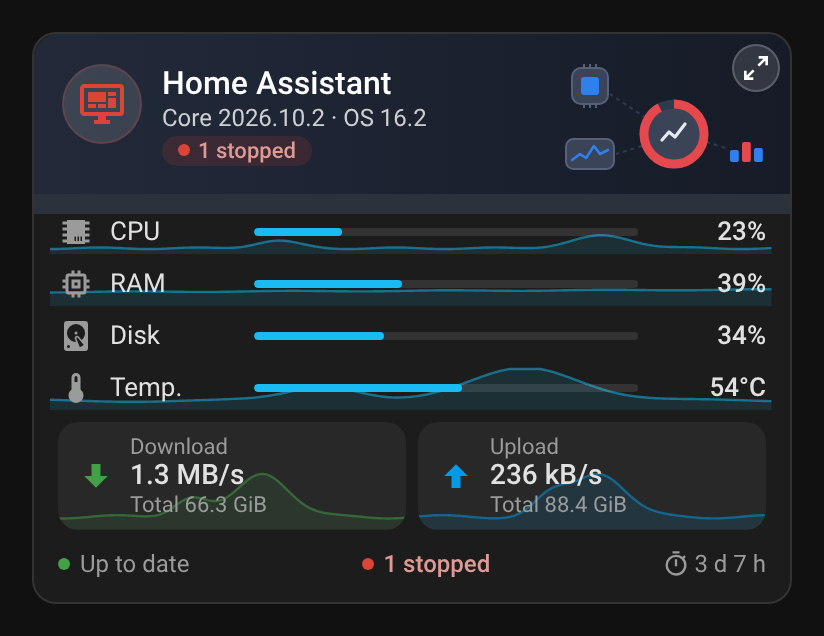
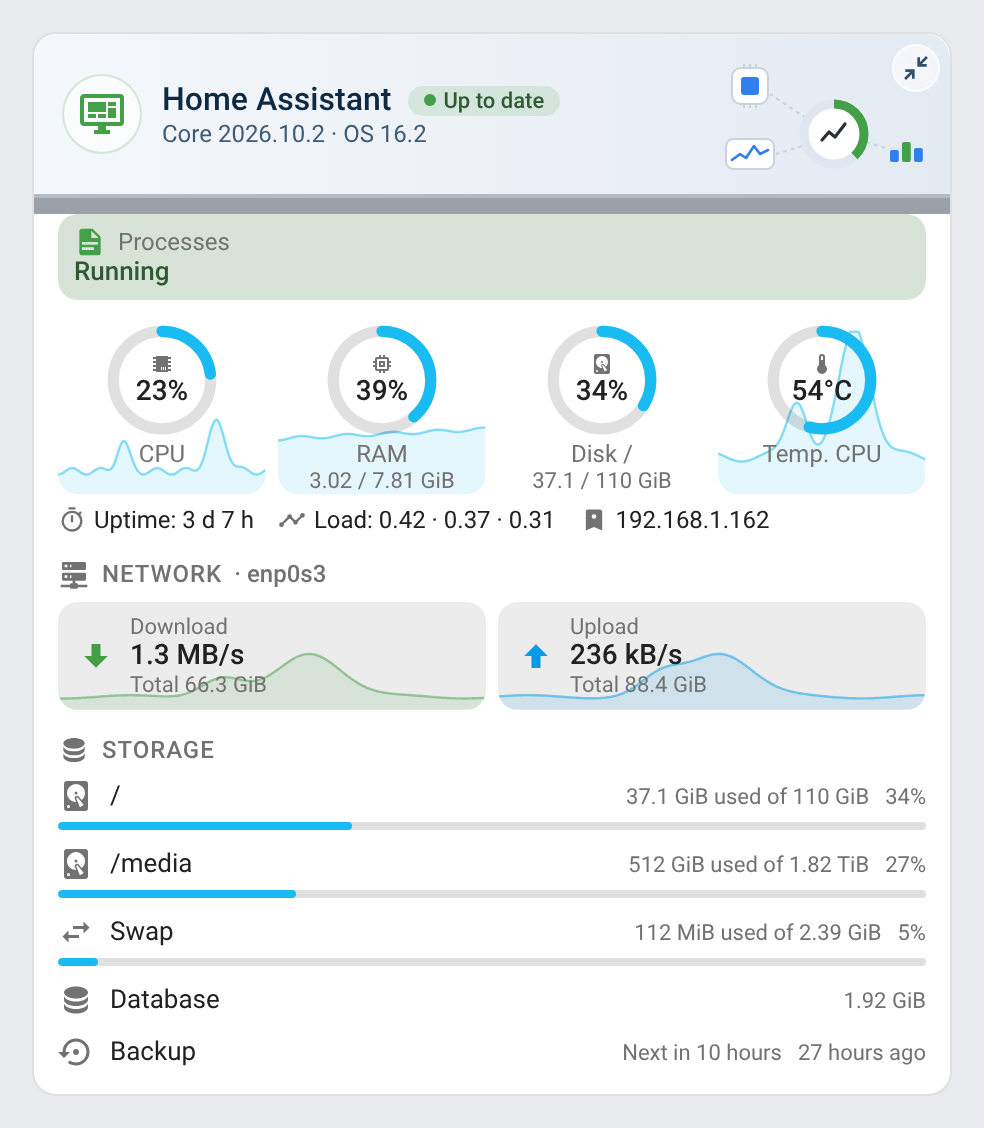
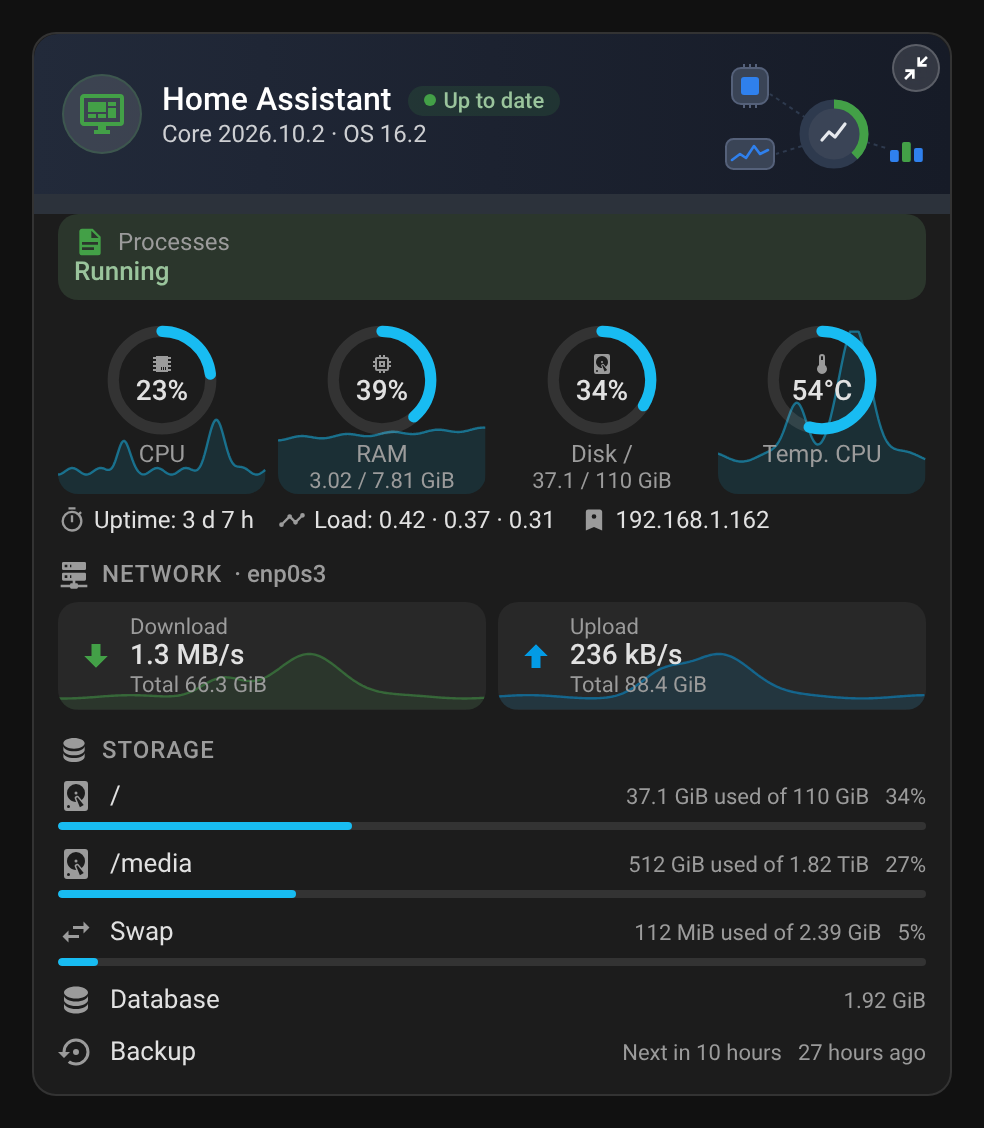
System Hub ships two Lovelace cards to monitor the machine running Home Assistant itself — CPU, RAM, disk, temperature, network, storage, backups and processes at a glance: the full System Monitor Card and the compact System Monitor Mini Card (formerly ha-system-monitor-card).
There is nothing to install: System Hub adds the cards to Settings → Dashboards → Resources by itself (with the version in its URL so that an update is fetched again), and removes them when the integration is removed. With the dashboard resources in YAML mode, the cards are loaded on every page instead. They are custom:system-hub-card and custom:system-hub-mini-card with module: system; if you used the separate card before, remove its resource (or uninstall it): System Hub moves its cards to the new type at its next start (see Lovelace cards).
The cards are built on top of the core System Monitor integration: entities are discovered automatically, you don't have to pick them one by one, and it works whatever the language of your installation.
| System Monitor Card | System Monitor Mini Card |
|---|---|
|
 |
Features
- Two cards: a full System Monitor Card and a compact System Monitor Mini Card
- Zoom on the mini card: a button at the top right switches it to the full System Monitor card (same options) and back; a click anywhere outside the card brings it back too
- Automatic discovery of the System Monitor entities through the entity registry (any language)
- CPU, RAM, disk and CPU temperature gauges, uptime, load average and IP address
- Home Assistant Core and OS versions, with an orange badge when an update is available
- Network download / upload rates and totals, per interface (virtual interfaces such as
docker0orhassioare hidden) - 24 h history: a discreet curve of the last 24 hours behind the CPU and RAM gauges (bars on the mini card) and each download / upload rate, on the full card and the mini card, from the recorder's statistics on a real time axis, with a break where the recorder has no data (refreshed every 5 minutes;
show_history: falseturns it off) - Storage: every monitored mount point and the swap, with used space, and the size of the Home Assistant database
- Backups: when the last automatic backup was made and when the next one is due, orange / red when it gets old or the last attempt failed (the mini card shows it only then), from Home Assistant's own backup sensors
- Monitored processes, green when running and red when stopped: hidden while they all run (their status tile shows the list on a click), always shown while one is stopped, with their overall status in the status row
- Colors turn orange / red when a threshold is crossed (CPU, RAM, disk, temperature, swap), with thresholds you can change
- Click any value to open its Home Assistant history (more-info dialog)
- Visual editor in the dashboard UI for every card (no YAML needed)
- Light and dark mode, English, French, German, Spanish, Serbian (Cyrillic and Latin), Italian, Dutch, European Portuguese, Polish, Romanian, Danish, Swedish, Bulgarian, Russian, Ukrainian, Hungarian, Slovak, Czech, Slovenian, Latvian and Greek
Supported integrations
| Integration | What the cards show |
|---|---|
| System Monitor (built in) | CPU, RAM, disk and temperature gauges, uptime, load, IP address, network, storage and swap, monitored processes |
| File Size (built in, optional) | Size of the Home Assistant database |
Home Assistant updates (built in, update.home_assistant_*) |
Core and OS versions, with a badge when an update is available |
The Marketplace updates and the unavailable integrations are in System Hub's sidebar panel (Marketplace and Watchdog tabs).
Prerequisites
Home Assistant 2024.8 or later, and:
The System Monitor integration must be added (Settings → Devices & services → Add integration → System Monitor).
Most of its sensors are disabled by default: open the System Monitor device and enable the ones you want to see on the card, for example:
| Card section | Sensors to enable |
|---|---|
| System | Processor use, Memory usage (or Memory use + Memory free), Disk usage / Disk use + Disk free, Processor temperature, Last boot (called Uptime in recent versions), Load (1m/5m/15m), IPv4 address |
| Network | Network throughput in / out, Network in / out (totals) |
| Storage | Disk use + Disk free for each mount point, Swap use + Swap free. For the database size, the File Size integration on /config/home-assistant_v2.db (see below) |
| Processes | Process binary sensors (configured in the integration options) |
Sections and gauges without any enabled sensor are simply not displayed.
Configuration
Visual editor
Edit a dashboard, click Add card and search for System Monitor Card or System Monitor Mini Card. Set an optional title, choose the sections to display, the network interface and the language. The preview updates live, and options left at their default are kept out of the generated YAML.
Minimal
type: custom:system-hub-card
module: system
type: custom:system-hub-mini-card
module: system
Full options
type: custom:system-hub-card
module: system
title: My Home Assistant
show_system: true
show_network: true
show_history: true
show_storage: true
show_backups: true
show_processes: true
interface: eth0
language: fr
cpu_warning: 70
cpu_critical: 90
ram_warning: 80
ram_critical: 95
disk_warning: 80
disk_critical: 90
temp_warning: 75
temp_critical: 90
swap_warning: 50
swap_critical: 80
backup_warning: 2
backup_critical: 7
entities:
  processor_temperature: sensor.cpu_temperature
  disks:
    /mnt/hdd1: sensor.nas_volume_1_usage
    /mnt/hdd2:
      use: sensor.nas_volume_2_used
      free: sensor.nas_volume_2_free
  interfaces:
    lan:
      in: sensor.router_download
      out: sensor.router_upload
type: custom:system-hub-mini-card
module: system
title: My Home Assistant
show_storage: true
show_network: true
show_history: true
zoom: true
interface: eth0
language: fr
cpu_warning: 70
cpu_critical: 90
Options reference
| Option | Card | Default | Description |
|---|---|---|---|
title |
all | Home Assistant |
Card title |
show_title |
all | true |
Show the title in the header (e.g. false under a section heading of your own) |
illustration |
all | true |
The illustrated header with the gauge (see Lovelace cards); false for the classic header |
illustration_theme |
all | auto |
day or night picture; auto follows the Home Assistant theme |
show_subtitle |
all | true |
Show the subtitle under the title |
show_system |
full, mini | true |
CPU, RAM, disk and temperature gauges, uptime, load, IP address |
show_disk |
full, mini | true |
The disk gauge of the System section (root file system, else the first mount point); false leaves the disk to the Storage section |
show_network |
full, mini | true |
Network download / upload |
show_history |
full, mini | true |
24 h curve behind the CPU, RAM and CPU temperature gauges (bars on the mini card; the temperature on a 0–100 °C scale, RAM from its memory_use_percent sensor, on a 0–100 % scale) and each download / upload rate, from the recorder's 5-minute statistics (one query for all of them) (on the mini card, the rates then show as tiles above the footer instead of in it) |
show_storage |
full, mini | true |
Full card: mount points, swap and database size. Mini card: disk bar |
show_backups |
full, mini | true |
Full card: the last and next automatic backups at the end of Storage. Mini card: an orange / red item when the last backup is too old or failed |
show_processes |
full, mini | true |
Monitored processes and their status tile (mini card: a stopped process shows as an item) |
show_actions |
full, mini | false |
Administrators only: Reload configuration, Restart Home Assistant and, with Home Assistant OS or Supervised, Reboot the host (hassio.host_reboot) at the bottom of the full card (on the mini card, of its zoomed view), each confirmed in the card first; the restart checks the configuration and is refused while it is invalid, as in the panel's System tab |
zoom |
mini | true |
Zoom button at the top right: shows the full card, and back to the compact view. The full card's options (show_system, show_disk, show_processes, the swap thresholds) are set on the mini card too, in YAML or in its visual editor, and apply to that view |
interface |
full, mini | All physical interfaces | Network interface to display (e.g. eth0, enp0s3) |
cpu_warning / cpu_critical |
full, mini | 70 / 90 |
CPU usage (%) from which the gauge turns orange / red |
ram_warning / ram_critical |
full, mini | 80 / 95 |
RAM usage (%) from which the gauge turns orange / red |
disk_warning / disk_critical |
full, mini | 80 / 90 |
Disk usage (%) from which the gauges and storage bars turn orange / red |
temp_warning / temp_critical |
full, mini | 75 / 90 |
CPU temperature (°C, whatever the unit of the sensor) from which the gauge turns orange / red |
swap_warning / swap_critical |
full, mini | 50 / 80 |
Swap usage (%) from which the swap bar turns orange / red |
backup_warning / backup_critical |
full, mini | 2 / 7 |
Days since the last successful automatic backup from which the backup turns orange / red (red also when the last attempt failed, or there was never one) |
entities |
full, mini | — | Sensors of your choice, instead of or next to System Monitor's (see below) |
language |
all | Auto | Force language: en, fr, de, es, sr, sr-Latn, it, nl, pt, pl, ro, da, sv, bg, ru, uk, hu, sk, cs, sl, lv or el (auto-detects from HA settings) |
Sensors of your choice
The cards find the System Monitor sensors by themselves. entities sets others, for a value System Monitor does not give (the disks of a NAS, a temperature from another integration) or a sensor of your own. A sensor set here replaces the one found for the same value, disk or interface; the others are added. Without System Monitor at all, the cards show the sensors set here.
| Key | Value |
|---|---|
processor_use, processor_temperature, memory_use_percent, memory_use, memory_free, swap_use_percent, swap_use, swap_free, load_1m, load_5m, load_15m, last_boot |
A sensor id. The CPU, temperature, RAM, swap and last boot sensors can be picked in the visual editor too, under Sensors of your choice |
disks |
One entry per disk, by the name to show (a mount point, HDD 1…): a usage sensor in %, or use, free and use_percent sensors |
interfaces |
One entry per network interface, by its name: in and out rate sensors, and ipv4 for its address |
Screenshots
| Light | Dark |
|---|---|
|
 |
|
 |
 |
 |
How it works
The cards read the entity registry of Home Assistant and keep the entities of the systemmonitor platform. Each sensor is recognized by its translation key (processor_use, memory_use_percent, disk_free, throughput_network_in…), so entity ids translated in another language (for example sensor.system_monitor_utilisation_du_processeur) and renamed entities are supported. Mount points, interfaces and process names are read from the end of the sensor name, after the device name and the label: a mount point starts at its first / (so names with spaces, /mnt/My Passport, are kept whole), an interface is the last word, a process name is what follows Process (or the label the other processes share). This works for a sensor alone of its kind too (Disk usage /config). A sensor renamed in its entity settings (WAN up, Root free) no longer says its argument: it is read from its entity id instead, which Home Assistant made from the original name (sensor.system_monitor_network_throughput_out_eth0 → eth0, sensor.system_monitor_disk_free → /). When the registry is not available, English entity ids (sensor.system_monitor_processor_use…) are used as a fallback.
The Core and OS versions come from the update.home_assistant_core_* and update.home_assistant_operating_system_* entities when they exist, otherwise from the running Home Assistant version.
Status row
Under the header, a tile gives the overall status of the Processes section (running or the number stopped), green when all is well, red otherwise. The Core / OS update badge turns grey "Unknown" when the update entity is unavailable. Click the tile to show the section unfolded; a click elsewhere folds or hides it again. The Home Assistant Core / OS update stays next to the logo. The tile is left out when the section is hidden or has no process.
Mini card
The compact card shows CPU, RAM, disk and temperature bars, then the Core / OS status, the network rates and the uptime. While a monitored process is stopped, its header icon turns red and its footer shows a red "N stopped" item: a click on it shows the full card with the processes list unfolded (with zoom: false, it opens the first stopped process). At the far right of the header, a small round button (mdi:arrow-expand) shows the full card in its place, with the same options, exactly as the System Monitor Card shows it, and turns into mdi:arrow-collapse to bring the compact view back; a click anywhere outside the card does too, but not a click in a dialog opened from it (more-info). zoom: false removes the button.
Processes
The processes section is hidden while every monitored process runs: the Processes tile of the status row says "Running", and a click on it shows the list, which hides again on a click on its title or elsewhere. As soon as a process is stopped, the section shows up by itself and stays, whatever you click, until every process runs again. Its title shows the number of processes, and the number stopped in red.
Backups
The Storage section also shows Home Assistant's automatic backups, from the sensors of the built-in Backup integration (Home Assistant 2025.2 or later, nothing to set up): Last successful automatic backup, Last attempted automatic backup, Next scheduled automatic backup and Backup manager state. The row shows when the last one was made and when the next one is due; it turns orange after backup_warning days, red after backup_critical days, when the last attempt failed or when there was never one, and says Backing up… while one runs. Click it for the sensor's history. Only automatic backups count (set them up in Settings → System → Backups).
Database size
The Storage section ends with the size of the Home Assistant database (the default SQLite one, home-assistant_v2.db), read from the File Size integration. To get it:
- Allow Home Assistant to read the file, in
configuration.yaml, then restart:homeassistant: allowlist_external_dirs: - /config - Settings → Devices & services → Add integration → File Size, with the path
/config/home-assistant_v2.db.
The card finds its size sensor by itself (platform filesize, a file named home-assistant_v2.db); a click on the row opens its history. Without it, the row is not shown. An external database (MariaDB, PostgreSQL) is not a file and isn't supported here; the Database module's tab and its size sensor follow it.
Thresholds
Gauges and bars turn orange, then red, when a value reaches these thresholds (the defaults; each can be changed with the *_warning / *_critical options, in YAML or in the visual editor):
| Value | Orange | Red |
|---|---|---|
| CPU usage | 70 % | 90 % |
| RAM usage | 80 % | 95 % |
| Disk usage | 80 % | 90 % |
| CPU temperature | 75 °C (167 °F) | 90 °C (194 °F) |
| Swap usage | 50 % | 80 % |
The CPU temperature is shown in the unit of its sensor, which follows the unit system of Home Assistant (°C, or °F with US customary units) or the display unit chosen in the sensor's settings; the thresholds are in °C and apply to the same temperature in any unit.
Translations
The cards auto-detect the language from your Home Assistant settings. Currently supported:
| Language | Code |
|---|---|
| English | en |
| Français | fr |
| Deutsch | de |
| Español | es |
| Српски | sr |
| Srpski (latinica) | sr-Latn |
| Italiano | it |
| Nederlands | nl |
| Português (Portugal) | pt |
| Polski | pl |
| Română | ro |
| Dansk | da |
| Svenska | sv |
| Български | bg |
| Русский | ru |
| Українська | uk |
| Magyar | hu |
| Slovenčina | sk |
| Čeština | cs |
| Slovenščina | sl |
| Latviešu | lv |
| Ελληνικά | el |
Regional variants fall back to the base language (it-IT → it, nl-BE → nl, pl-PL → pl); Brazilian Portuguese (pt-BR) uses the European Portuguese translation. In the languages whose plurals have more than two forms (Serbian, Polish, Romanian, Russian, Ukrainian, Slovak, Czech, Slovenian and Latvian), counts other than 1 read "label: {n}" (Nedostupne: 2).
Containers
Home Assistant's own Docker containers, read from the Supervisor: Home Assistant Core (homeassistant), the Supervisor (hassio_supervisor), its plugins (hassio_audio, hassio_cli, hassio_dns, hassio_multicast, hassio_observer) and every add-on (app_<slug>, addon_<slug> before Supervisor 2026.07.4). Monitoring only: the module never starts, stops or restarts anything. The panel's Containers & process tab lists them as Docker does, with their image, and below them the processes System Monitor watches.
| Option | Default | Description |
|---|---|---|
| Refresh interval | 60 s | Seconds between two reads of the Supervisor, from 10 to 3600. The first read is done once Home Assistant has started |
| Notify | on | Notify when a container that should run stops, and when it is back |
| Notify actions | none | Also send each notification with these actions (notify.mobile_app_phone…). A persistent notification is always created |
| Processes that may be stopped | none | Process binary sensors of System Monitor that may be stopped: stopped, they show in grey ("Stopped (allowed)") and are no problem on the Status tab nor on the System Monitor cards |
A container should run when it is Core, the Supervisor, one of its plugins, or an add-on set to start at boot. It is down when it should run and is stopped or in error; an add-on started by hand only is never down. Going down creates a persistent notification (one per container, replaced) and coming back dismisses it. Nothing is notified at the first read, nor while Home Assistant is starting, when the add-ons are starting too. If the Supervisor can't be read (busy, restarting), the last figures are kept and the error is shown in the attributes; the next refresh tries again.
For every container: its Docker name and image, state and since when, version, latest version and whether an update is available, CPU %, memory (used, limit, %), network (received, sent) and disk (read, written) since it started. The panel also gets their CPU and memory over the last 24 hours (one point every 5 minutes, in memory only).
Entities
| Entity | Description |
|---|---|
sensor.system_hub_containers_running_containers |
Containers running. Attributes: total, error (why the last read failed, else null), containers (every container: slug, name, kind = core / supervisor / addon, state, since, version, version_latest, update_available, boot, expected, down, cpu_percent, memory_usage, memory_limit, memory_percent, network_rx, network_tx, blk_read, blk_write; not recorded in the database) |
sensor.system_hub_containers_stopped_containers |
Containers that should run and don't. Attribute: containers (slug, name, state) |
sensor.system_hub_containers_last_update |
End of the last successful read |
Action system_hub.containers_refresh
Reads the containers now. Fails with the reason if the Supervisor could not be read. For administrators.
action: system_hub.containers_refresh
Get a notification on the phone when an add-on stays stopped:
triggers:
  - trigger: numeric_state
    entity_id: sensor.system_hub_containers_stopped_containers
    above: 0
    for: "00:10:00"
actions:
  - action: notify.mobile_app_phone
    data:
      message: >-
        Stopped: {{ state_attr('sensor.system_hub_containers_stopped_containers', 'containers')
        | map(attribute='name') | join(', ') }}
Database
The Database tab reads the recorder's database on demand (see Sidebar panel). The module also follows its size with a sensor, read every 15 minutes, so that the recorder keeps its history and long-term statistics: graph it on a dashboard, or trigger an automation on it.
Entities
| Entity | Description |
|---|---|
sensor.system_hub_database_database_size |
Size of the recorder's database, whatever its engine: the SQLite file and its write-ahead log, the MariaDB / MySQL schema (information_schema) or the PostgreSQL database (pg_database_size); in bytes, shown in MiB. Attribute: engine (sqlite, mysql for MariaDB too, postgresql) |
With MySQL 8, information_schema sizes can lag behind by up to a day (information_schema_stats_expiry); MariaDB reads them live.
Watchdog
| Option | Default | Description |
|---|---|---|
| Check interval | 5 min | Minutes between two checks, from 1 to 1440 |
| Grace period | 15 min | Minutes every entity of an integration must have been unavailable before it is reloaded. Nothing is reloaded during this time after Home Assistant has started |
| Grace period per integration | — | One line per integration, domain: minutes (zha: 30): its own grace period and delays between reloads, for an integration that takes longer (a big Zigbee network) or should be reloaded sooner. Right after Home Assistant starts, the global grace period still applies to all |
| Reloads in a row | 3 | Reloads of an integration that stays unavailable before giving up on it, from 1 to 10 |
| Ignored entries | none | Single entries never reloaded ("Title (domain)"); the other entries of their integration are still watched |
| Ignored integrations | none | Integrations never reloaded. The list offers the integrations set up; type a domain (zha, mqtt…) to add another one |
| Pause entity | none | An input_boolean, switch, binary_sensor or schedule: while it is on, nothing is reloaded (maintenance of the network, a planned outage, the night). The checks still run and list the unavailable integrations, and the Unavailable integrations sensor has paused: true; reloads start again at the first check after it turns off, the grace period counted from when each integration became unavailable |
| Notify actions | none | Also send each notification with these actions (notify.mobile_app_phone…). A persistent notification is always created |
Power cycles
A device that hangs (a router, a hub, a camera) often only comes back once its power is cut. Associate it with the smart plug that powers it, in Settings → Sentinel ⚙ → Add a power cycle:
| Field | Default | Description |
|---|---|---|
| Device | — | The device to restart. All its enabled entities (the plug left out) must be unavailable |
| Smart plug | — | The switch that powers it. It can't be an entity of the device itself |
| Unavailable for | 10 min | Minutes all the device's entities must have been unavailable before its plug is switched off, from 1 to 1440 |
| Off for | 10 s | Seconds the plug stays off before being switched on again, from 1 to 300 |
The plug is only switched off when it is on: a plug you switched off on purpose, or that is unavailable itself, is left alone. Power cycles follow the reload rules: none while Home Assistant starts or during the grace period after it has started, none while the pause entity is on, at most Reloads in a row in a row with a delay that doubles each time (10, 10, then 20 minutes…), then the watchdog gives up on the device until one of its entities has been available again for the current delay. Each power cycle, failed power cycle and give-up is notified (one persistent notification per device), recorded in the history, and fires the system_hub_device_power_cycled event.
The plug is always switched on again, even when switching it off failed. If Home Assistant stops while it is off, it is switched on at the first check after the next start. The integration of the device is still watched as usual: if all its entities are unavailable too, it is also reloaded after its grace period.
What counts as unavailable
An integration (config entry) is reloaded when:
- it is loaded, or its setup failed (
setup_retry,setup_error): a reload retries it right away instead of waiting for Home Assistant's next retry. Disabled integrations are left alone - it is not ignored, and it is not a helper (template, group, utility meter, derivative…): their entities follow their sources, so reloading them can't fix anything
- it has at least one enabled entity, and every enabled entity is
unavailable - the most recent of these entities has been unavailable for at least the grace period
- Home Assistant has been running for at least the grace period
Disabled entities are left out. Entities the integration didn't create, for example because the device was off or unreachable when it loaded (shown as "not provided" in Home Assistant), count as unavailable. An integration with a single entity still available is not reloaded.
The check is per integration entry, not per device: an entry with one device down and another one working is left alone.
Limiting reloads
An integration that stays unavailable after a reload is reloaded again after the grace period, then after twice the grace period, and so on, up to the Reloads in a row option. With the defaults: after 15 minutes, then 15 minutes later, then 30 minutes later. If it is still unavailable once the delay after the last one has passed (60 minutes with the defaults), the watchdog gives up on it, sends a notification, and doesn't touch it again until one of its entities has been available for the current delay, counted from its return. An integration that comes back for a moment and falls again keeps its count. Leaving the list is not a recovery: an integration whose setup or unload is still in progress (a reload that went past its timeout), or that has no enabled entity with a state keeps its count until one of its entities is actually available. Disabling an integration resets its count right away, even if you enable it again a few seconds later: once enabled again, it starts over.
A reload that doesn't finish within 5 minutes, or a notify action that doesn't answer within 30 seconds, counts as failed, so that a hung integration can't block the following checks.
The count is saved with the history (.storage/system_hub.watchdog): after a restart of Home Assistant, an integration given up stays so, and one being reloaded keeps its count and delay. Entries removed while Home Assistant was stopped are dropped when it starts. Changing the options keeps the count too, so an integration given up stays so (until a higher Reloads in a row allows more reloads). To start over on an integration, use Try again on its Repairs issue, the system_hub.watchdog_reset action.
Notifications
Each reload, failed reload and give-up creates a persistent notification, one per integration (the next one replaces it), in the language of Home Assistant. It is dismissed once the watchdog starts over for the integration (recovered, reset, disabled or removed), and when System Hub is removed. The same title and message are sent to the notify actions chosen in the options.
Repairs
Giving up on an integration also raises an issue in Settings → System → Repairs, one per integration. It goes away by itself once the integration has recovered (available again for its current delay), is disabled or removed, or gets more reloads after Reloads in a row was raised. An integration still given up when Home Assistant restarts gets its issue back.
Opening the issue offers Try again: submitting it forgets the reloads of the integration, deletes the issue and reloads the integration now (like the system_hub.watchdog_reset action). The reload runs in the background: the dialog closes at once, saying that it was started, and a failed reload is logged. If it is still unavailable afterwards, the watchdog starts over: reloads up to Reloads in a row, then gives up again.
Entities
| Entity | Description |
|---|---|
button.system_hub_sentinel_check_now |
Runs a check now. Unavailable while one is running |
sensor.system_hub_sentinel_unavailable_integrations |
Number of integrations whose entities are all unavailable. Attributes: integrations (list of domain, title, entry_id, since, reloads, gave_up), ignored, max_reloads, paused (the pause entity is on) |
sensor.system_hub_sentinel_last_reload |
Time of the last reload. Attributes: domain, title, entry_id, success, reloads (since Home Assistant started), history (the last 20 reloads, power cycles and give-ups, newest first: kind = reloaded / reload_failed / gave_up / power_cycled / power_cycle_failed / power_cycle_gave_up, at, domain, title, entry_id, attempt, max_reloads, unavailable_since, plus device_id, switch and switch_name for a power cycle, whose title is the device name and entry_id / domain those of its integration; kept across restarts, not recorded in the database) |
sensor.system_hub_sentinel_last_check |
End of the last check |
sensor.system_hub_sentinel_reloads_in_24_h |
Reloads and failed reloads of the last 24 hours (from the history). Attributes: failed, integrations (count per integration) |
Action system_hub.watchdog_check
Runs a check now and waits for the reloads. If a check is already running, waits for it to end, then runs its own. For administrators. Does nothing while Home Assistant is starting.
action: system_hub.watchdog_check
Action system_hub.watchdog_reset
Starts over for one integration entry: forgets its reloads (given up or not), deletes its Repairs issue and reloads it now. Waits for a check still running. Fails if the entry doesn't exist or the reload fails (the count is reset anyway). For administrators.
| Field | Description |
|---|---|
entry_id |
The integration entry (config entry ID), e.g. from the entry_id of the Unavailable integrations sensor |
action: system_hub.watchdog_reset
data:
  entry_id: 01JABCDEF0123456789ABCDEFG
Event system_hub_integration_reloaded
| Field | Description |
|---|---|
entry_id |
Config entry reloaded |
domain |
Integration domain |
title |
Config entry title |
success |
true if the integration loaded again |
unavailable_since |
When its last entity became unavailable |
attempt |
Reload number in a row (1, 2…) |
max_reloads |
Reloads in a row before giving up |
Log each reload in the logbook:
triggers:
  - trigger: event
    event_type: system_hub_integration_reloaded
actions:
  - action: logbook.log
    data:
      name: System Hub Sentinel
      message: >
        reloaded {{ trigger.event.data.title }} ({{ trigger.event.data.domain }}),
        attempt {{ trigger.event.data.attempt }}/{{ trigger.event.data.max_reloads }}
Event system_hub_device_power_cycled
| Field | Description |
|---|---|
device_id |
Device power cycled |
name |
Device name |
switch |
Plug switched off and on |
success |
true if both went through |
unavailable_since |
When its last entity became unavailable |
attempt |
Power cycle number in a row (1, 2…) |
max_reloads |
Power cycles in a row before giving up |
Watchdog card
System Hub serves the Watchdog Card (ported from Integration Watchdog) with its other cards: no separate install. It keeps the card types of Integration Watchdog, so dashboards that used them keep working once Integration Watchdog is removed (a card still pointing at its old sensor finds System Hub's on its own). Add it from the card picker (Watchdog Card (System Hub)), or:
type: custom:system-hub-card
module: watchdog
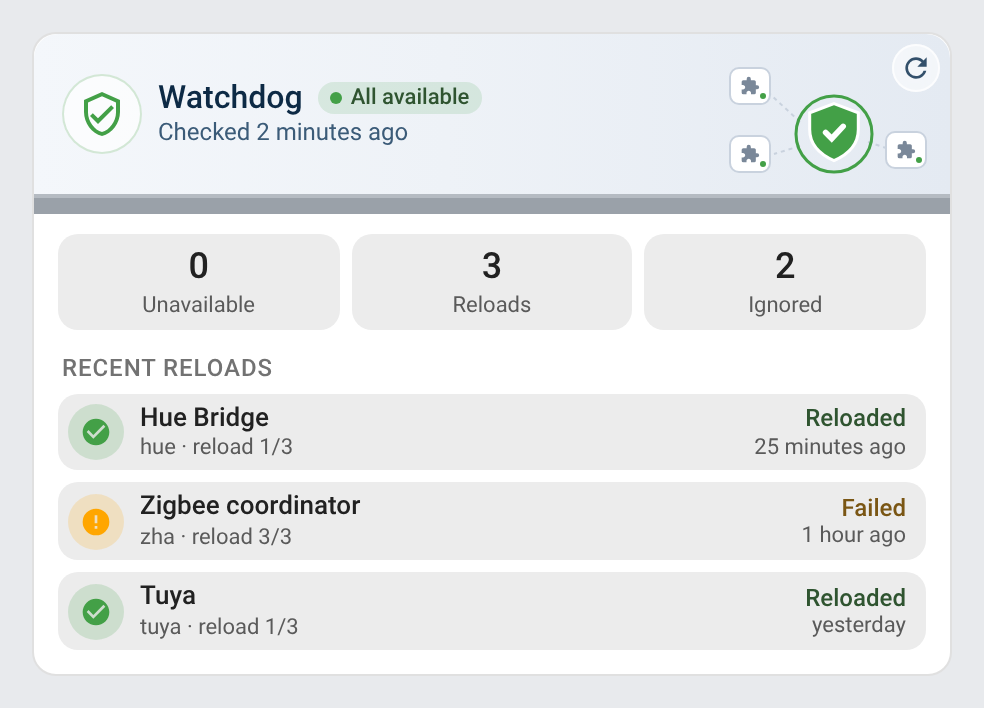
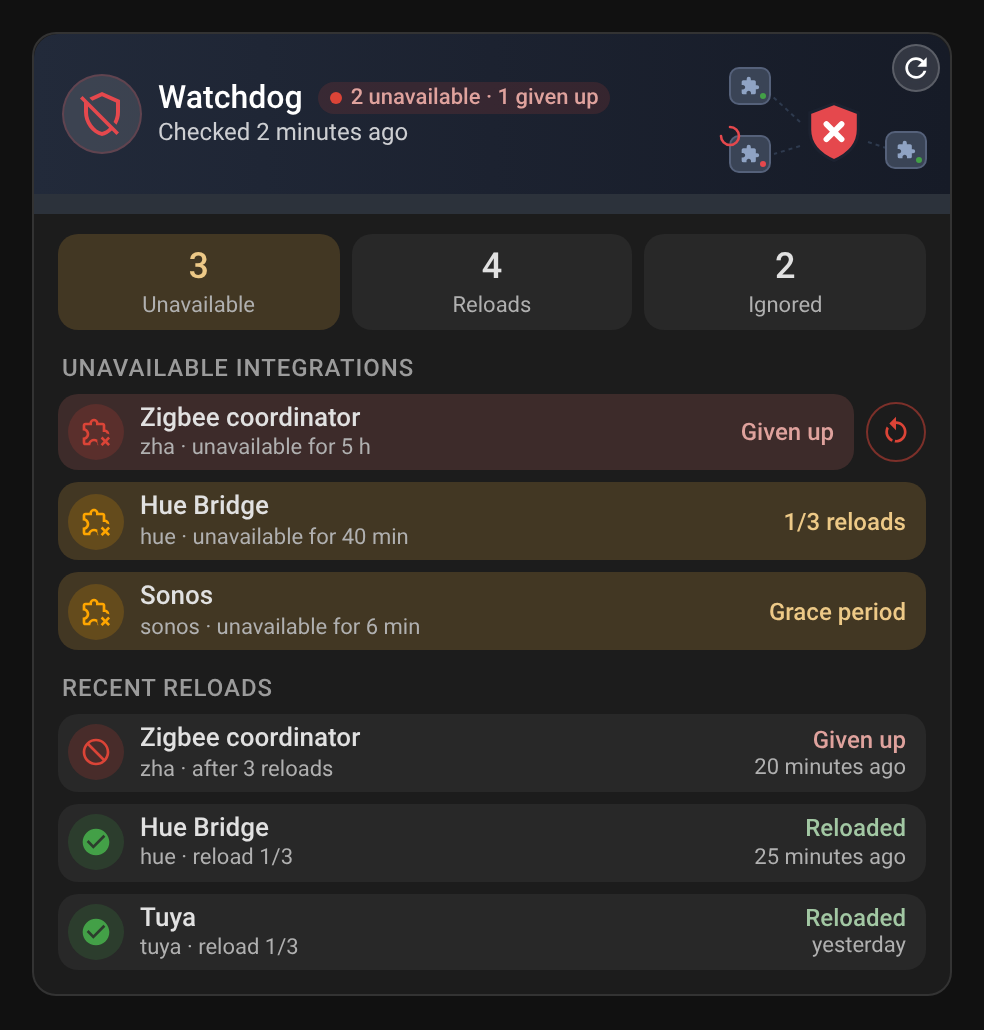
| Unavailable integrations | Everything available |
|---|---|
|
 |
 |
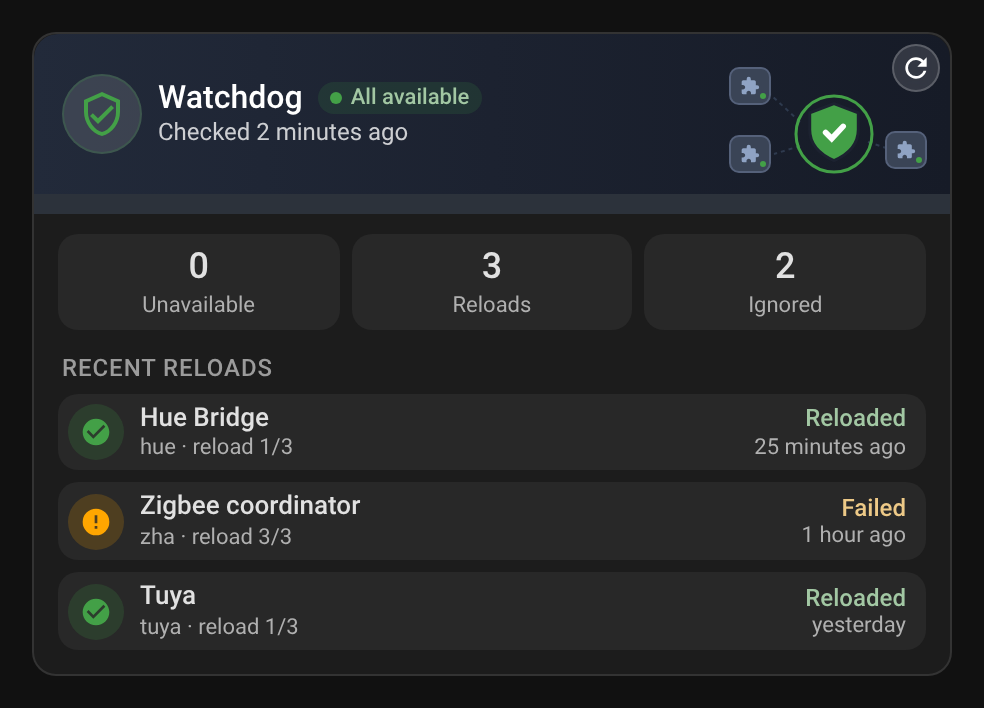 |
- Header: status (all available, n unavailable, n given up, checking…), time of the last check and the Check now button. On a narrow card the status takes a second line, shortens, then keeps only its coloured dot, with the text on hover. In a Sections view the card takes at least 8 columns
- Summary: unavailable integrations, reloads since Home Assistant started, ignored integrations (listed on hover)
- Unavailable integrations: for each one, how long it has been down and its reloads (1/3 reloads), Grace period before the first one, Given up once the limit is reached
- Recent reloads: the last attempt of each integration (reloaded, failed or given up), newest first, with the attempt and how long ago. The history is saved, so it survives a restart
- For an administrator, a row opens the integration's page in Settings on its entry, to reload it by hand or read its logs (other users can't open Settings, so their rows are not clickable). Integration logos come from the Home Assistant brands
- For an administrator, an integration given up gets a Try again button next to its row: it runs the
system_hub.watchdog_resetaction (start over and reload now)
It reads the Watchdog module's entities (sensor.system_hub_sentinel_unavailable_integrations, sensor.system_hub_sentinel_last_reload, sensor.system_hub_sentinel_last_check, button.system_hub_sentinel_check_now), found by their translation keys, so renamed entities are still found. Every option is in the visual editor:
| Option | Default | Description |
|---|---|---|
entity |
found automatically | The Unavailable integrations sensor of System Hub |
title |
Watchdog | Card title |
show_title |
true |
Show the title in the header (e.g. false under a section heading of your own) |
illustration |
true |
The illustrated header with the shield (see Lovelace cards); false for the classic header |
illustration_theme |
auto |
day or night picture; auto follows the Home Assistant theme |
show_subtitle |
true |
Show the subtitle under the title |
show_stats |
true |
Summary tiles |
show_unavailable |
true |
Unavailable integrations |
show_history |
true |
Recent reloads |
history_count |
5 |
Recent reloads shown (one per integration), from 1 to 20 |
check_button |
true |
Check now button in the header. It presses the button entity, so any user who sees the card can run a check (only the system_hub.watchdog_check action is limited to administrators) |
hide_when_ok |
false |
Hide the card while every integration is available (always shown while editing the dashboard) |
language |
Home Assistant's | en, fr, de, es, it, nl, pt, pl, sr, sr-Latn, ro, da, sv, bg, ru, uk, hu, sk, cs, sl, lv or el |
Watchdog mini card
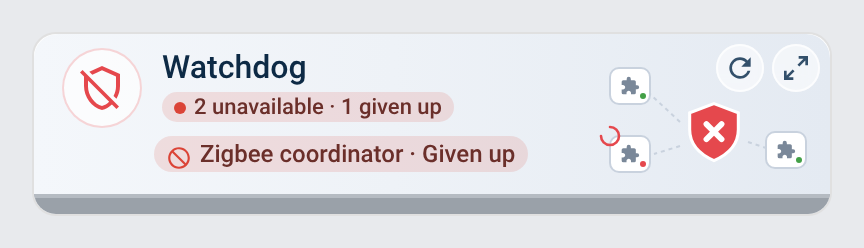
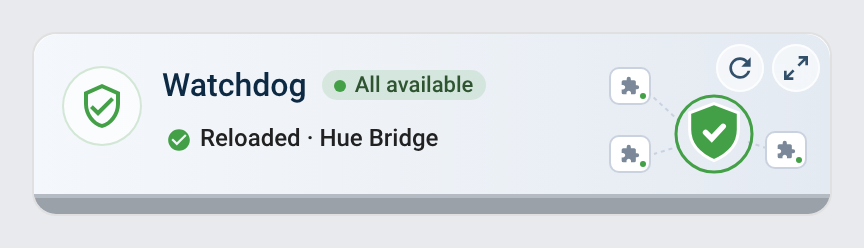
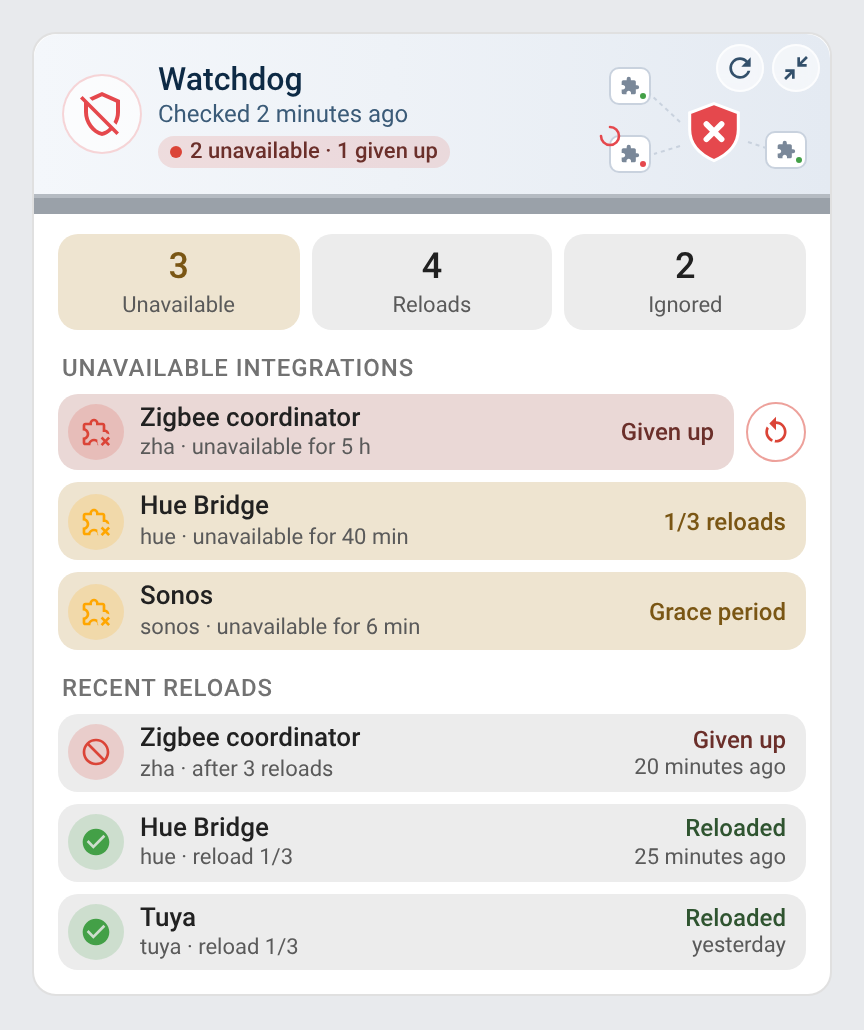
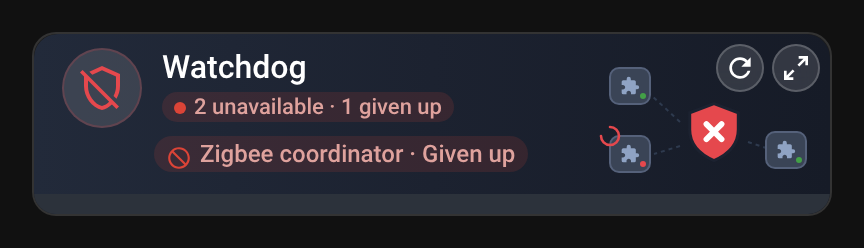
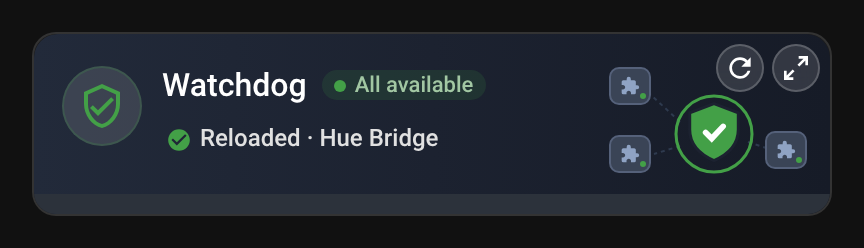
custom:system-hub-mini-card (module: watchdog) shows the essentials on two lines, for a compact dashboard: the icon, title, Check now button and status, then a chip per unavailable integration (Hue Bridge · 1/3 reloads, Zigbee · Given up), or the last reload while everything is available, and the time of the last check. Search for Watchdog Mini Card (System Hub) when adding a card, or in YAML:
type: custom:system-hub-mini-card
module: watchdog
| Unavailable integrations | Everything available | Zoomed in |
|---|---|---|
 |
 |
 |
 |
 |
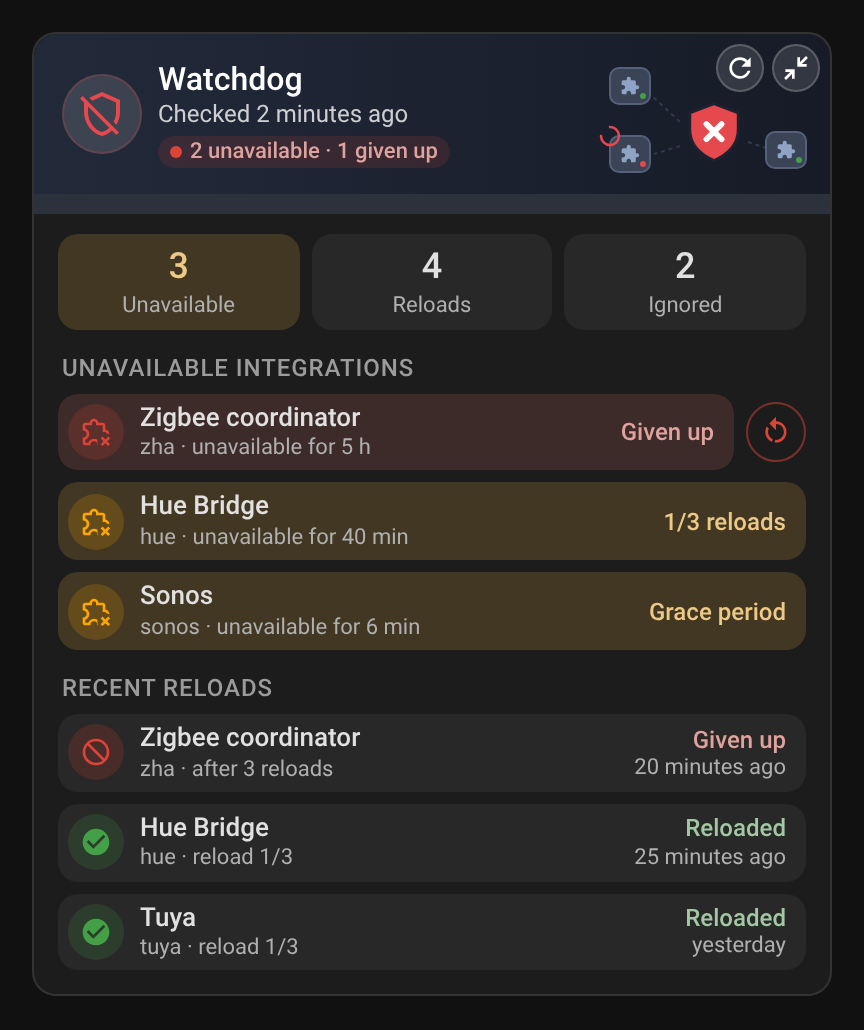 |
- The detail button (top right) switches the card to the full Watchdog card, with the same options, and back, as does a click anywhere else on the page
- For an administrator, an integration's chip opens its page in Settings, on its entry; for other users, a chip opens the sensor
- In a Sections view the card takes 6 columns by default, its minimum; on a narrow card the icon gives way and the status keeps only its coloured dot
It takes every option of the full card (they set its detail view, hide_when_ok and check_button apply to both views), plus:
| Option | Default | Description |
|---|---|---|
zoom |
true |
Detail button showing the full card. false removes it |
The screenshots are made by python scripts/screenshots_watchdog.py.
Marketplace
| Option | Default | Description |
|---|---|---|
| Check interval | 24 h | Hours between two automatic checks, from 1 to 168. 0 turns the automatic check off. Counted from the end of the last check (or from the installation before the first one), across restarts |
| Back up before installing updates | off | Before Update all (and install_updates without backup), create Home Assistant's automatic backup — what it holds, where it goes and how many are kept follow Settings → System → Backups. If the backup fails, nothing is installed and the failure is listed with the updates that couldn't be installed |
Entities
| Entity | Description |
|---|---|
button.system_hub_updates_check_for_updates |
Starts a check. Unavailable while one is running |
sensor.system_hub_updates_status |
idle, running or error. Attributes: done, total, updates, failed (list of owner/repo), not_checked (owner/repo of the repositories added from a link that the last check couldn't check because no GitHub account is connected to the Marketplace), error, checking (update entities being checked by marketplace_check_repository), installing (update entities left to install, the current one first), install_total (how many updates the install run started with, 0 when none runs; the done ones are install_total minus the entities in installing), backing_up (true while the backup before installing runs), install_failed (title: error of the updates that couldn't be installed), github_connected (whether a GitHub account was connected to the Marketplace at the last check), rate_limit_remaining and rate_limit_reset (GitHub requests left and when the limit resets, as read at the last check; empty without a GitHub account) |
sensor.system_hub_updates_last_check |
End of the last check. Attributes: scan_interval (hours, 0 = automatic check off), next_check (when the next automatic check is due, within the hour after a failed or skipped one, kept across restarts; null when it is off) |
Action system_hub.marketplace_check_updates
| Field | Default | Description |
|---|---|---|
wait |
false |
Wait until every repository has been checked before the action ends. The action then fails if the check failed or could not check a repository (the error lists them), so the steps after it only run on a complete check. The repositories added from a link that couldn't be checked because no GitHub account is connected don't make it fail: they are in the status sensor's not_checked attribute |
Check every night and get notified of the updates found:
triggers:
  - trigger: time
    at: "04:00:00"
actions:
  - action: system_hub.marketplace_check_updates
    data:
      wait: true
  - condition: template
    value_template: "{{ state_attr('sensor.system_hub_updates_status', 'updates') | int(0) > 0 }}"
  - action: notify.mobile_app_phone
    data:
      message: "{{ state_attr('sensor.system_hub_updates_status', 'updates') }} Marketplace update(s) available"
Action system_hub.marketplace_check_repository
| Field | Description |
|---|---|
entity_id |
Marketplace update entities (update.* of platform marketplace) of the repositories to check |
The action ends once the repositories are checked, and fails with the reason if one could not be. It doesn't change the status or the last check, which belong to the full check. While a full check runs, it waits for that check to end and fails if that check failed or could not check one of these repositories; a repository already being checked by another call is not checked twice: the action waits for that call's result, and checks it itself if that call is cancelled first. A full check started meanwhile waits for these repositories too instead of checking them again. If System Hub is reloaded or removed while the action waits (here or with wait: true), it fails with "The check was cancelled".
action: system_hub.marketplace_check_repository
data:
  entity_id: update.mushroom_update
Action system_hub.marketplace_install_updates
| Field | Default | Description |
|---|---|---|
entity_id |
every Marketplace update entity with an update | Marketplace update entities to install |
wait |
false |
Wait until every update is installed; the action then fails if one couldn't be |
backup |
the Back up before installing updates option | Create Home Assistant's automatic backup (backup.create_automatic) first; nothing is installed if it fails |
Installs the updates one after the other with update.install, in the background (a check running ends first). One failing update doesn't stop the others; the failures are in the status sensor's install_failed attribute. Administrators only, like the Marketplace, and the Marketplace warning must have been accepted once in Settings → Marketplace (an install from an automation runs without a user); it can't run twice at the same time. Meanwhile, no full check starts: the Check for updates button is greyed out, system_hub.marketplace_check_updates fails with "Updates are being installed", and an automatic check that falls due runs once the installs are done. Integrations need a restart of Home Assistant afterwards, which the Marketplace asks for in Settings → Repairs.
action: system_hub.marketplace_install_updates
data:
  wait: true
Event system_hub_marketplace_updates_found
Fired at the end of a full check (button, marketplace_check_updates or automatic) when updates are available that the previous full check didn't find: only when the set of repositories with an update grows, not when it stays the same or shrinks (an update installed, then found again later, fires again). The first check after installing the integration only records the updates available; the list is kept across restarts. marketplace_check_repository doesn't fire it.
| Data | Description |
|---|---|
entry_id |
Config entry of System Hub |
count |
Number of new updates |
updates |
The new updates, as owner/repo |
total |
Number of updates available, new or not |
triggers:
  - trigger: event
    event_type: system_hub_marketplace_updates_found
actions:
  - action: notify.mobile_app_phone
    data:
      title: "Marketplace"
      message: >-
        {{ trigger.event.data.count }} new update(s): {{ trigger.event.data.updates | join(', ') }}
        ({{ trigger.event.data.total }} available)
Marketplace Refresh card
The card of System Hub's Marketplace module, ported from ha-marketplace-refresh: same element name, options and look, so a dashboard keeps working once the module replaces the old integration. System Hub serves it with its other cards: no separate install. Add it from the card picker, or:
type: custom:system-hub-card
module: marketplace
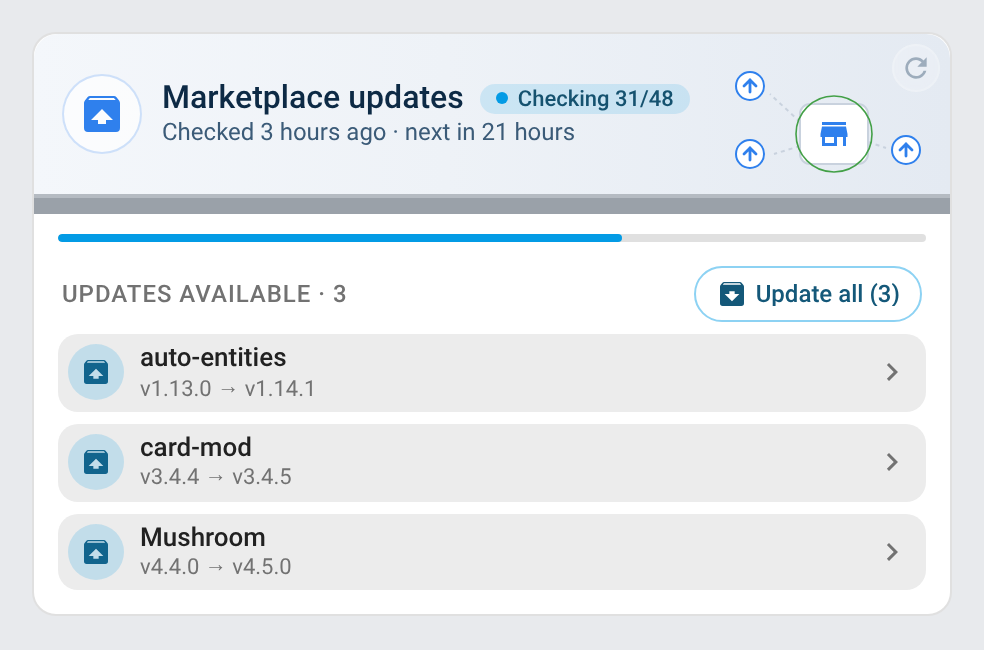
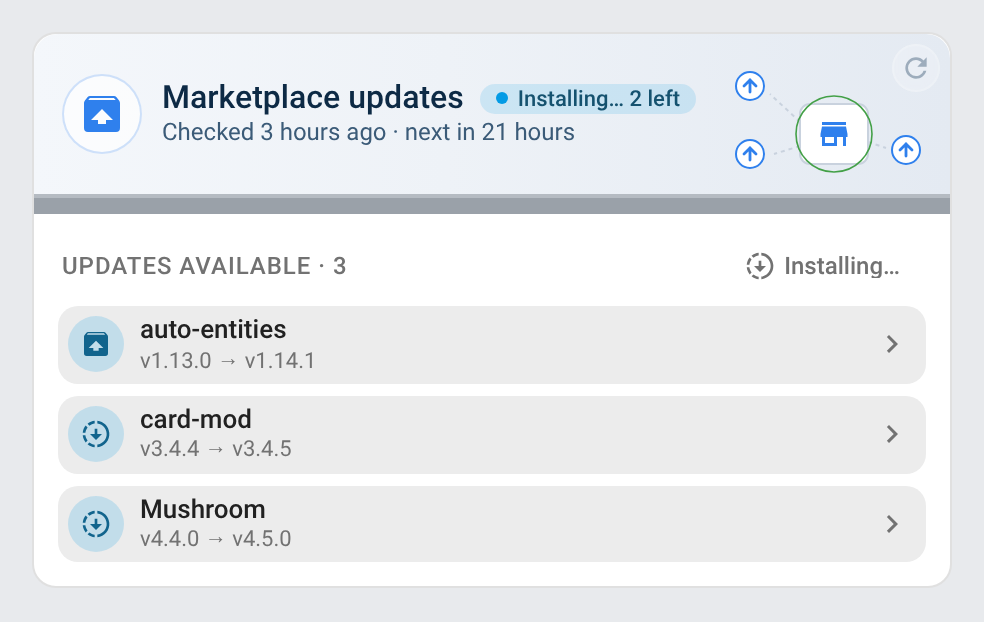
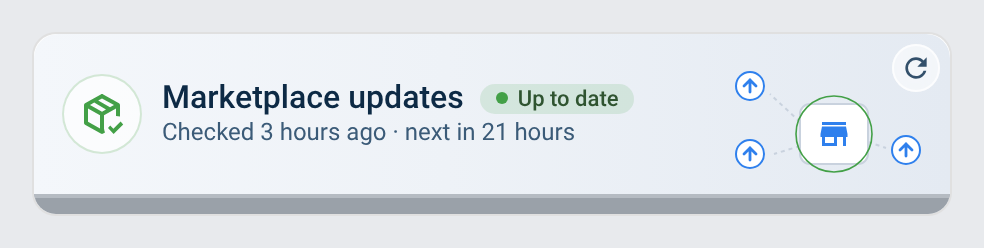
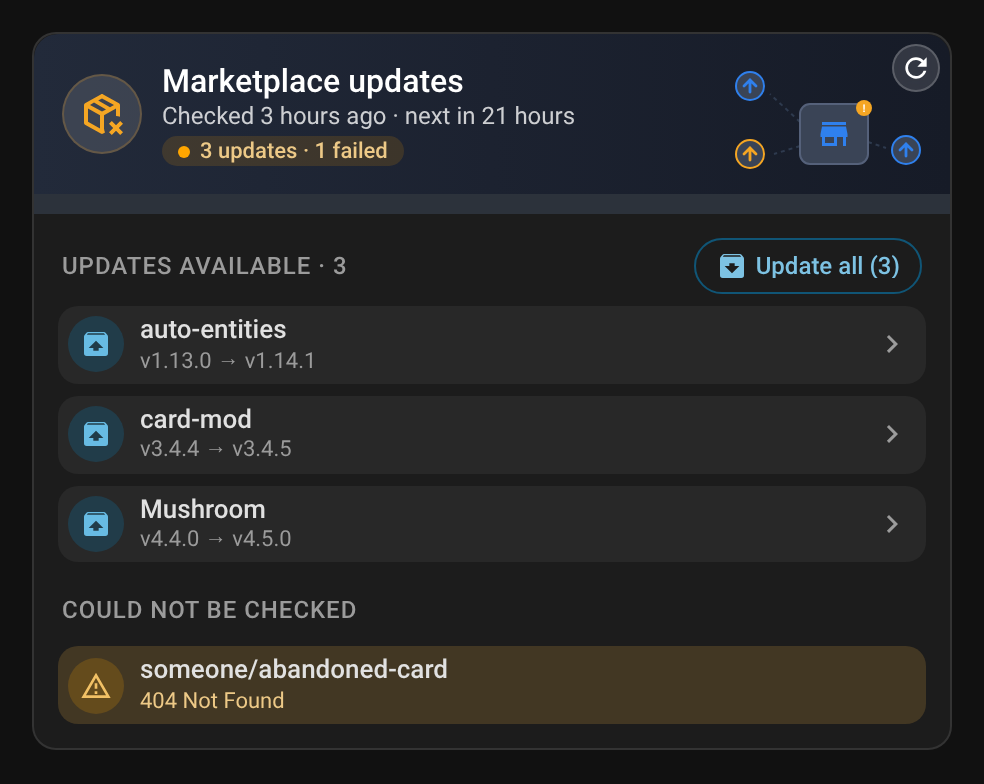
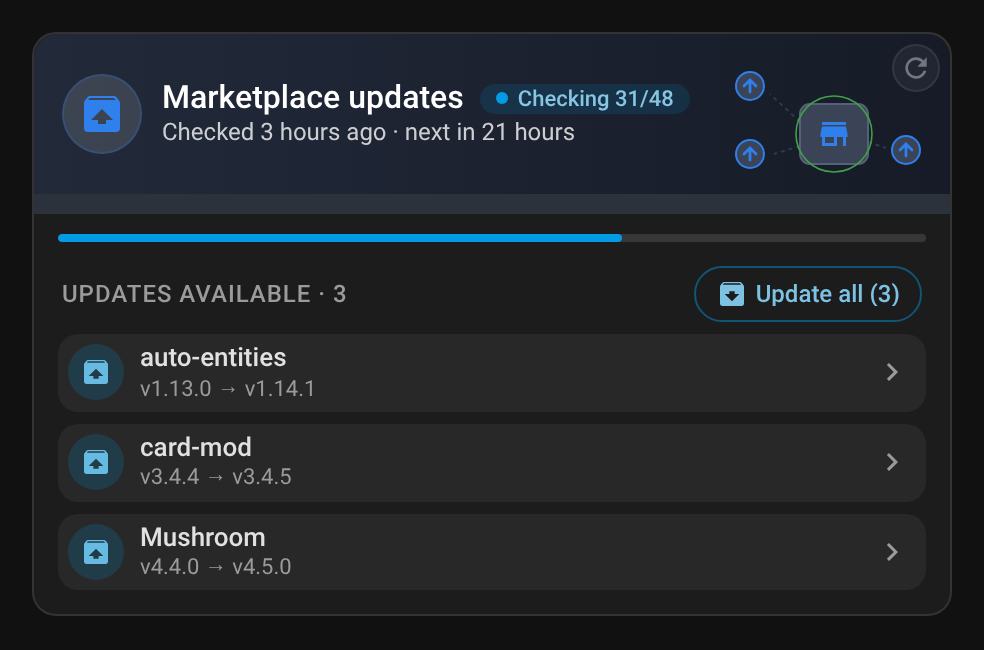
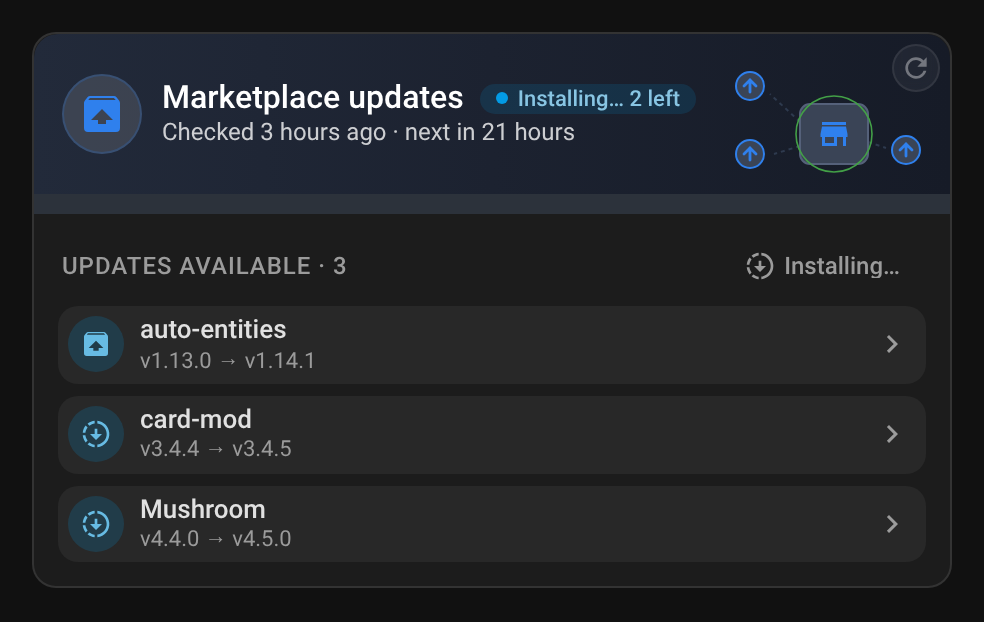
| Updates available | Checking | Installing | Up to date |
|---|---|---|---|
|
 |
 |
 |
 |
 |
 |
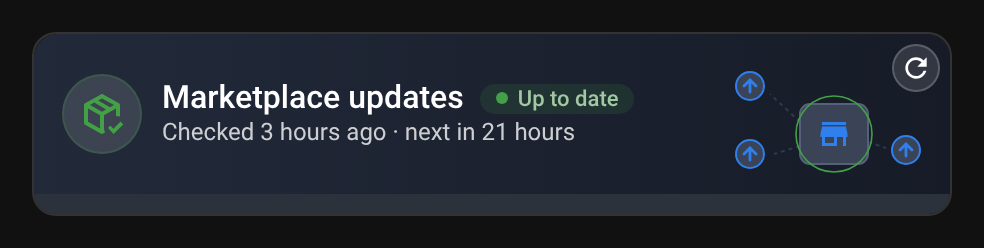 |
- Header: status (up to date, n updates, n failed, checking done/total, error), when the last check ran and when the next automatic one is due, and the Check for updates button
- Progress bar while a check runs
- Few GitHub requests left: under 1,500, a line with the number left and when GitHub's limit resets — checks wait for it
- Updates available (with their number): the repositories with an update, from the Marketplace's own update entities, with the installed and new version, hidden when there is none. A row opens the update entity, to install it or read the release notes
- Update all (n): installs every update listed, one after the other, after a confirmation at the top of the card (administrators only). The rows being installed and the number left show the progress
- Could not be installed: the updates that failed, with the error
- Could not be checked: the repositories the last check couldn't fetch (and, without a GitHub account connected, the ones added from a link, with a line saying why), and the error of a check that failed
Every option is in the visual editor:
| Option | Default | Description |
|---|---|---|
entity |
found automatically | The Marketplace Status sensor (sensor.system_hub_updates_status); its Last check sensor or Check for updates button lead to it, and an entity that no longer exists (from the old integration, say) falls back to it |
title |
Marketplace updates | Card title |
show_title |
true |
Show the title in the header (e.g. false under a section heading of your own) |
illustration |
true |
The illustrated header with the update arrow (see Lovelace cards); false for the classic header |
illustration_theme |
auto |
day or night picture; auto follows the Home Assistant theme |
show_subtitle |
true |
Show the subtitle under the title |
show_updates |
true |
Updates available |
show_failed |
true |
Repositories that couldn't be checked, and the error of a failed check |
check_button |
true |
Check for updates button in the header |
install_button |
true |
Update all button on the updates available (administrators only) |
hide_when_ok |
false |
Hide the card while everything is up to date (it shows while checking, with an update or an error, and always while editing the dashboard) |
language |
Home Assistant's | en, fr, de, es, sr, sr-Latn, it, nl, pt, pl, ro, da, sv, bg, ru, uk, hu, sk, cs, sl, lv or el |
Entities and actions used
The card reads the Marketplace module's sensors, told apart by their translation key (marketplace_status, marketplace_last_check, button marketplace_check_updates) so renamed entity IDs keep working, and only System Hub's (the other modules have a status too), plus the Marketplace's own update entities. Check for updates presses button.system_hub_updates_check_updates; Update all calls system_hub.marketplace_install_updates with the update entities listed.
Screenshots: python scripts/screenshots_marketplace.py (mock data, frozen clock; repository pictures are not fetched).
Batteries
Every battery of the house: low batteries notified twice a day, replacement forecast and spare batteries to buy.
| Option | Default | Description |
|---|---|---|
| Low battery threshold | 20 % |
A battery is low below this level |
| Low for at least | 24 h |
Hours a battery must have stayed below the threshold before it is notified (0: at the next notification) |
| Morning notification | 09:00 |
First of the two daily notifications |
| Evening notification | 19:00 |
Second of the two daily notifications |
| Notify actions | — | Also send the notifications with these actions (notify.mobile_app_…); a persistent notification is always created |
| Ignored batteries | — | Batteries never monitored |
| Ignored integrations | mobile_app |
Integrations whose batteries are never monitored |
Notifications
At each notification time, the batteries that have been below the threshold for the duration are listed, the lowest first:
3 low batteries
• Front door (Entrance): 8 % · CR2032
• Kitchen leak sensor (Kitchen): 17 % · 2× AAA
• Smoke detector (Hallway): low
As soon as one of them is unavailable, the title becomes N batteries to check and its line says unavailable. The battery type ends the line when Battery Notes knows it (the battery_type and battery_quantity of the battery, or its device's Battery type sensor).
When no battery is due, nothing is sent and the persistent notification is cleared.
Entities
| Entity | Description |
|---|---|
sensor.system_hub_battery_low_batteries |
Number of batteries below the threshold. Attributes: unavailable (number of unavailable batteries), due (number needing attention for the duration), threshold, duration (h), batteries (every monitored battery: entity_id, device_id, name, area, level, icon, low, alert (low or unavailable), due, unavailable, below_since, drain_per_day (% per day measured on the history, 0 when stable, null when unknown), days_left (before the threshold, null when stable, unknown, or already low or unavailable), replace_by (that date), battery_type (from Battery Notes, 2× AA, null when unknown)) |
sensor.system_hub_batteries_last_notification |
Time of the last notification; attribute notified (number of batteries notified) |
sensor.system_hub_batteries_spare_batteries |
Number of battery types short of spares (0: enough). Attributes: stock (spares per type counted), needed (batteries of that type low, unavailable or forecast to reach the threshold within 30 days, with their quantity: a 2× AA device needs 2), short (the types missing some, and how many). Only the types set with system_hub.batteries_set_stock |
sensor.system_hub_batteries_next_replacement |
Date the first battery is forecast to reach the threshold; a battery already low or unavailable comes first (since when it has been). Attributes: entity_id, name, level, days_left (0 for one already low), forecast_at (last measure of the drains) |
button.system_hub_batteries_notify_now |
Sends every low battery right away, whatever the duration (or No low battery) |
Action system_hub.batteries_notify
Sends every battery below the threshold right away, whatever the duration, or a No low battery message when none is low (the scheduled notifications only list the batteries low for the duration). For example from an automation when you leave on holiday:
action: system_hub.batteries_notify
Action system_hub.batteries_set_stock
Sets how many spare batteries of a type you keep, by the type Battery Notes gives without the quantity (AA, AAA, CR2032…). Each replacement detected for a battery of that type (a rise of 15 points, the system_hub_battery_replaced event) then takes its quantity out of the count, never below 0. Without count, the type is no longer counted. When spares are missing, the notification ends with Spare batteries to buy: 1 AA, 2 CR2032. Open to every user, like system_hub.batteries_notify.
action: system_hub.batteries_set_stock
data:
  battery_type: AA
  count: 8
Action system_hub.batteries_export
Writes every monitored battery to a CSV file (entity_id, name, area, level, low, unavailable, due, below_since, drain_per_day, days_left, replace_by, battery_type (from Battery Notes)), for a spreadsheet or a report. Administrators only. path is optional: system_hub_batteries.csv in the configuration folder by default; a relative path is inside the configuration folder, an absolute one must be in the configuration folder or in allowlist_external_dirs. The file name must end in .csv, and hidden folders such as .storage are refused. Returns the path and the number of batteries.
action: system_hub.batteries_export
data:
  path: exports/batteries.csv
response_variable: result  # {"path": "/config/exports/batteries.csv", "batteries": 23}
Events
The module fires two events on the Home Assistant bus, on a change only (never for a battery already low at start-up, after a reload or when first found):
| Event | When | Data |
|---|---|---|
system_hub_battery_low |
A battery goes below the threshold (or a low-battery binary sensor turns on); a battery that goes unavailable and comes back still low does not fire it again |
entry_id, entity_id, device_id, name, level (null for a binary sensor), threshold |
system_hub_battery_replaced |
A battery's level rises by 15 points or more since its last reading (the same rule that restarts the replacement forecast), even with an unavailable gap while the battery was out | entry_id, entity_id, device_id, name, level, previous_level |
For example, a notification on your phone as soon as a battery goes low, and a logbook entry when one is replaced:
automation:
  - alias: Battery low
    triggers:
      - trigger: event
        event_type: system_hub_battery_low
    actions:
      - action: notify.mobile_app_phone
        data:
          title: Low battery
          message: "{{ trigger.event.data.name }}: {{ trigger.event.data.level }} %"
  - alias: Battery replaced
    triggers:
      - trigger: event
        event_type: system_hub_battery_replaced
    actions:
      - action: logbook.log
        data:
          name: "{{ trigger.event.data.name }}"
          message: "battery replaced ({{ trigger.event.data.previous_level }} % → {{ trigger.event.data.level }} %)"
          entity_id: "{{ trigger.event.data.entity_id }}"
How it works
A battery is a sensor with the battery device class (its level in %) or a binary_sensor with the battery device class (on means low). When a device has both, its level sensor is used. Hidden entities, the ignored batteries and the batteries of the ignored integrations are left out.
When a battery goes below the threshold, System Hub writes down the time. For a battery that is already low when it is first seen (right after turning the module on, say), that time is read from the history, up to 30 days back. It is kept while the battery is unavailable (a dead battery often makes its device unavailable) and across restarts, and forgotten once the battery is back above the threshold (replaced or recharged). A battery is notified once that time is older than the duration.
The list is updated whenever a battery changes, and every 10 minutes.
Once a day (and at start), the drain of each level battery is measured on its recorded history over the last 30 days: a least-squares slope of the level, counted from the last replacement (a rise of 15 points or more), when at least three days and three points are recorded. From that drain and the current level come the days left before the threshold and the replacement date; a stable level (less than 0.05 % a day) gives none. The days left follow the level between two measures.
Battery Monitor card
The Battery Monitor Card and Battery Monitor Mini Card, served by System Hub for its Batteries module. They are custom:system-hub-card and custom:system-hub-mini-card with module: batteries; the cards of Battery Monitor are moved to them at System Hub's next start.
Add it from the dashboard (Add card → Battery Monitor Card) or in YAML:
type: custom:system-hub-card
module: batteries
| Option | Default | Description |
|---|---|---|
entity |
Auto | The System Hub Low batteries sensor; found automatically |
title |
Batteries |
Card title |
show_title |
true |
Show the title in the header (e.g. false under a section heading of your own) |
illustration |
true |
The illustrated header with the battery (see Lovelace cards); false for the classic header |
illustration_theme |
auto |
day or night picture; auto follows the Home Assistant theme |
columns |
1 |
Number of battery columns (1–3); a card too narrow for them shows fewer, each at least 160 px wide |
only_low |
false |
Show only the batteries below the threshold or unavailable |
hide_when_ok |
false |
Hide the whole card when every battery is above the threshold and available (always shown while editing the dashboard) |
notify_button |
true |
Bell button in the header that presses System Hub's Notify now button: it turns while sending, then shows a check mark, or the reason in its tooltip when it fails; disabled while the button is unavailable |
popup |
true |
Full screen button in the header |
expanded |
false |
Lay the full screen view out in the card itself (by room, by type, by replacement date, what to replace, next replacement); no full screen button then |
csv_button |
true |
Export CSV button in the full screen view and the expanded card |
battery_models |
— | The battery type of every device of a model: Hue dimmer switch: CR2450 |
battery_types |
— | The type of one battery, by battery entity: sensor.remote_battery: 2× AAA |
language |
Auto | Force language: en, fr, de, es, it, nl, pt, pl, ro, da, sv, bg, ru, uk, hu, sk, cs, sl, lv, el, sr or sr-Latn |
Tap a battery to open its details.
Mini card
A compact card for a half-width column: the header with its status and Notify now button, and only the batteries needing attention. The detail button (top right) shows the full card; a click outside brings the compact view back. Same options and editor:
type: custom:system-hub-mini-card
module: batteries
Full screen
The full screen button shows every battery grouped by room, by battery type or by replacement date, with To replace (how many batteries of each type to buy) and Next replacement (the first battery the measured drain takes to the threshold). Export CSV downloads every battery (room, type, level, status, drain, days left, replacement date). It closes with its button, Escape, a click outside, or the back button on a phone.
Battery types
System Hub already gives each battery its type: the one set in panel's Settings → Batteries ⚙ → Battery types (per battery or per device model), otherwise Battery Notes. The types set in the card editor (Battery types by model, Battery types by battery) still apply on top, for that card only; Settings → Batteries ⚙ → Import from Battery Monitor brings those of existing cards into System Hub. 2× AA (or 2x AA, AA x2) counts two batteries; batteries without a type are grouped under Unknown type.
type: custom:system-hub-card
module: batteries
battery_models:
  Hue dimmer switch: CR2450
battery_types:
  sensor.remote_battery: 2× AAA
Screenshots
A battery due for replacement blinks its icon (honours prefers-reduced-motion):
| Light | Dark |
|---|---|
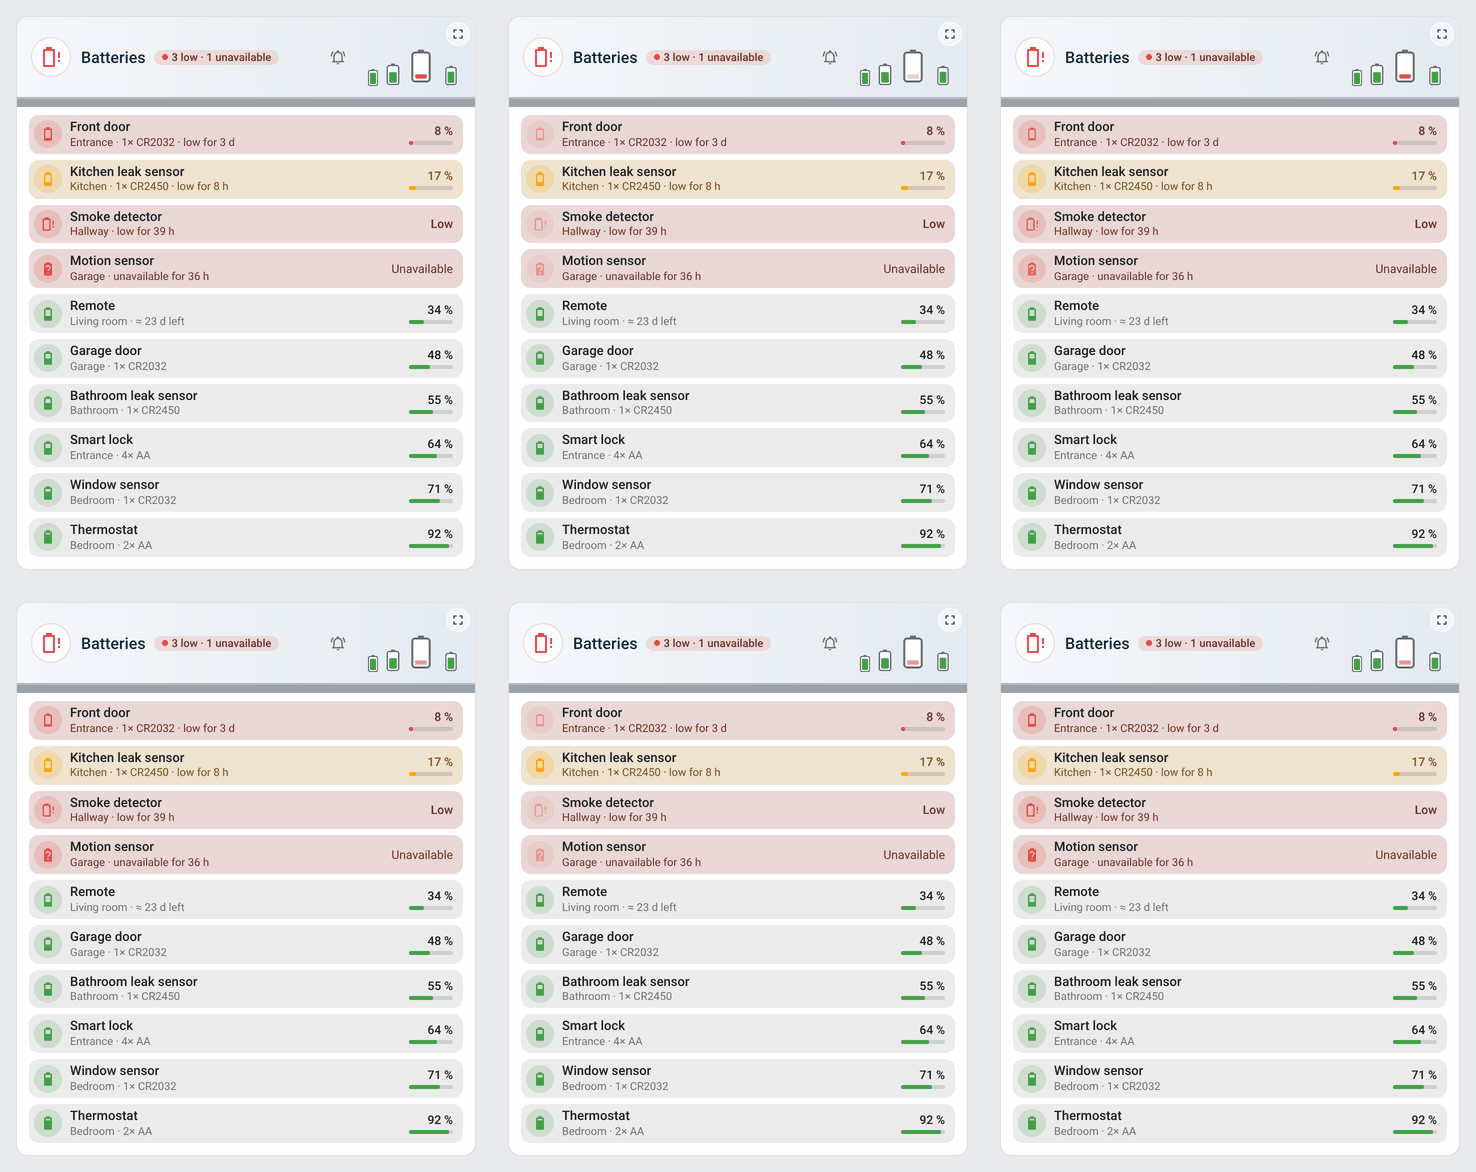 |
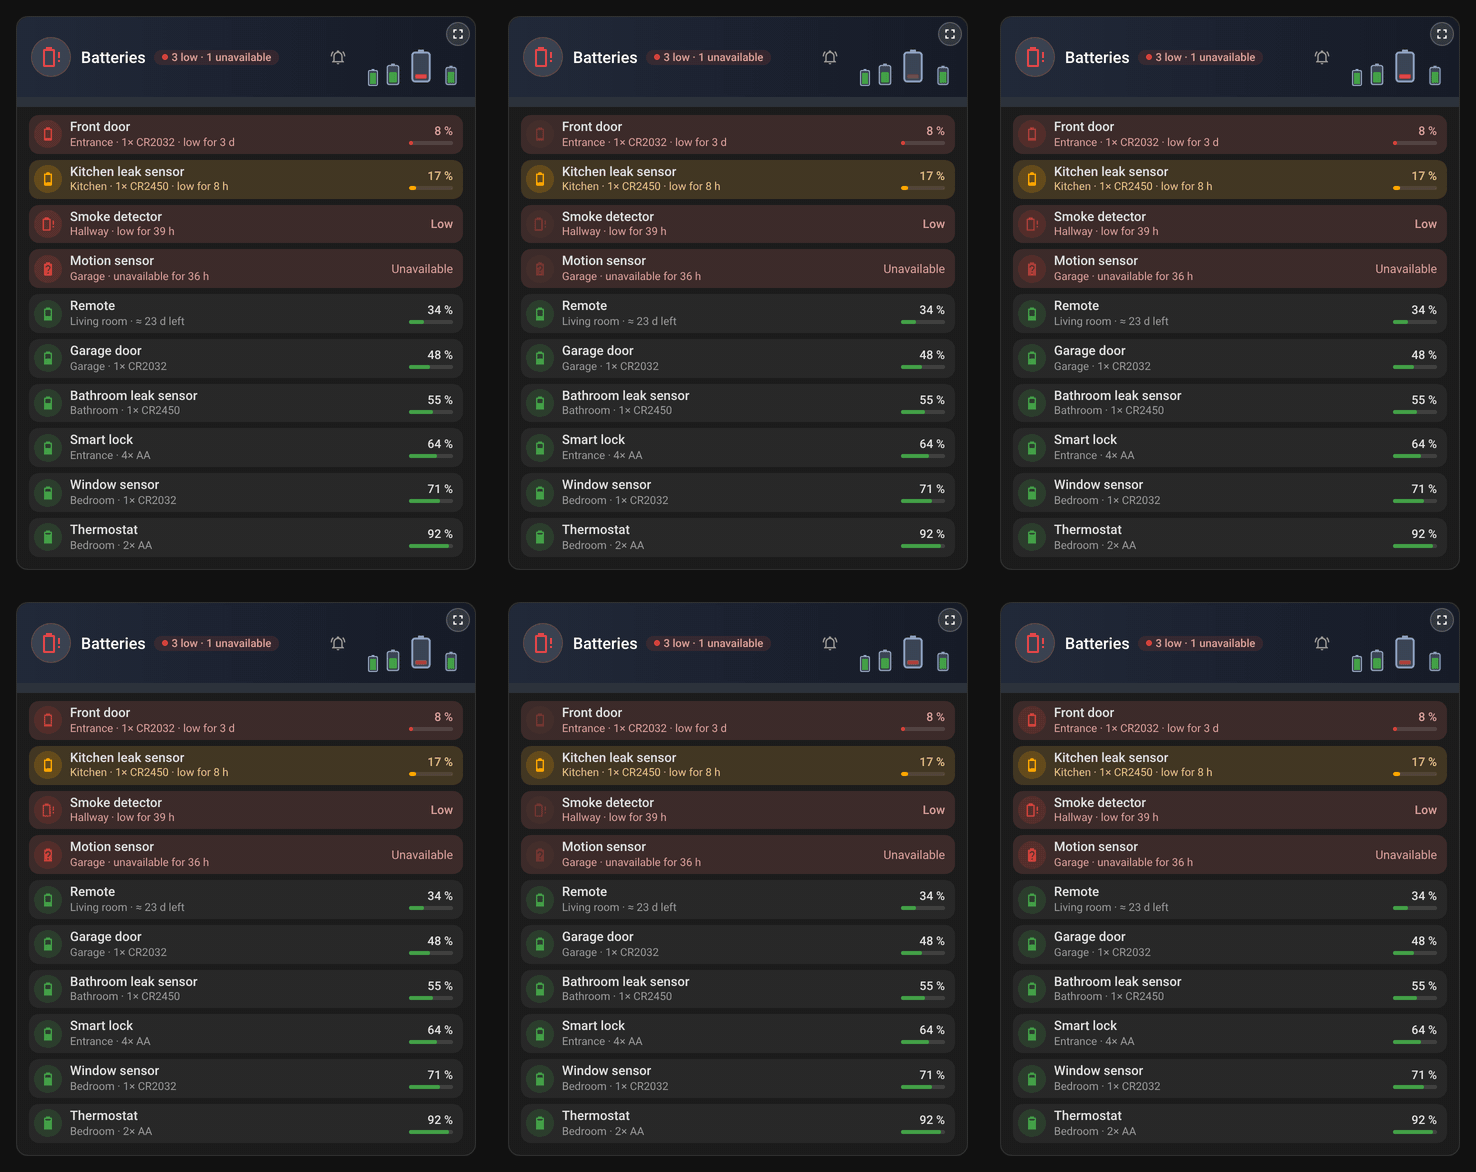 |
| Every battery | Low batteries only |
|---|---|
|
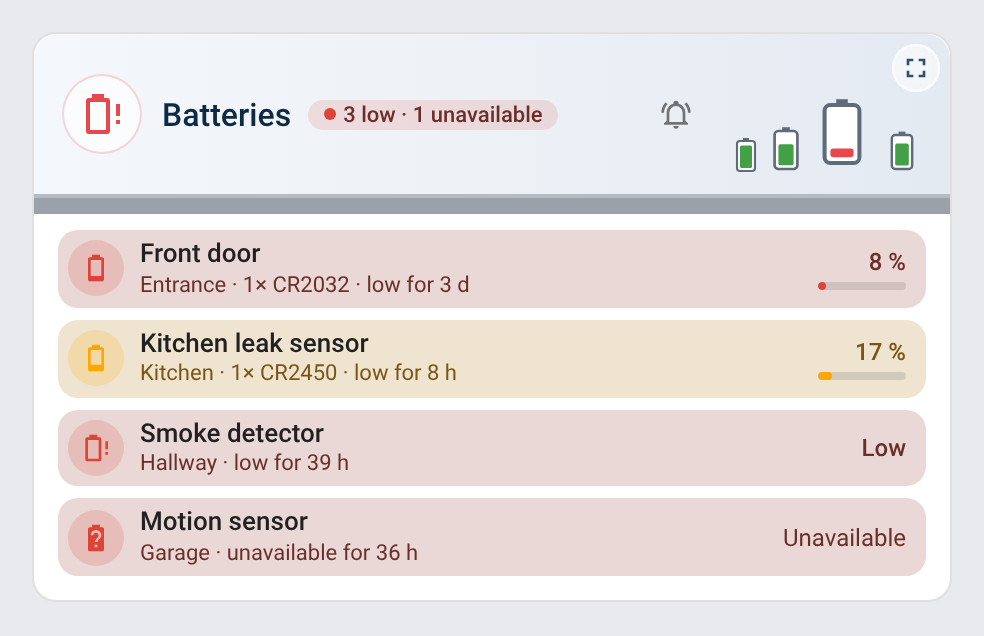 |
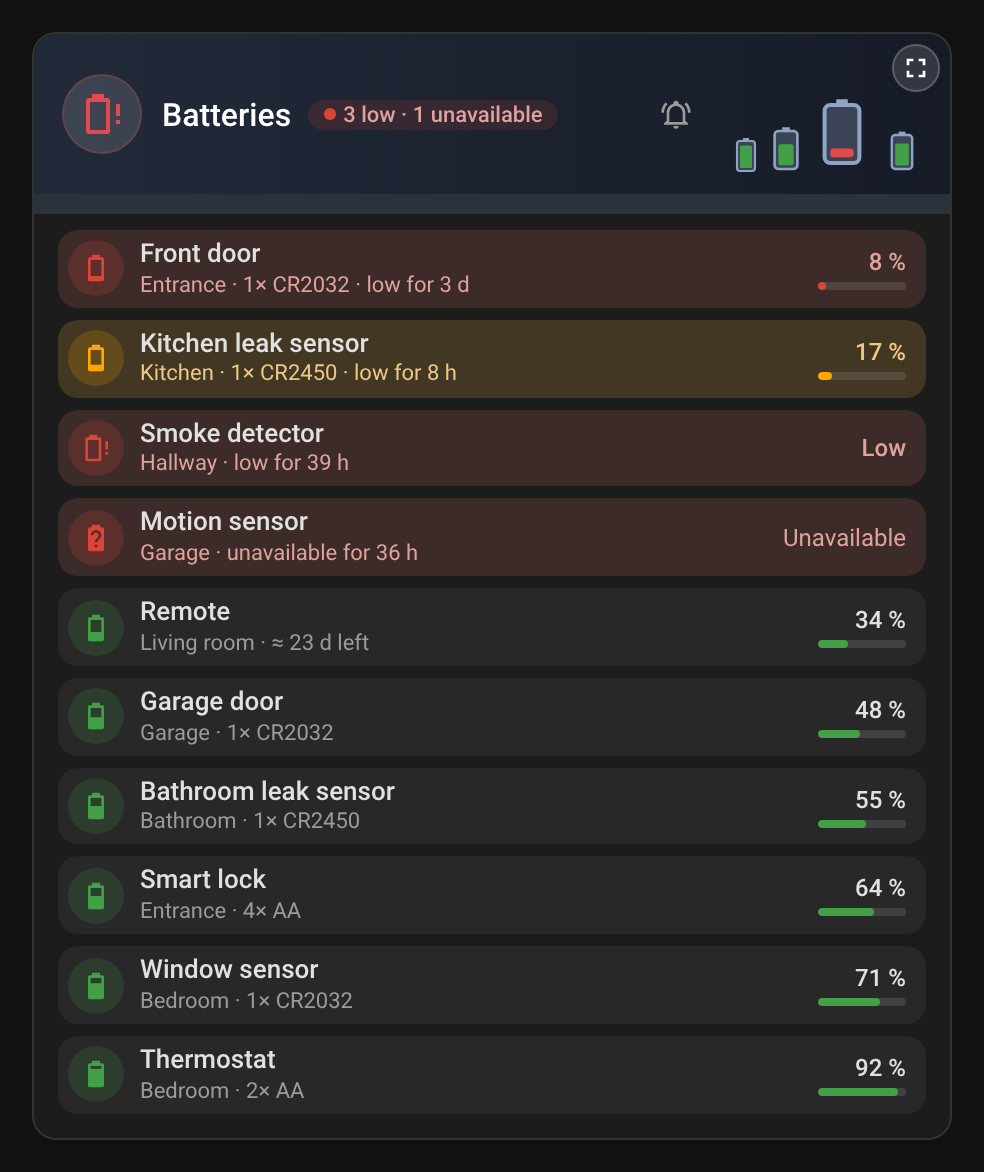 |
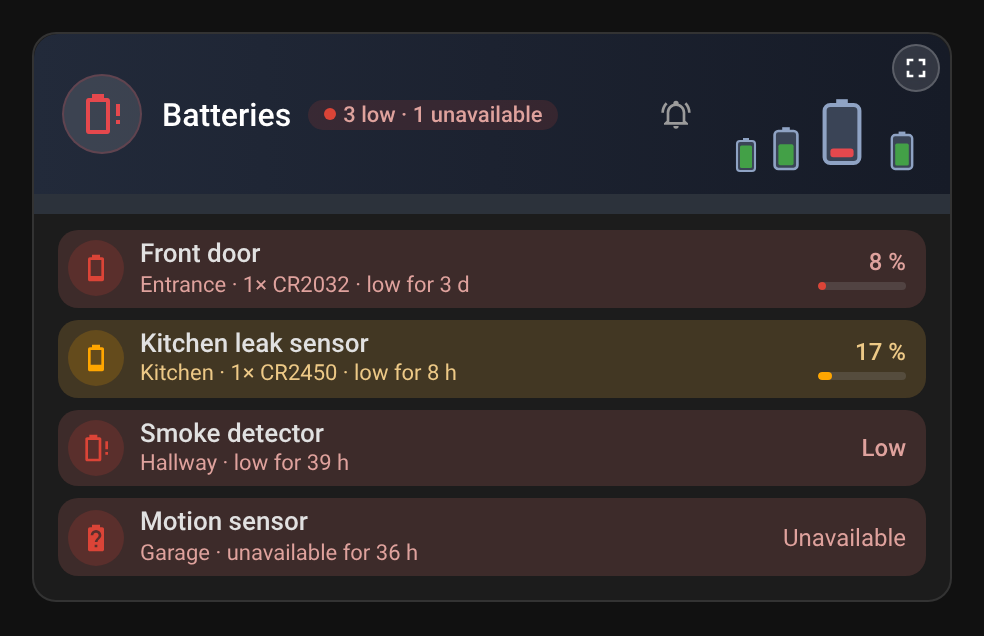 |
| Mini card | Dark |
|---|---|
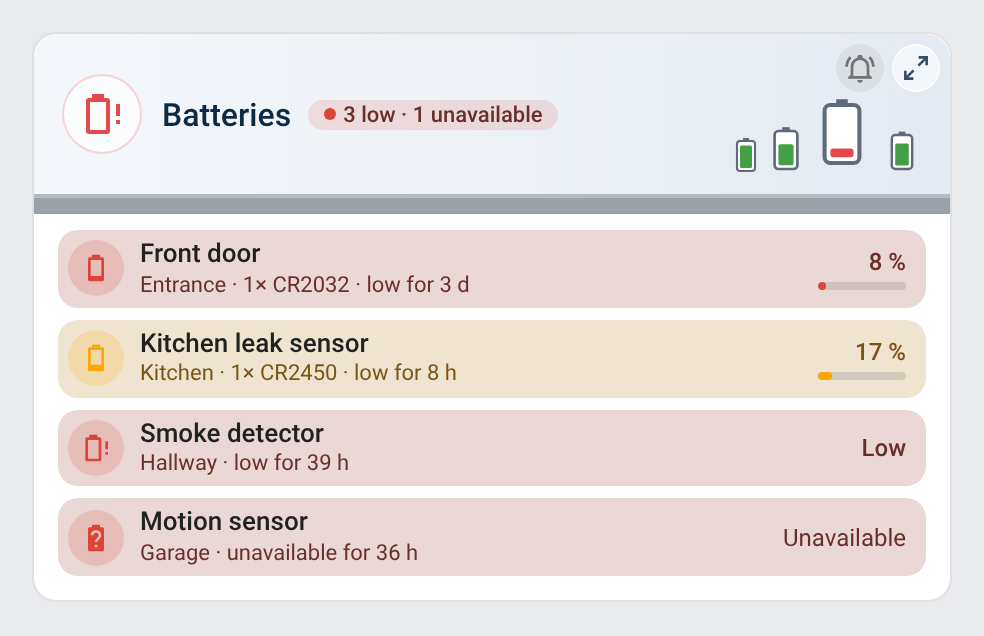 |
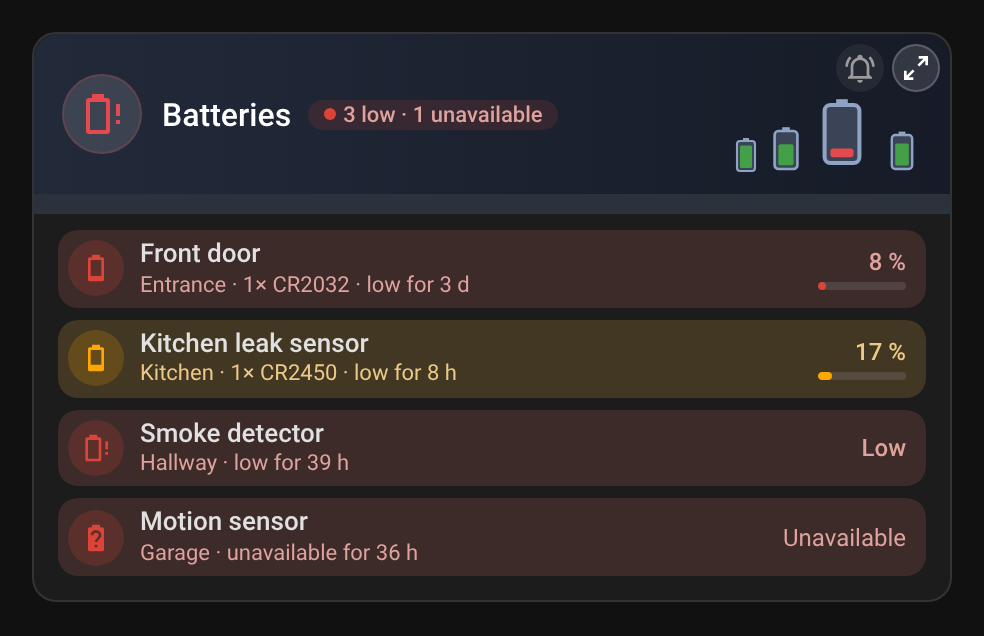 |
| Full screen, by replacement date | Dark |
|---|---|
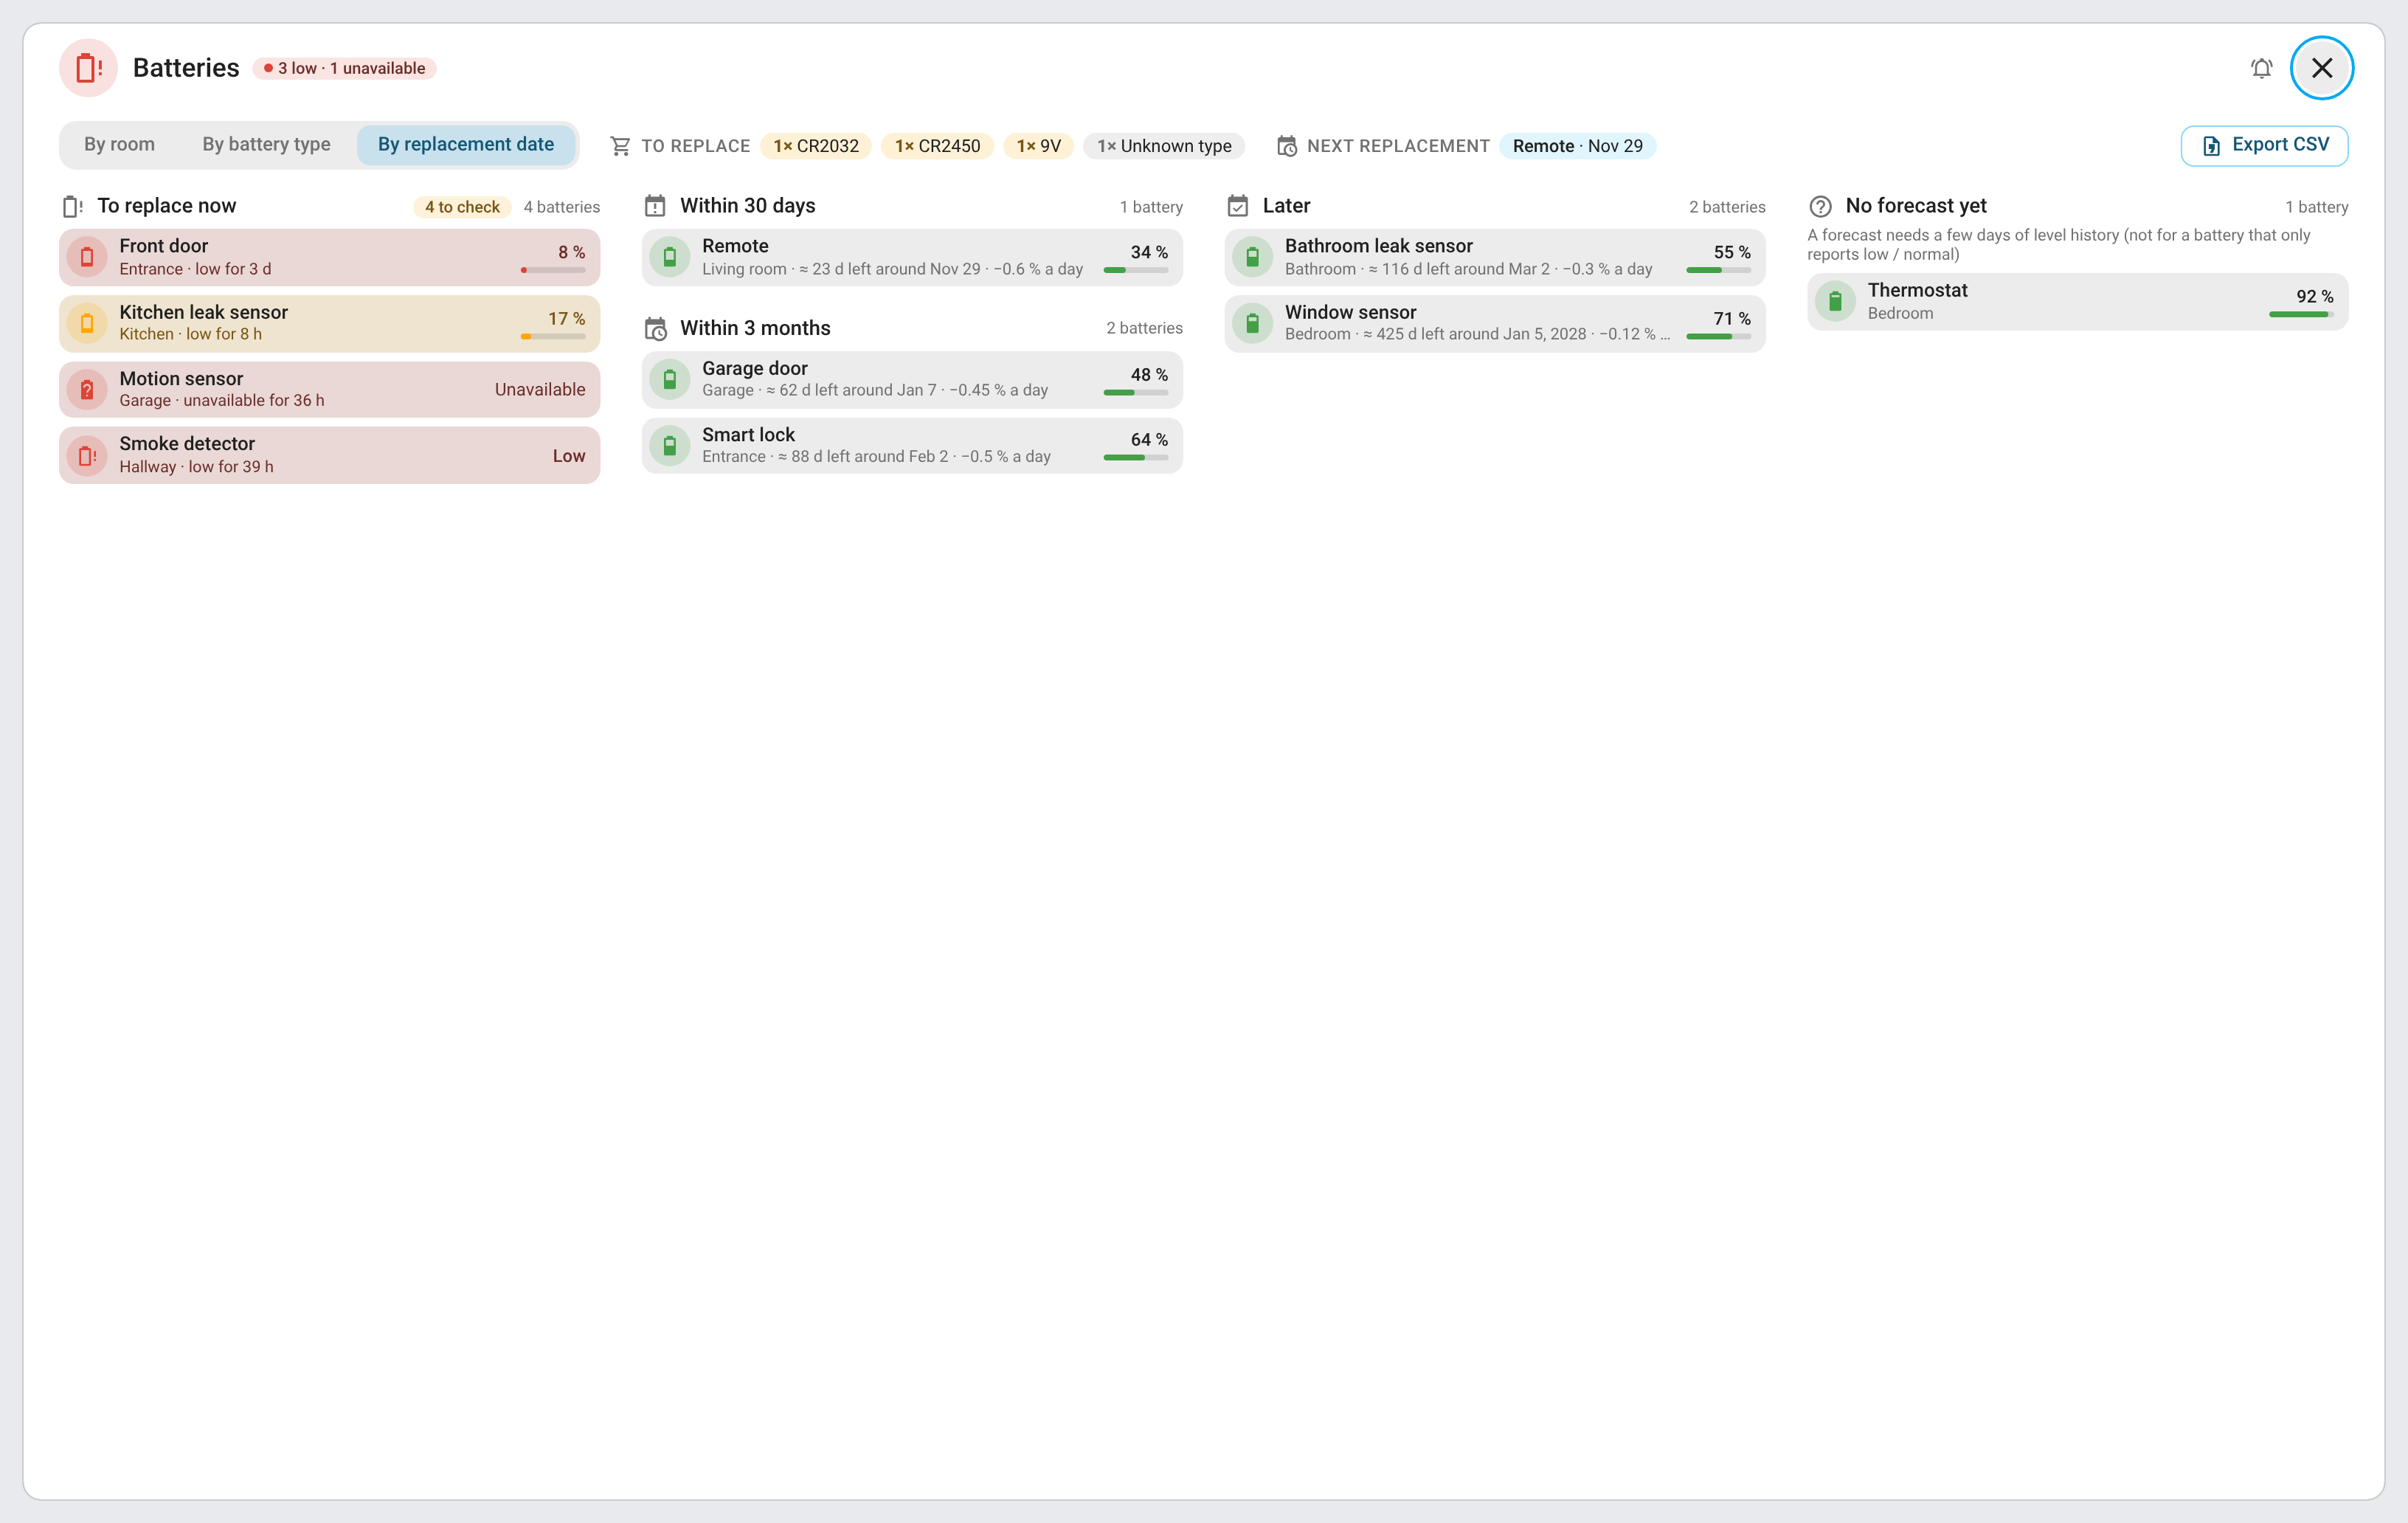 |
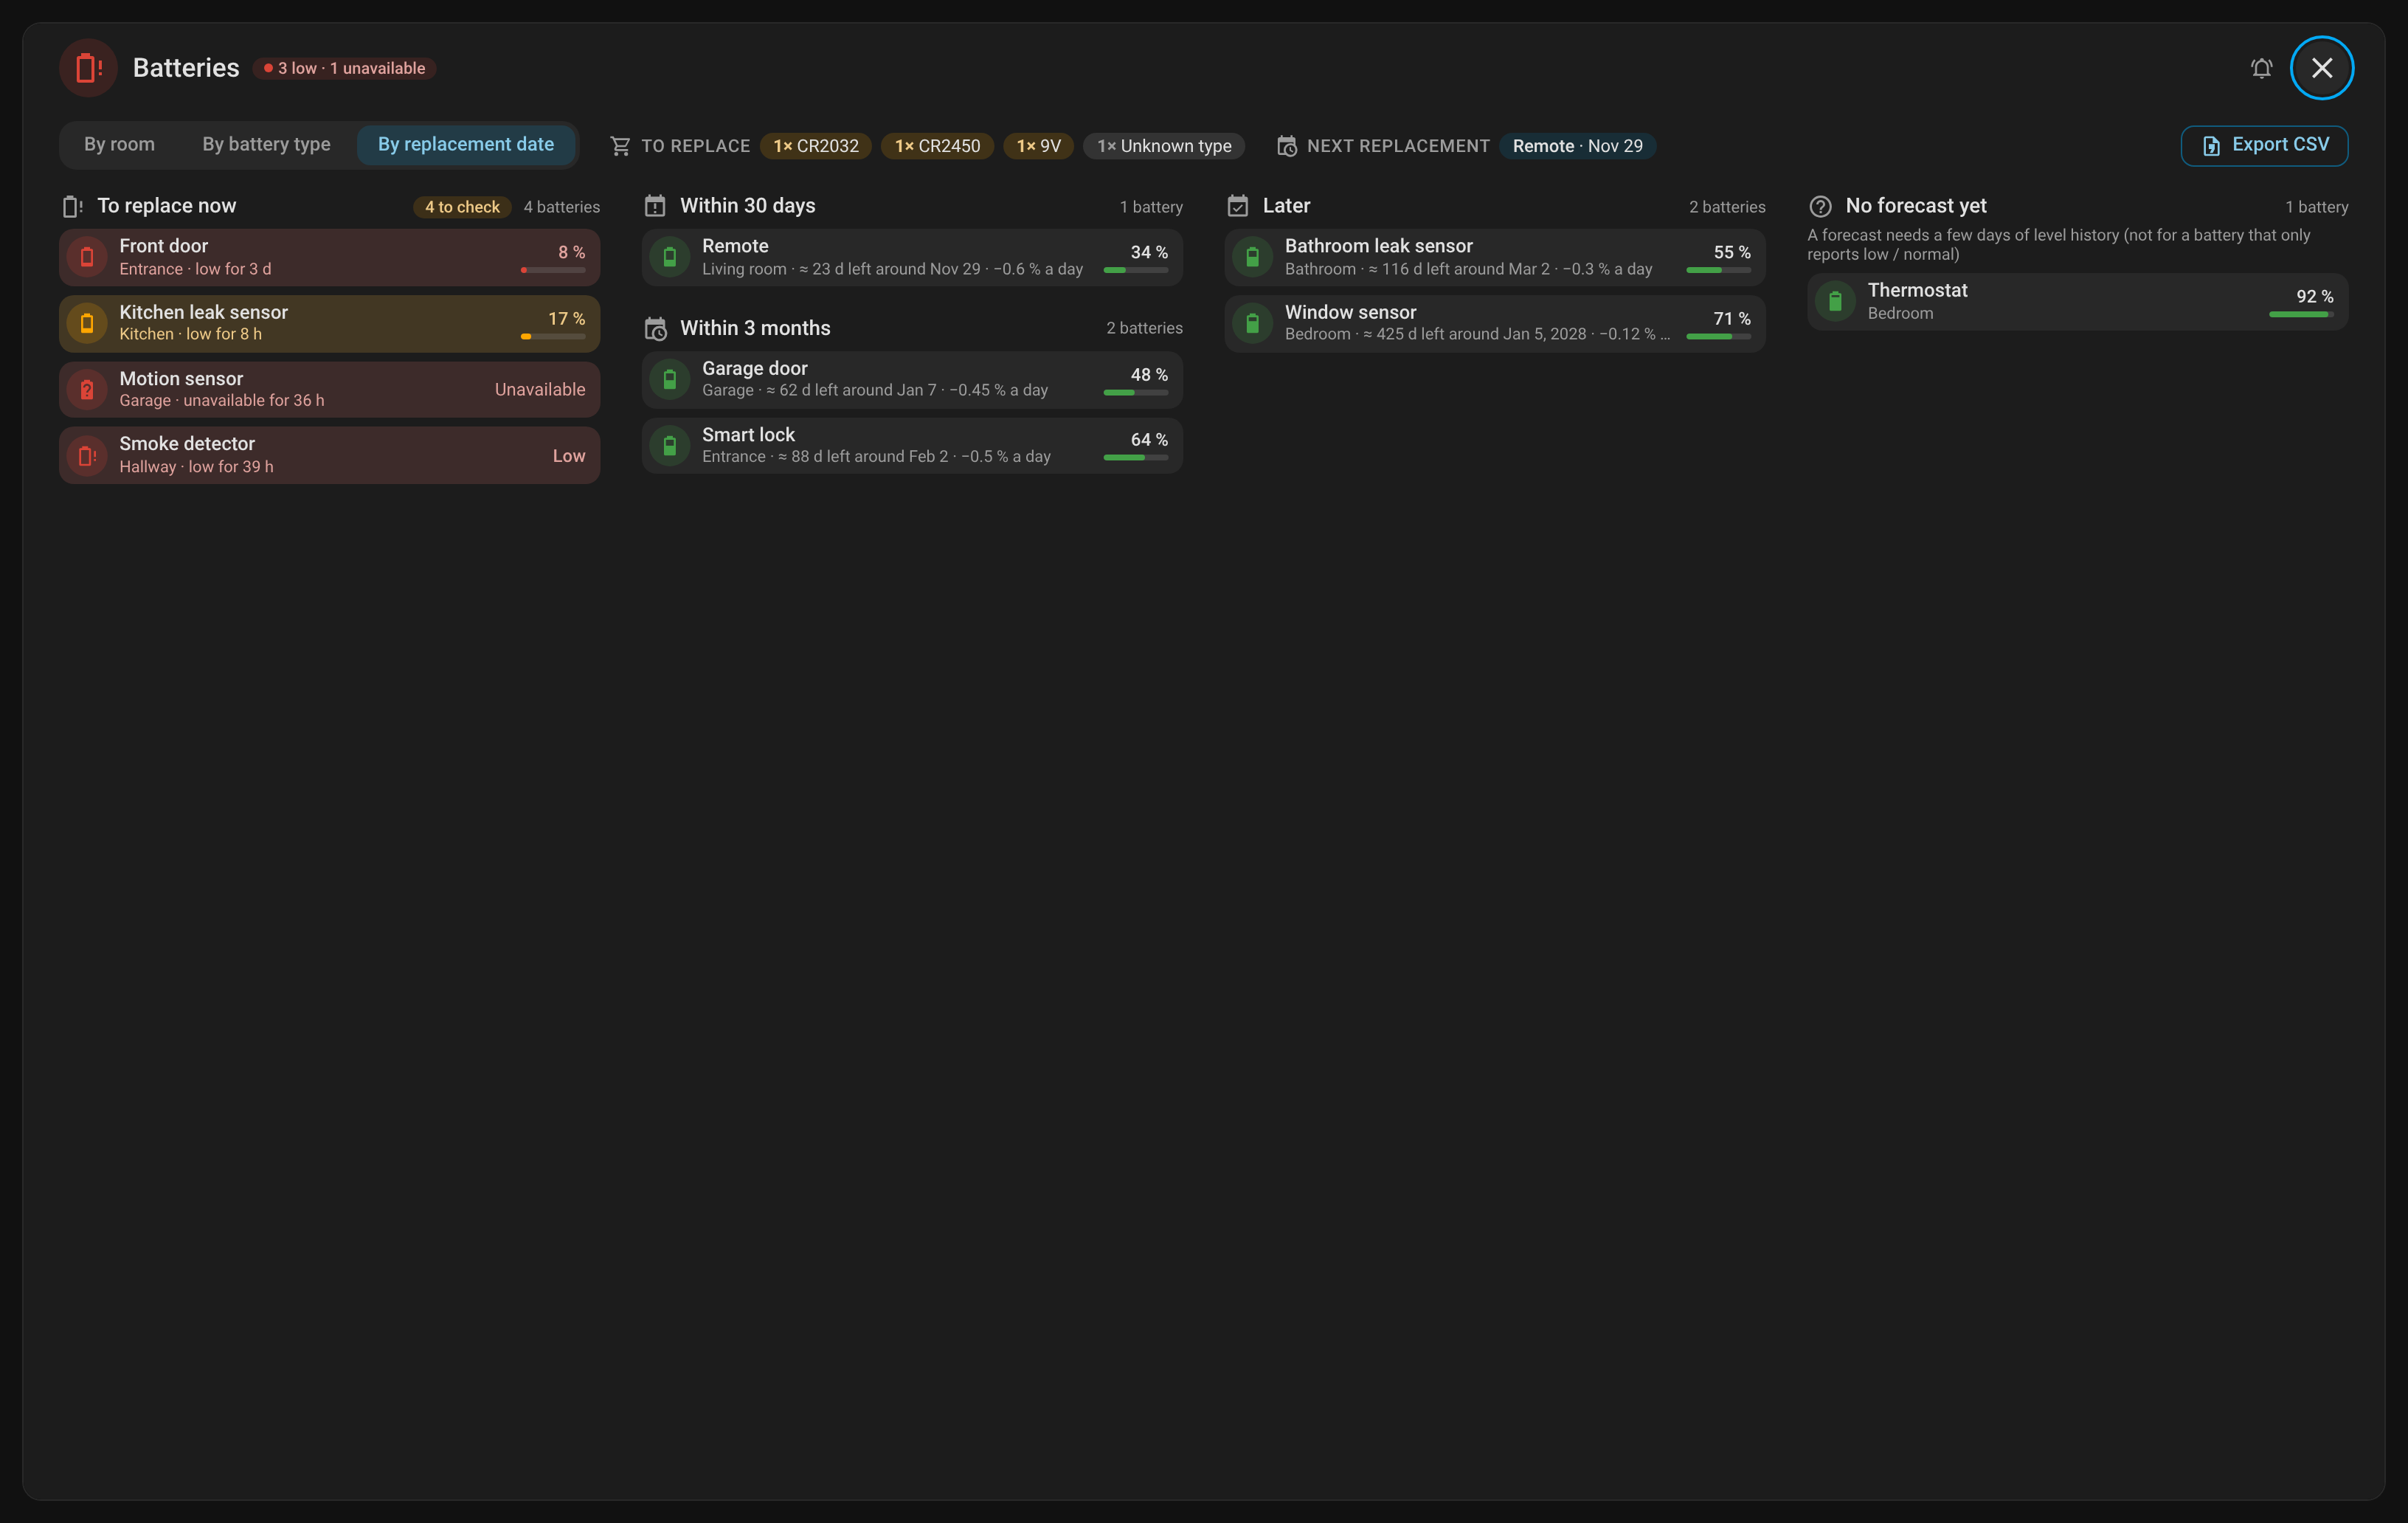 |
| Full screen, by room | Full screen, by battery type |
|---|---|
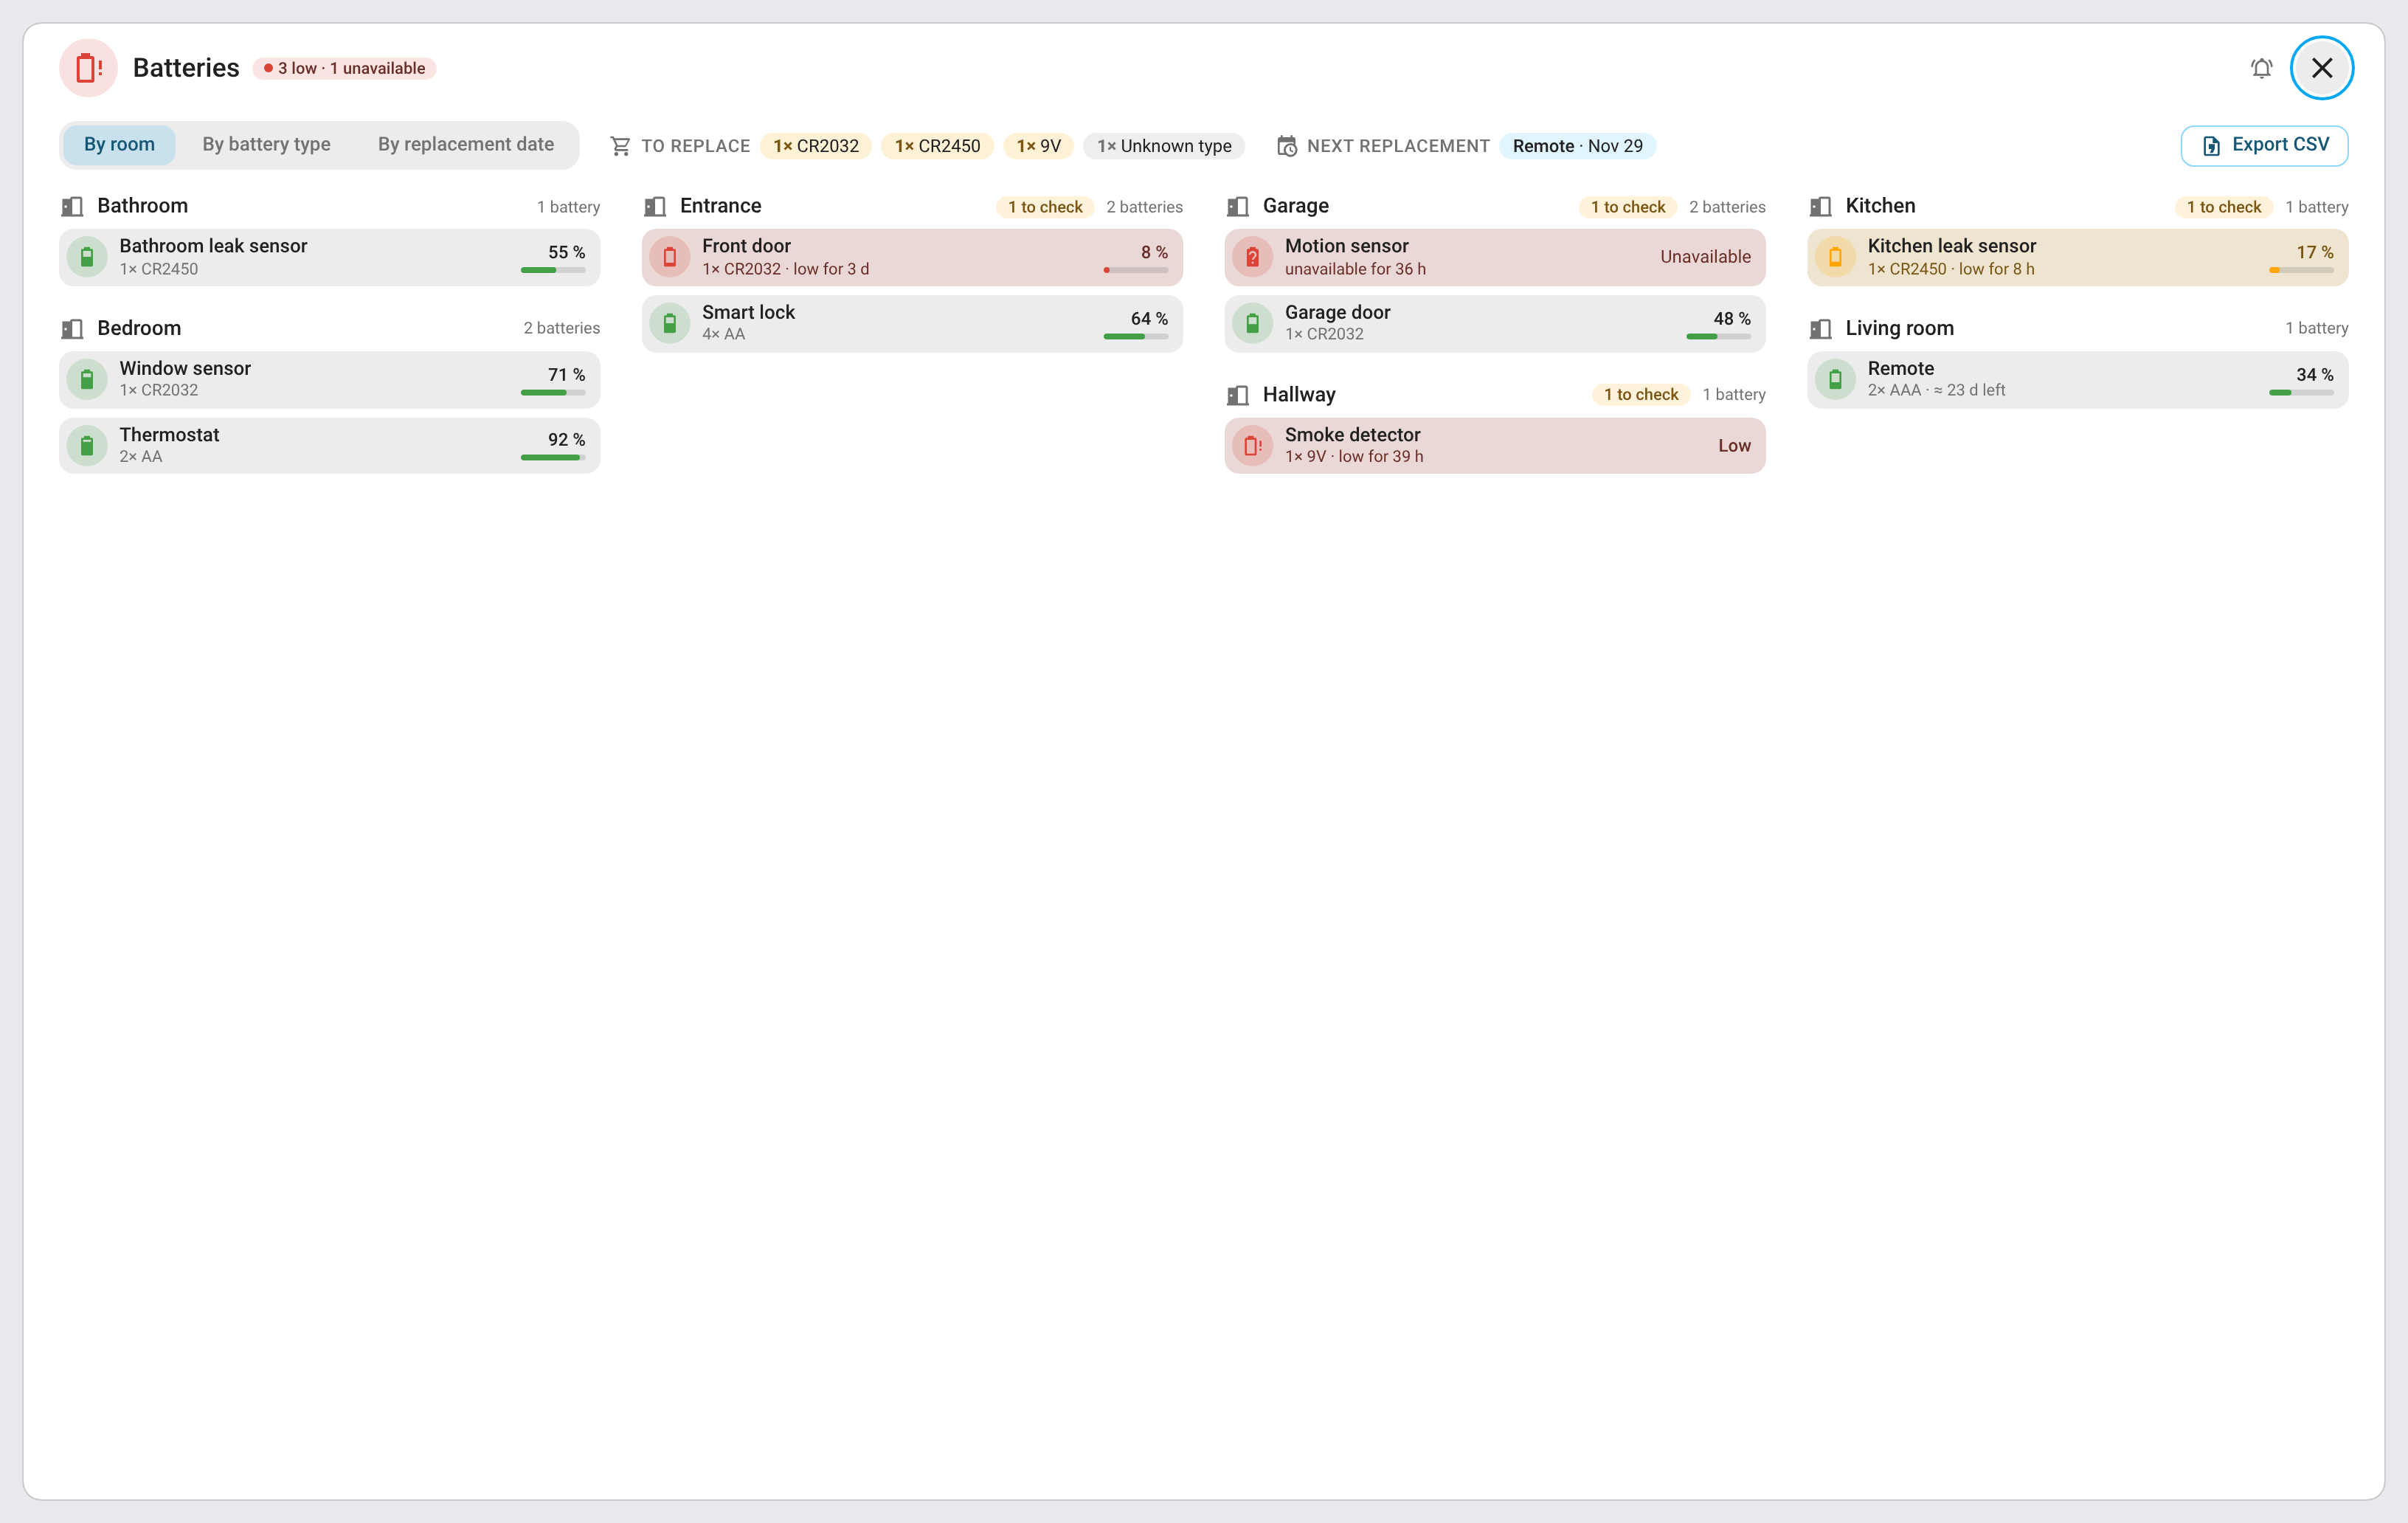 |
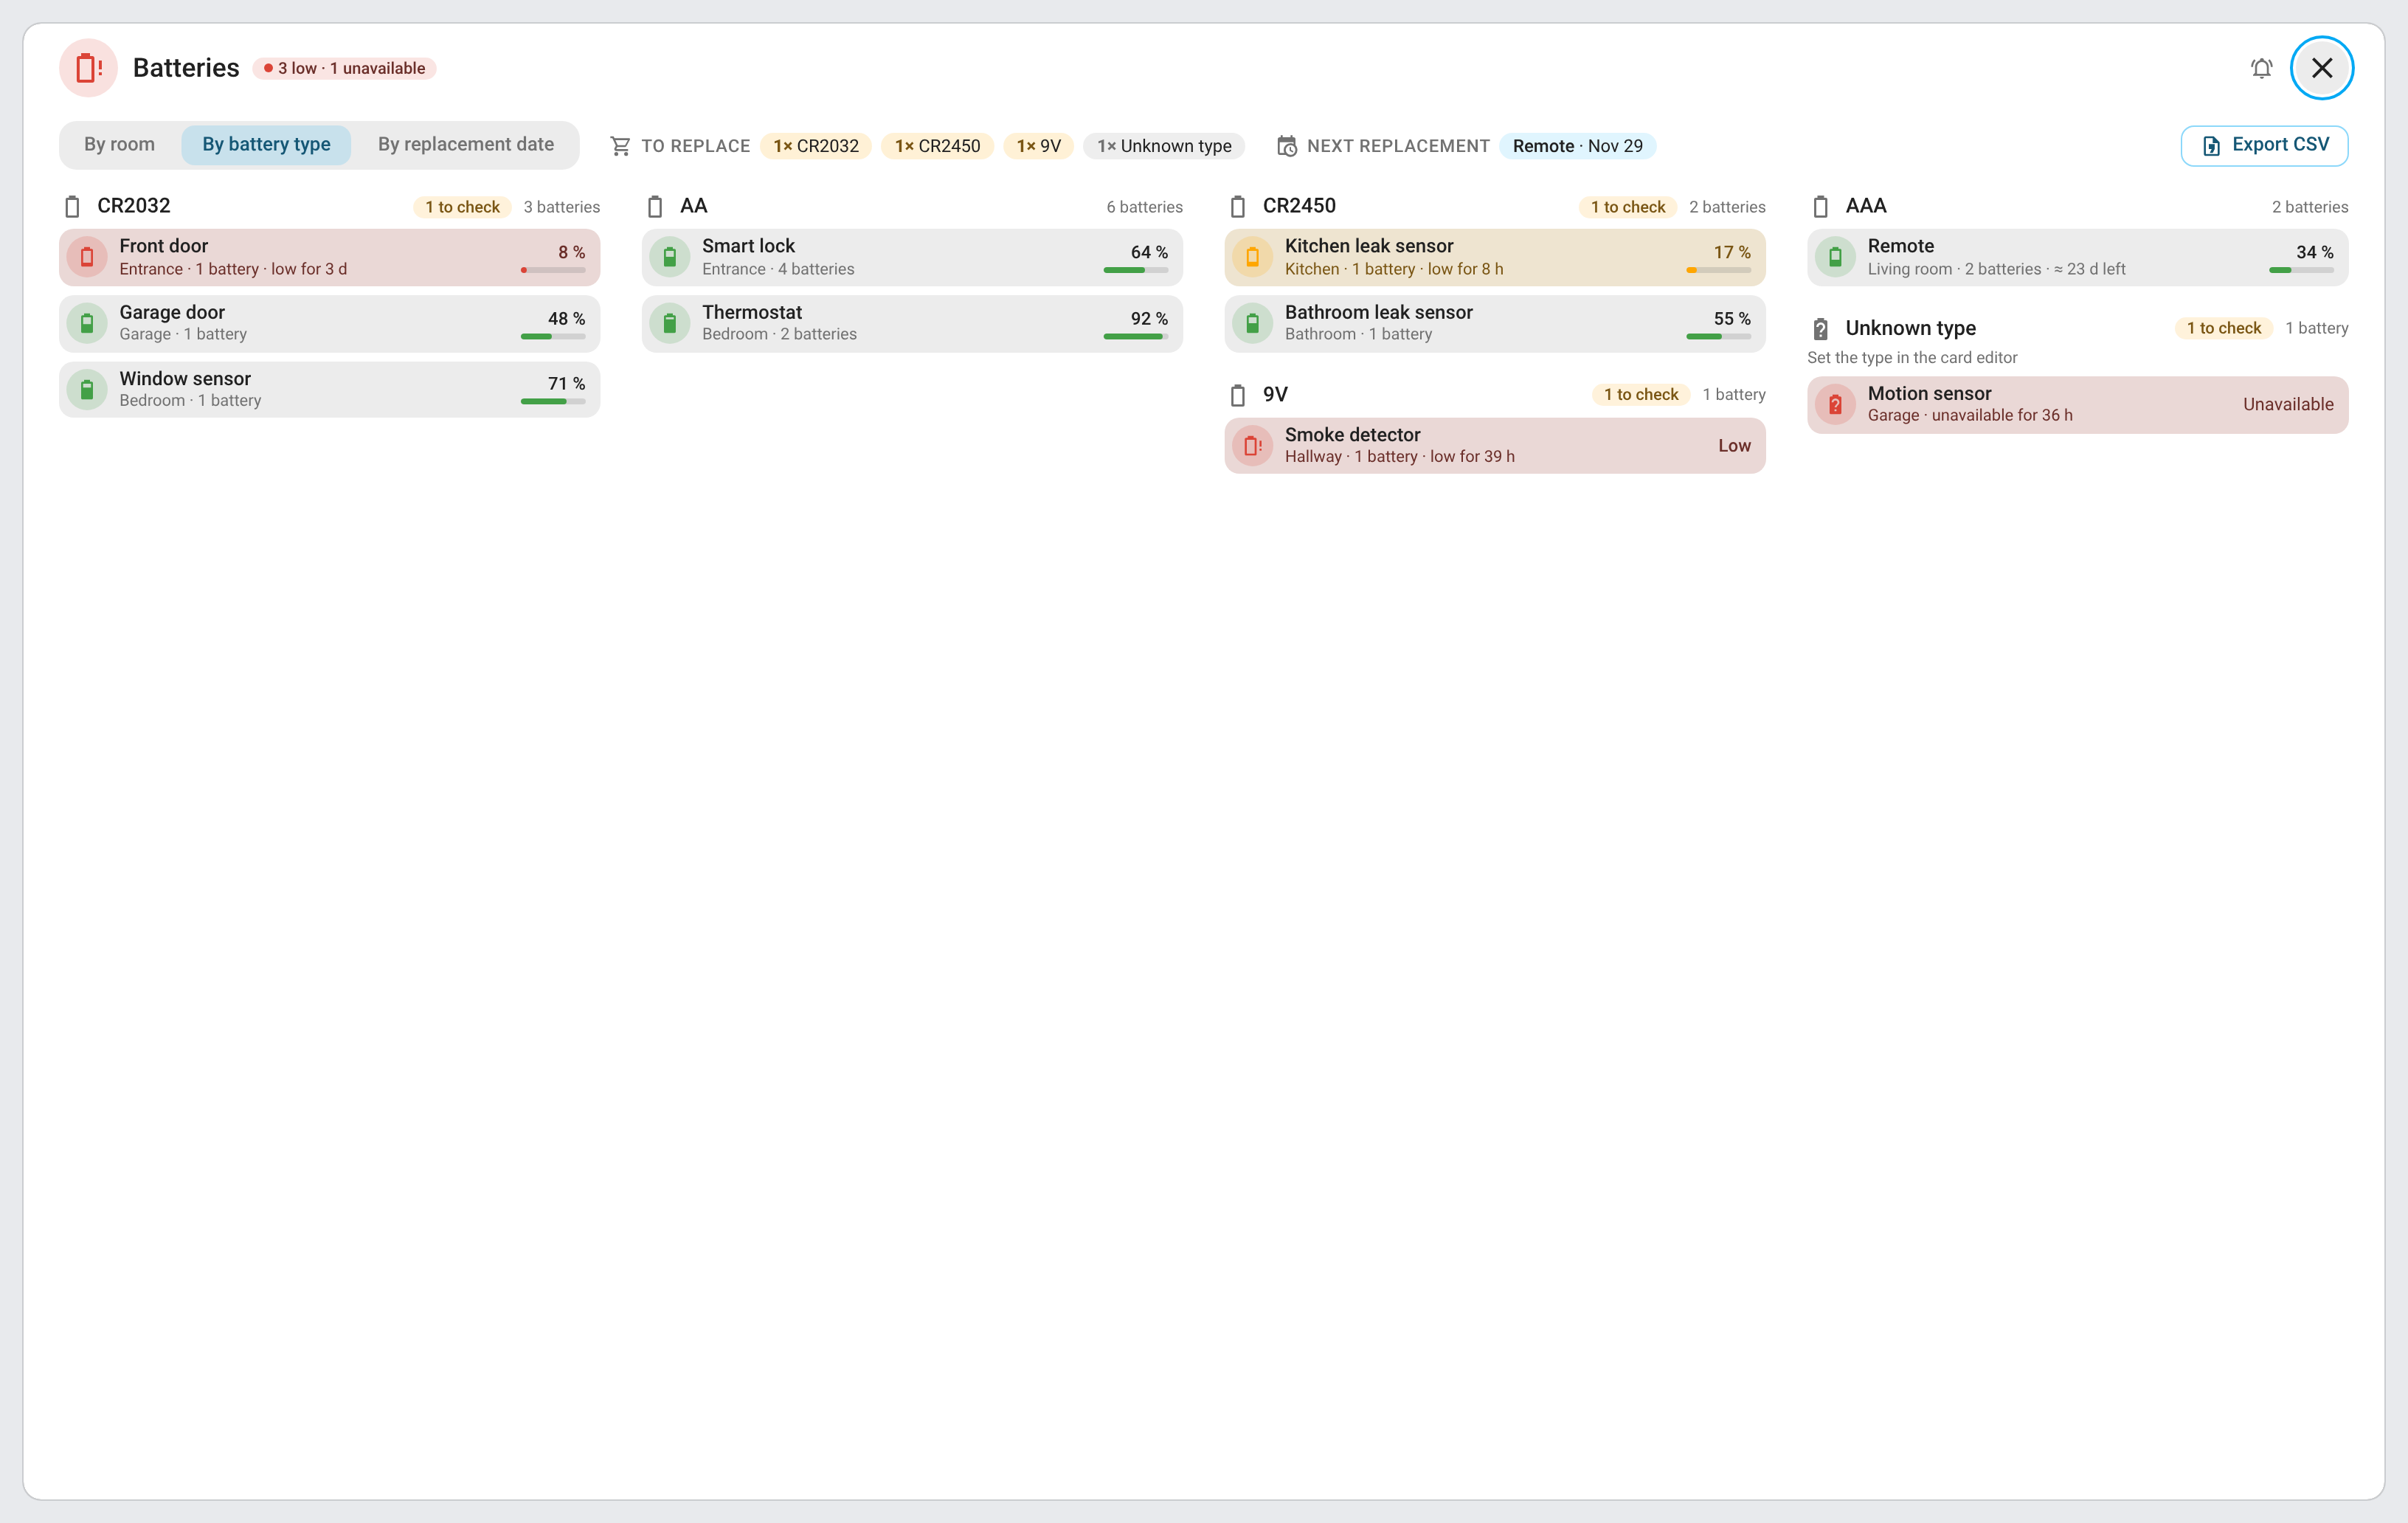 |
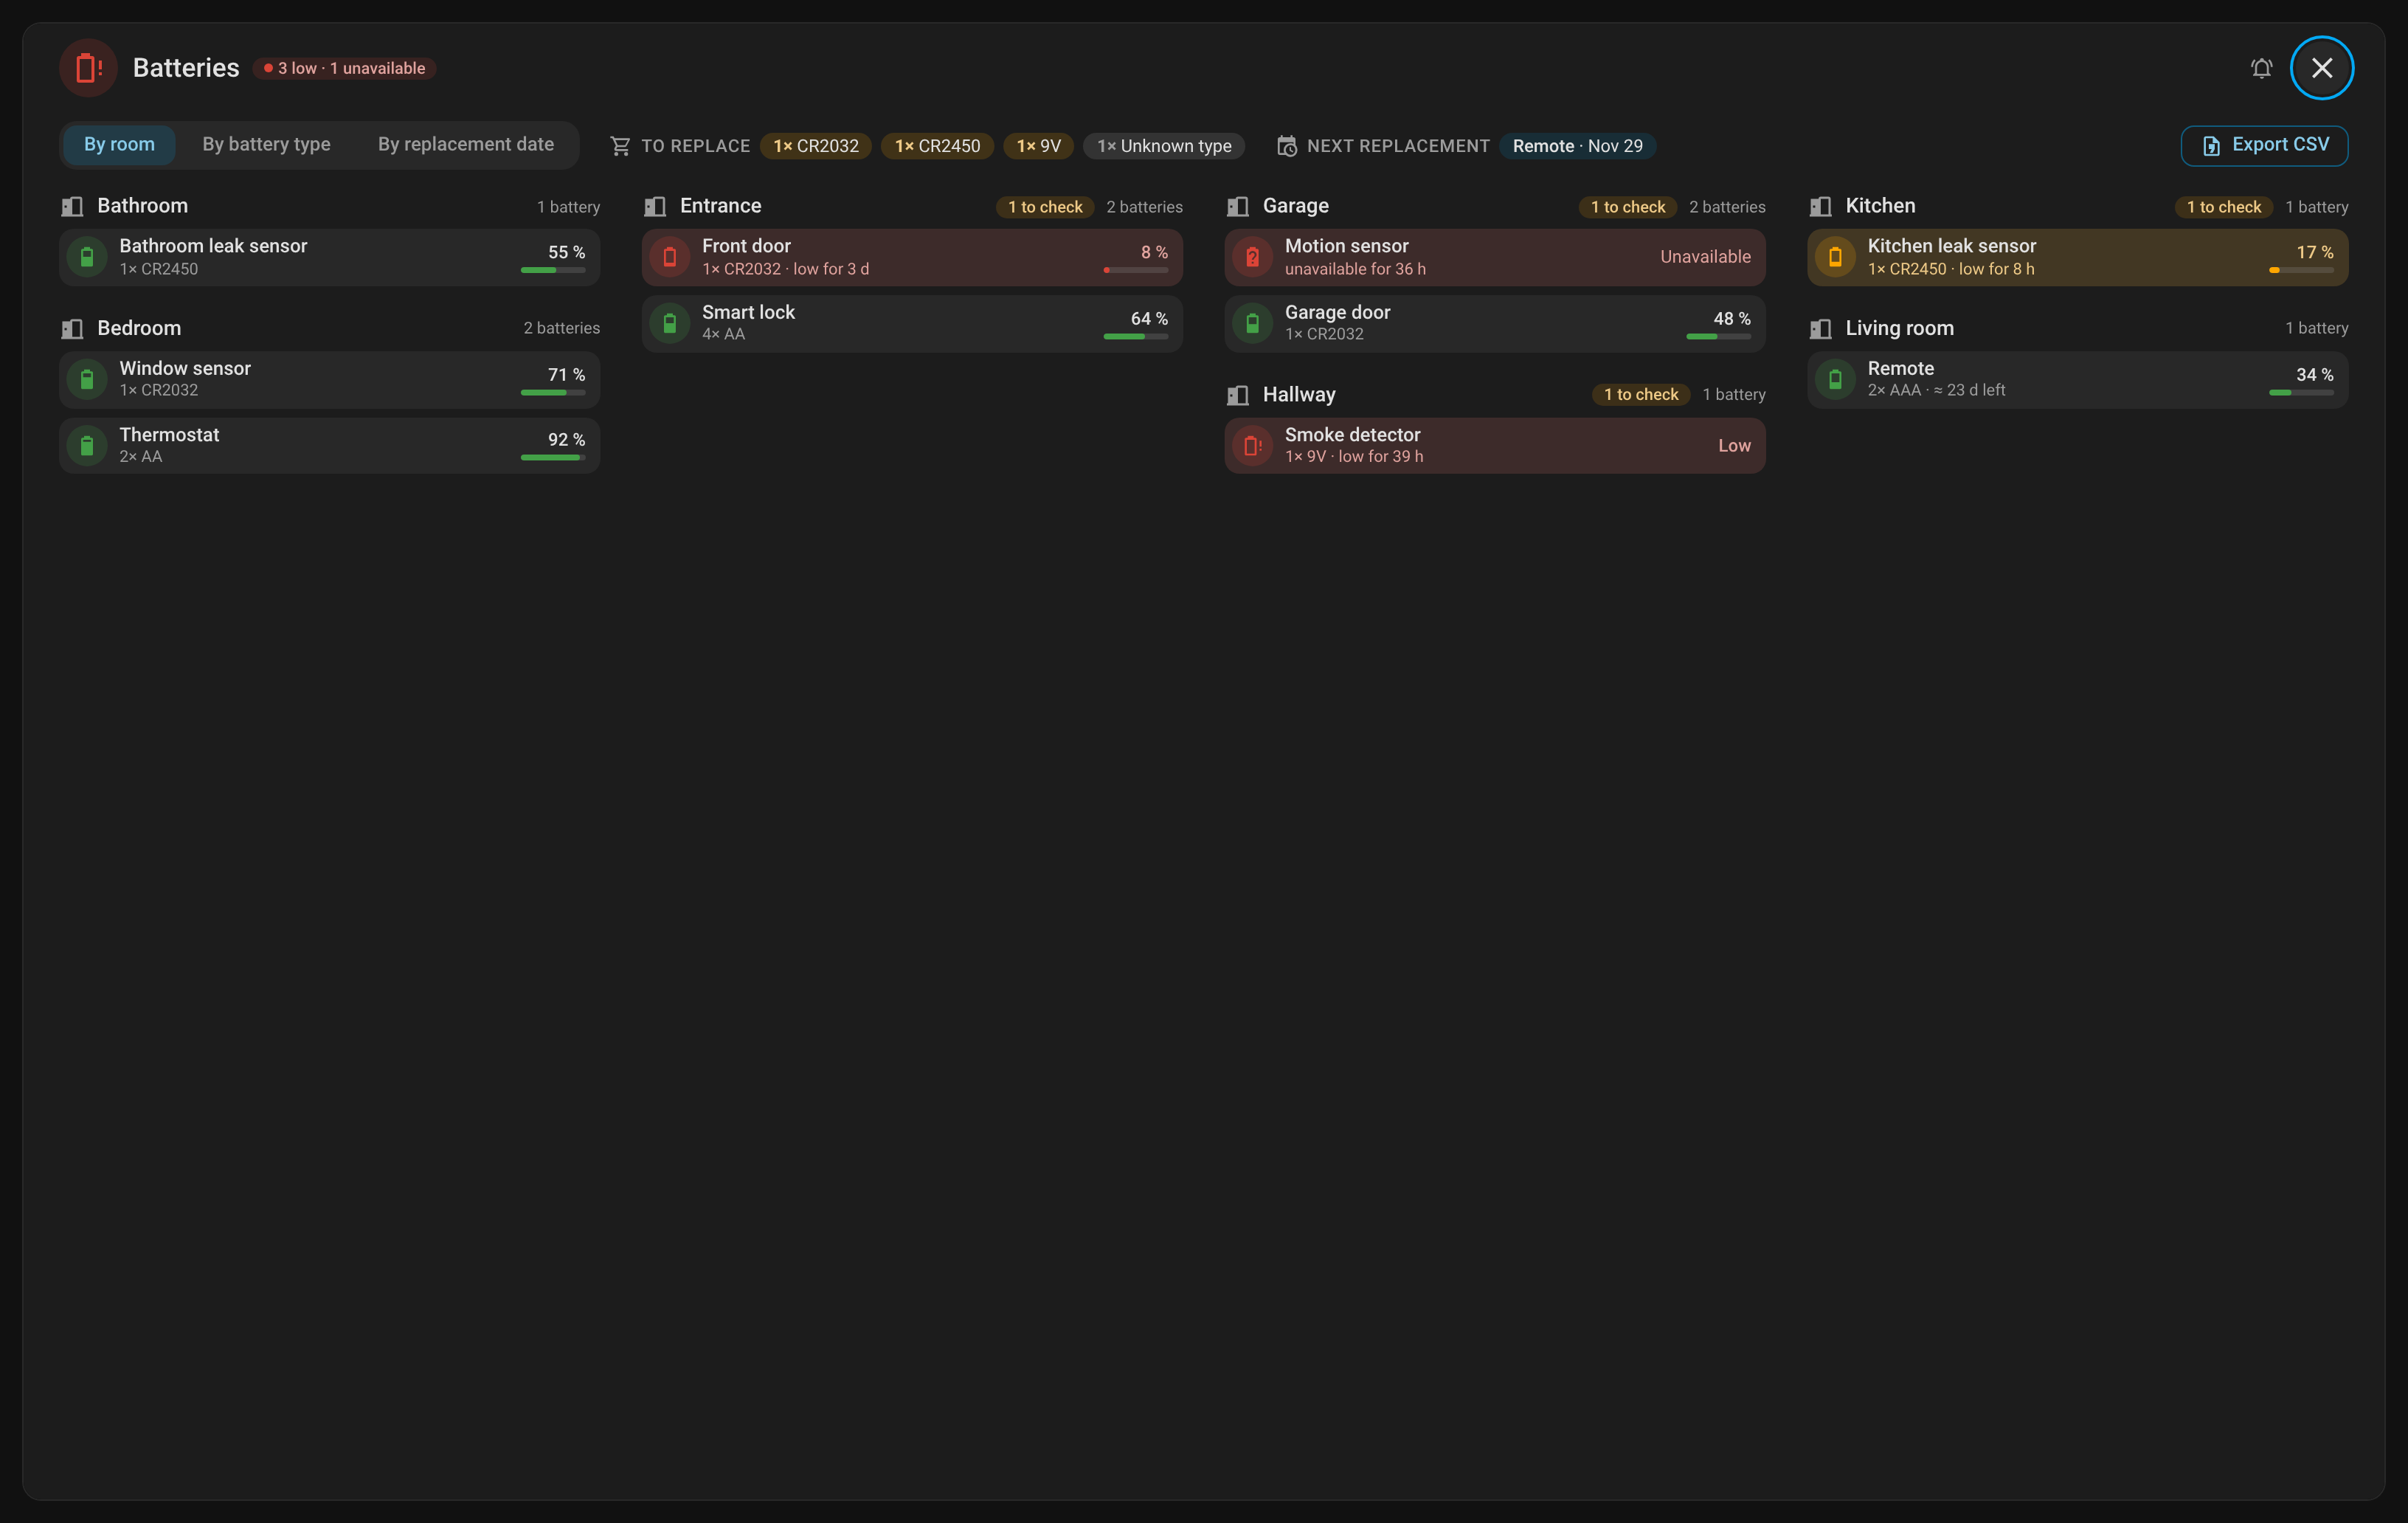 |
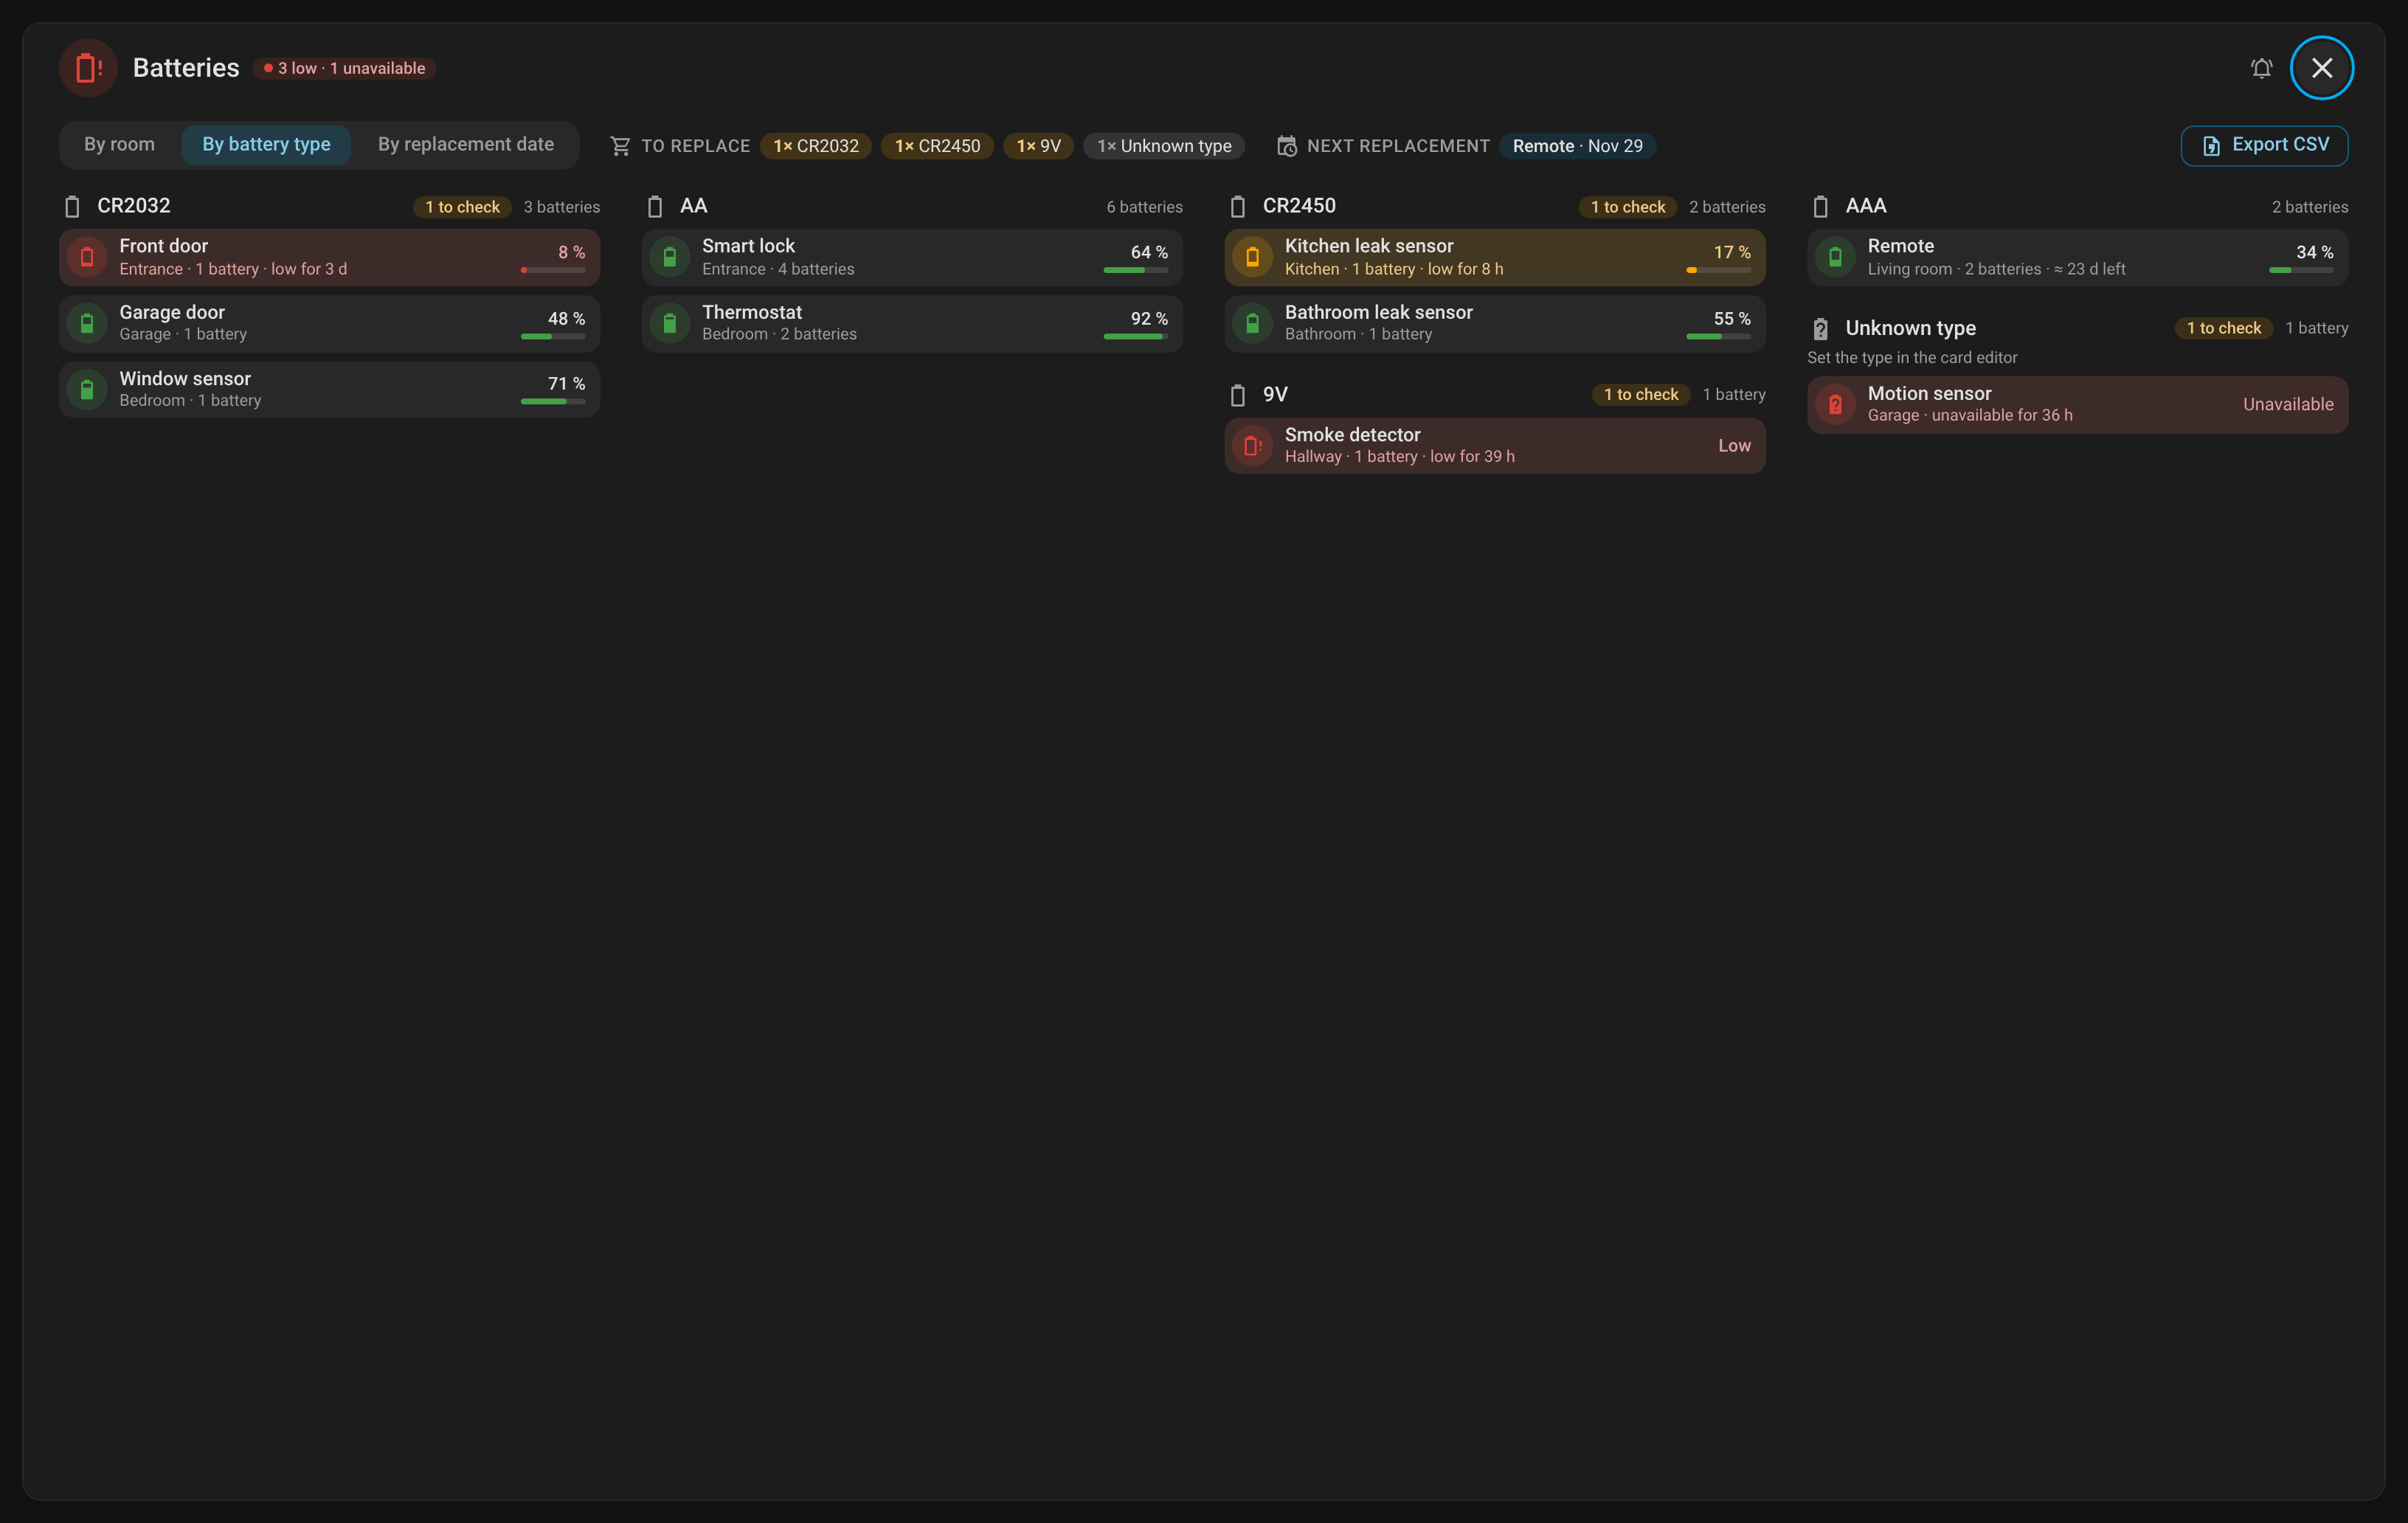 |
| Phone, by room | Phone, by battery type |
|---|---|
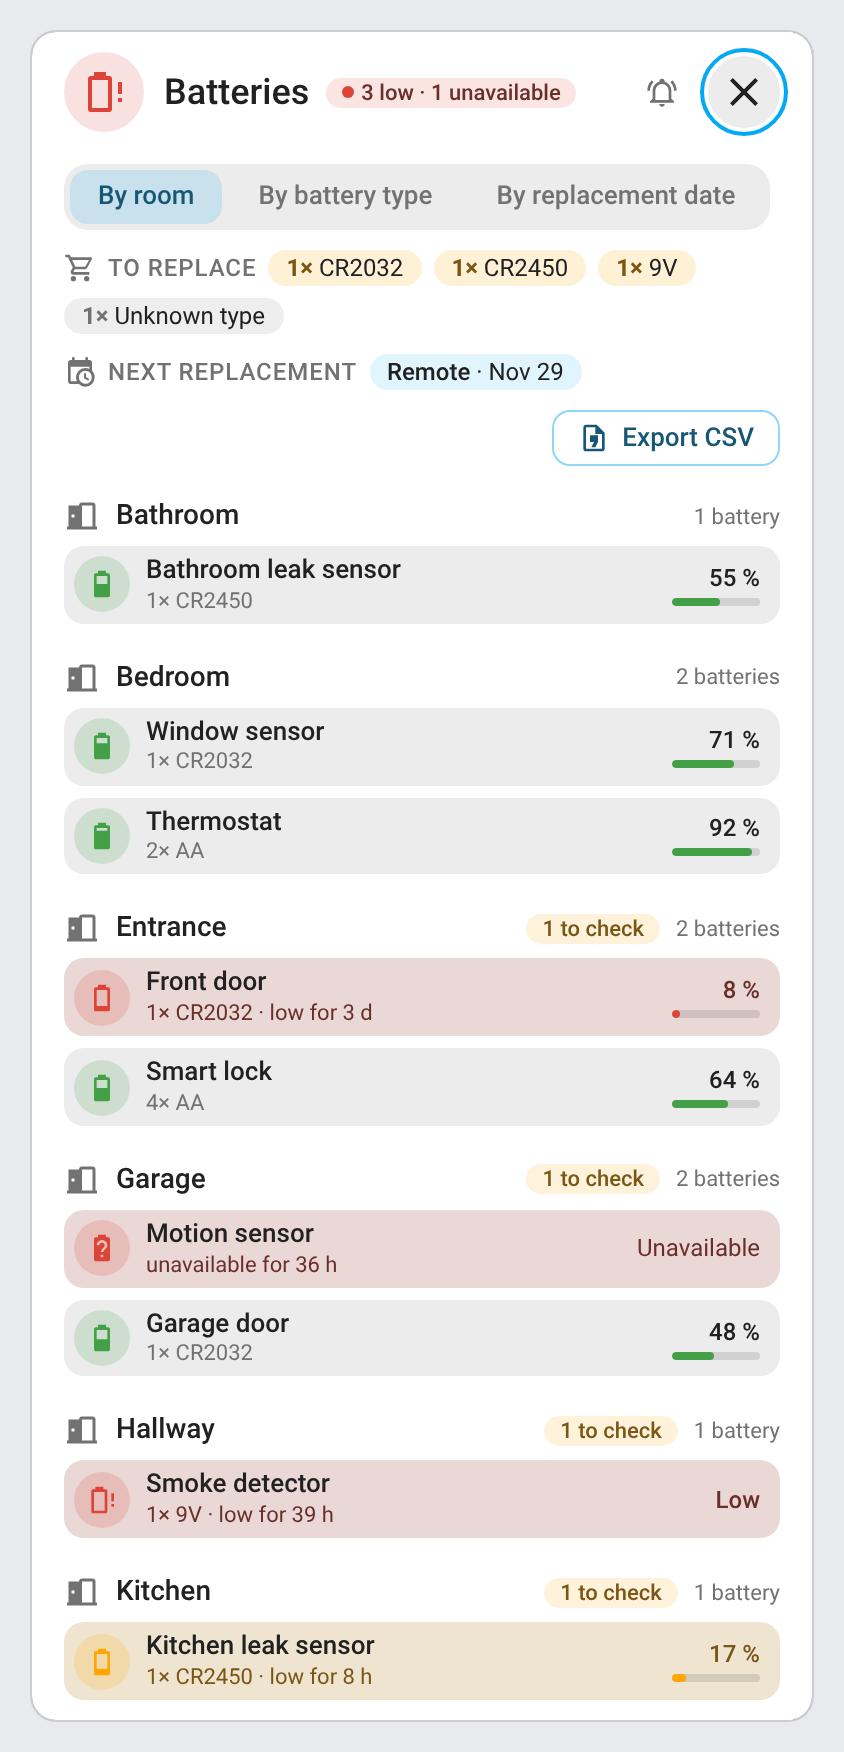 |
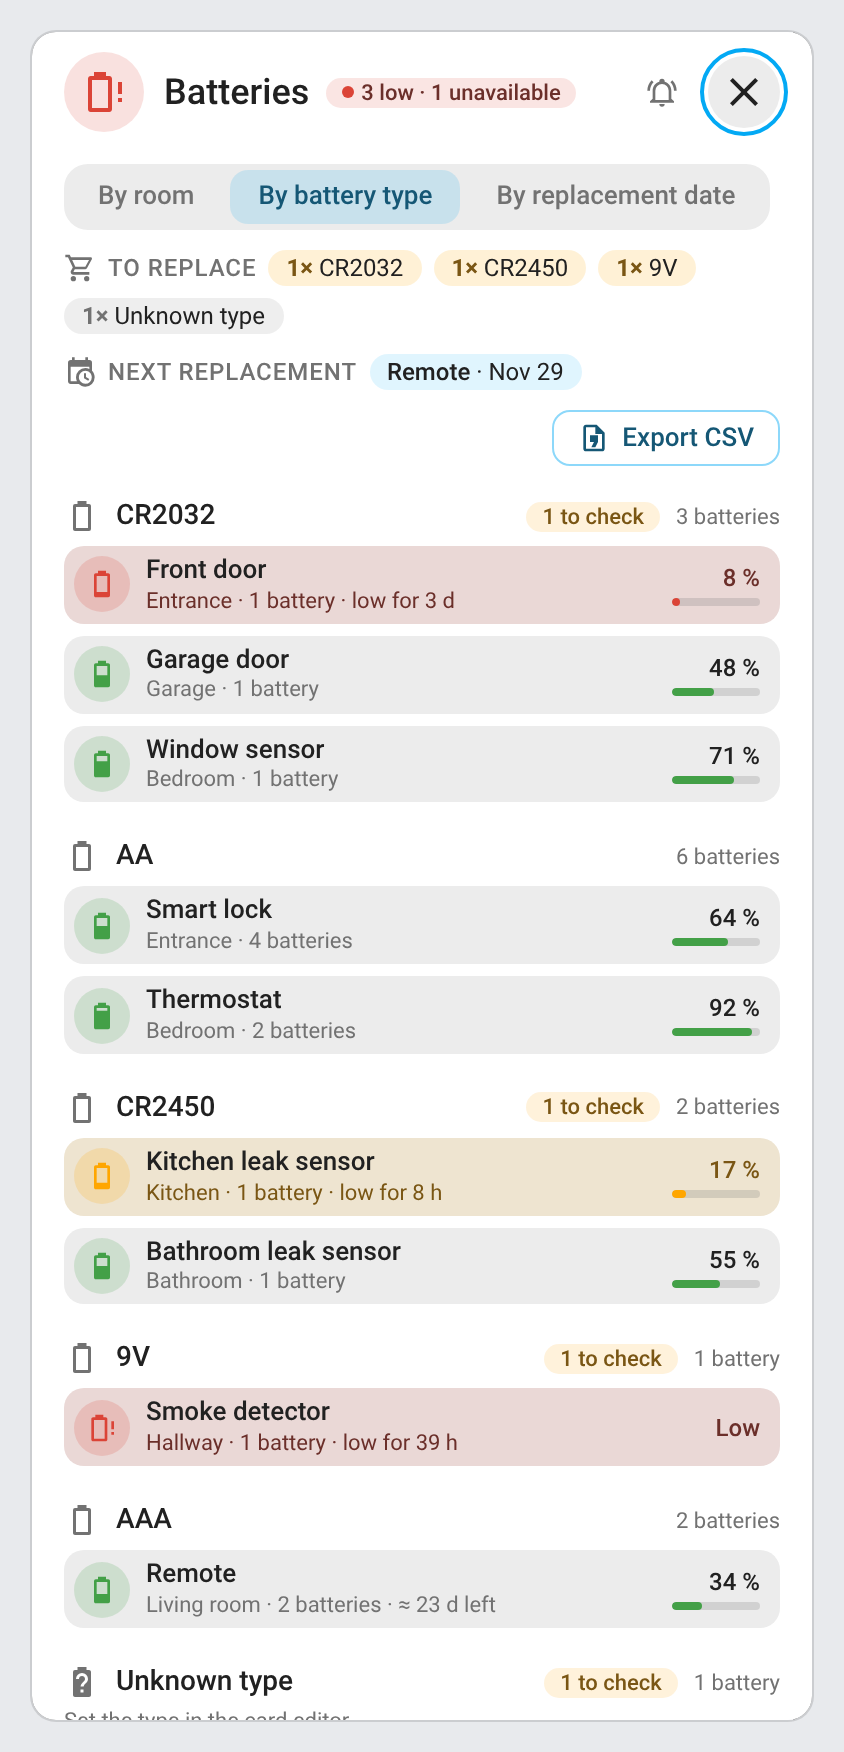 |
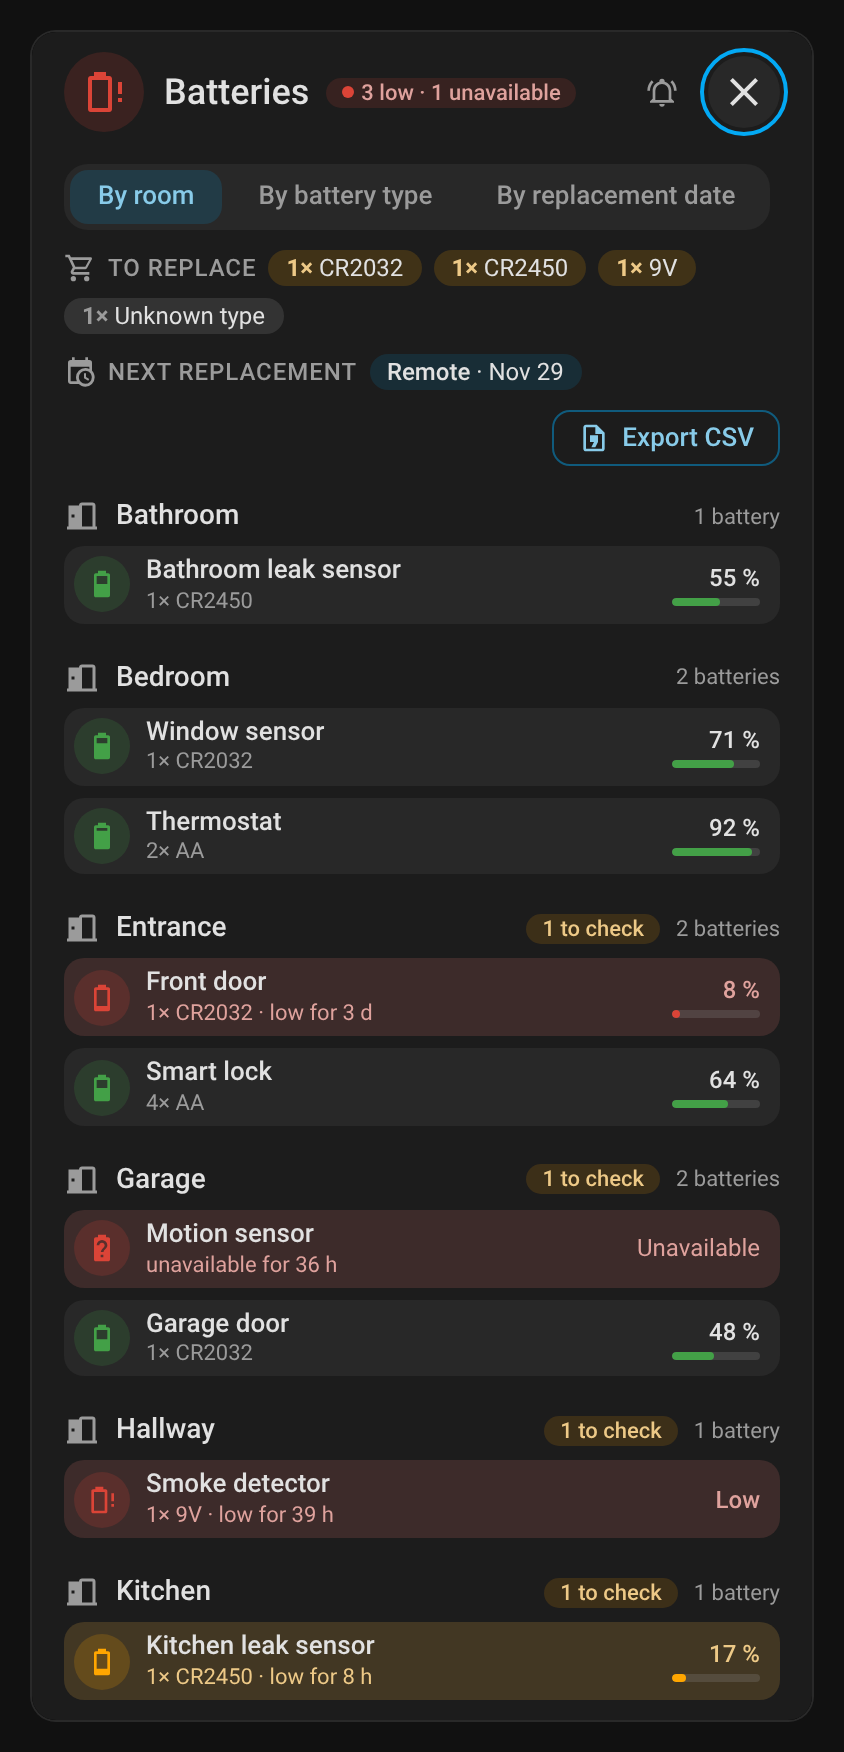 |
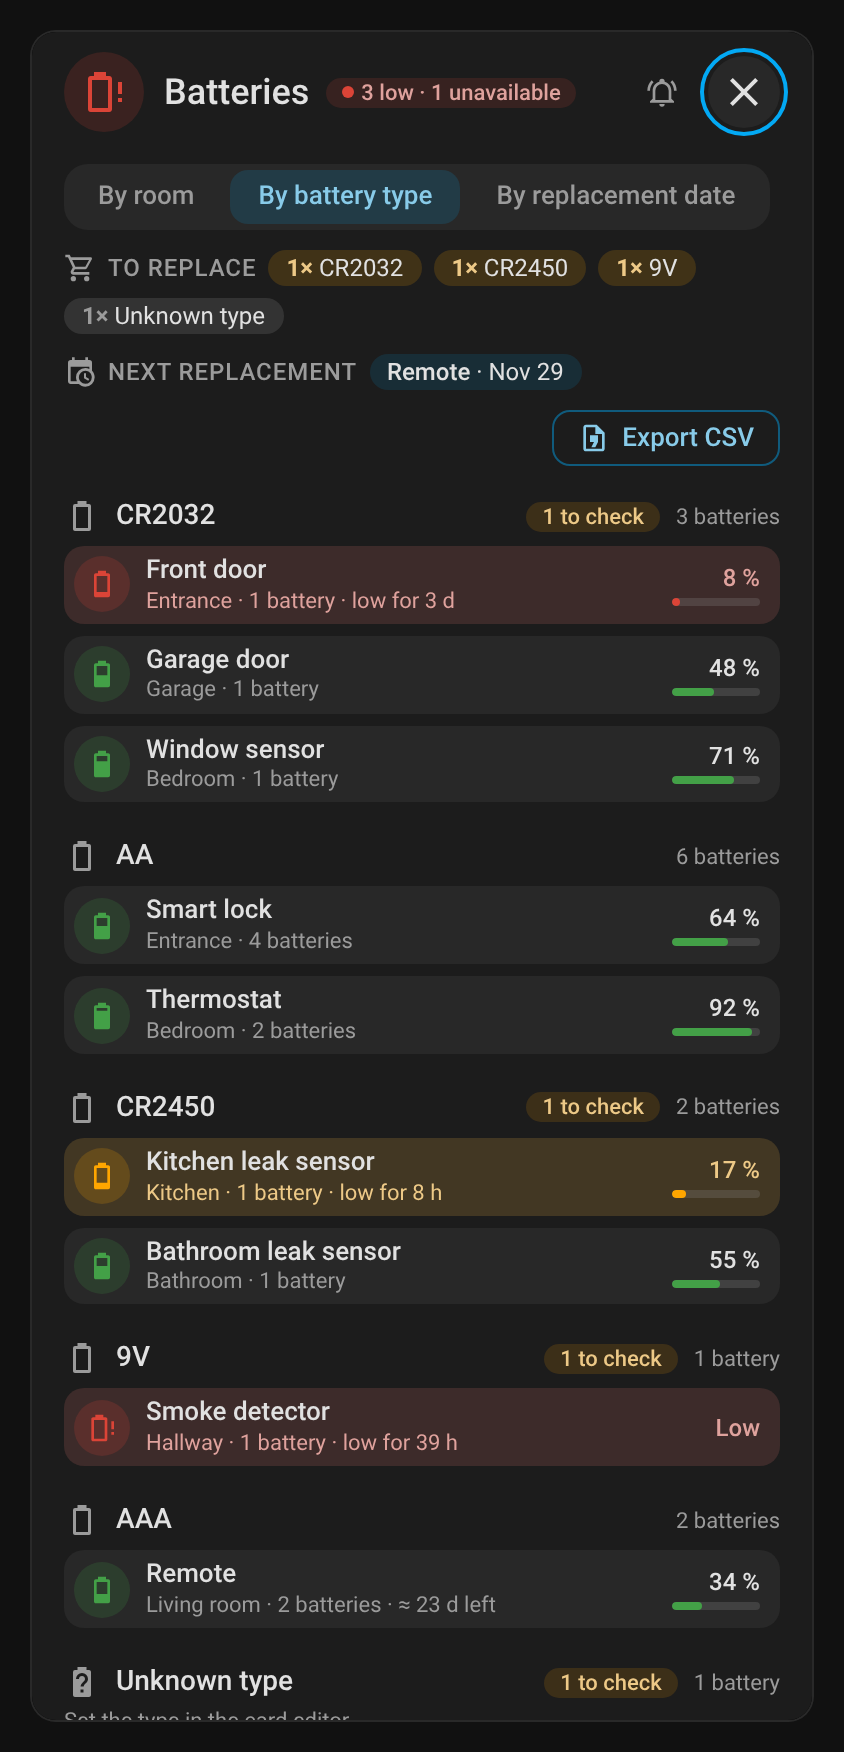 |
Automations
Shows in the panel what the Automation Monitor integration reports, as the Automation Monitor cards do: the automations whose last run failed (error, failed step, failures in a row) and the unavailable entities used by automations, scripts and scenes. Automation Monitor is installed separately; its two sensors are found by the entity registry (renamed ones too). The module has no entities of its own. Clear and Clear all call automation_monitor.reset (a cleared failure is reported again at its next failure), Refresh calls automation_monitor.rebuild_linked_entities. Turned on without Automation Monitor, the tab says so, with a link to add it.
Its settings (Settings → Automations ⚙, or ⚙ in the tab) leave devices and entities out of the tab, its counts and the Status tab, as the card's exclude_devices and exclude_entities options do:
| Option | Default | Description |
|---|---|---|
| Ignored devices | none | Their unavailable linked entities and the failed automations attached to them (by the device Automation Monitor gives, else the entity registry's) are left out. |
| Ignored entities | none | Failed automations and unavailable linked entities whose entity id matches: an entity id, or a pattern with * (any characters) and ? (one character), e.g. automation.test_*; case-insensitive |
While some failures are left out, Clear all clears only the failures listed, one by one.
Automation Monitor cards
Two Lovelace cards for the same integration, served by System Hub (formerly ha-automation-monitor-card): the full Automation Monitor Card (custom:system-hub-card (module: automations)) and the compact Automation Monitor Mini Card (custom:system-hub-mini-card (module: automations)). They work with or without the Automations module: the sensors of Automation Monitor are found by the entity registry, whatever their language or entity ids.
- Overall status: all good, the number of problems, or "Sensor unavailable" when a sensor of the integration cannot be read
- Counters of failed automations and unavailable linked entities; a list is only shown when it has something to show
- Failed automations: name, time of the last failure, error message, failed step and consecutive failures, with Trace, Edit and Clear (or Clear all, with confirmation:
automation_monitor.reset) - Unavailable linked entities: name, entity id, how long it has been unavailable and the automations, scripts and scenes that use it (click one to open its editor)
- Refresh in the header of both cards (
automation_monitor.rebuild_linked_entities); the mini card's detail button switches to the full card and back - Lists folded by default (click a section title), cut to
max_itemswith a "Show more" button; the action buttons are for administrators only - Visual editor for both cards
type: custom:system-hub-card
module: automations
| Option | Card | Default | Description |
|---|---|---|---|
title |
both | Automation Monitor |
Card title |
show_title |
both | true |
Show the title in the header (e.g. false under a section heading of your own) |
illustration |
both | true |
The illustrated header with the robot (see Lovelace cards); false for the classic header |
illustration_theme |
both | auto |
day or night picture; auto follows the Home Assistant theme |
show_subtitle |
both | true |
Show the subtitle under the title |
show_failed |
both | true |
Failed automations (counter and list) |
show_linked |
both | true |
Unavailable linked entities (counter and list) |
expand_failed |
both | false |
Failed automations expanded when the card loads |
expand_linked |
both | false |
Unavailable linked entities expanded when the card loads |
show_details |
both | true |
Error message of each failed automation |
show_controls |
both | true |
Clear and Clear all buttons (administrators only, like the Trace and Edit links and the Refresh button) |
max_items |
both | 5 |
Items shown per list before the "Show more" button |
hide_when_ok |
both | false |
Hide the card while all is good. Never hidden while a sensor can't be read, nor while the dashboard is being edited |
zoom |
mini | true |
Detail button at the top right: switches to the full card and back (false removes it). The full card's options (expand_failed, expand_linked, show_details, show_controls, max_items) are set on the mini card too, in YAML or in its visual editor, and apply to that full view |
exclude_devices |
both | — | Devices to ignore (ids or names): their unavailable linked entities and failed automations are left out of the lists, counters and status |
exclude_entities |
both | — | Entities to ignore: entity ids or patterns with * and ? (automation.test_*), case-insensitive |
failed_entity |
both | Auto | Failed automations sensor, only needed if it can't be found automatically |
linked_entity |
both | Auto | Unavailable linked entities sensor, only needed if it can't be found automatically |
language |
both | Auto | Force a language (en, fr, de…); auto-detected from Home Assistant |
| Automation Monitor Card | Light | Dark |
|---|---|---|
| Lists folded | |
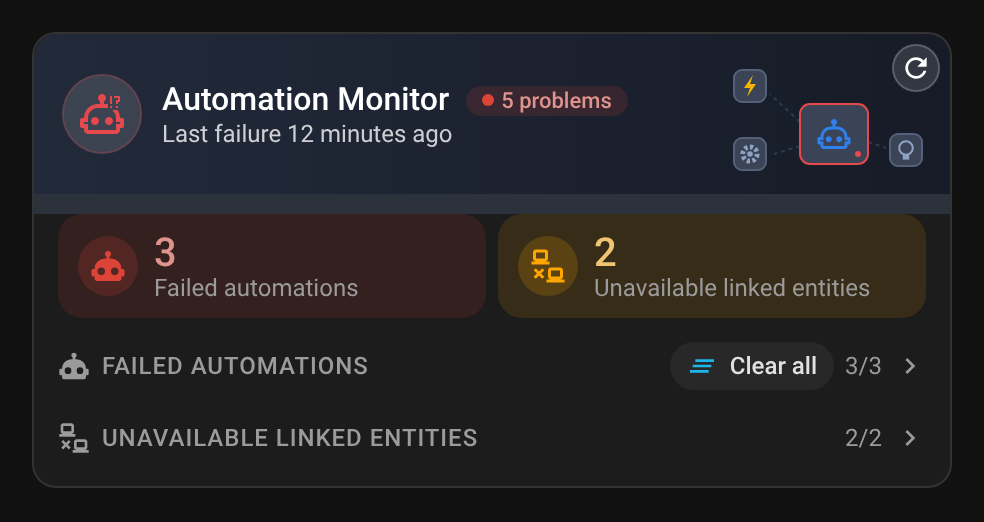 |
| Lists unfolded | 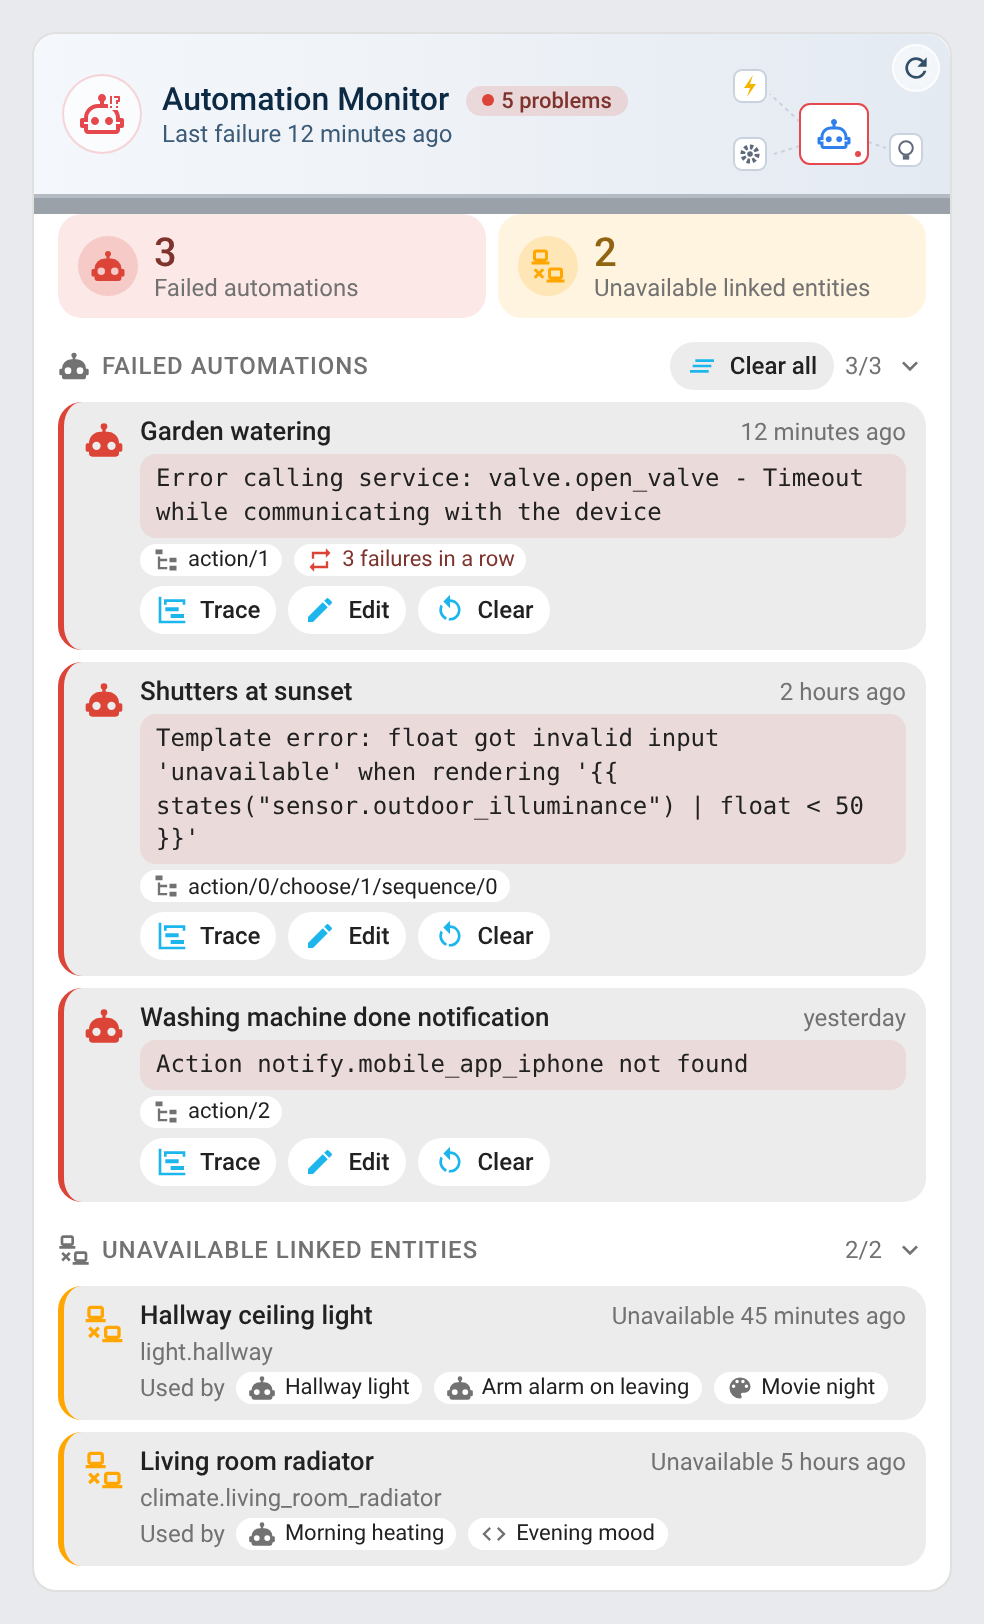 |
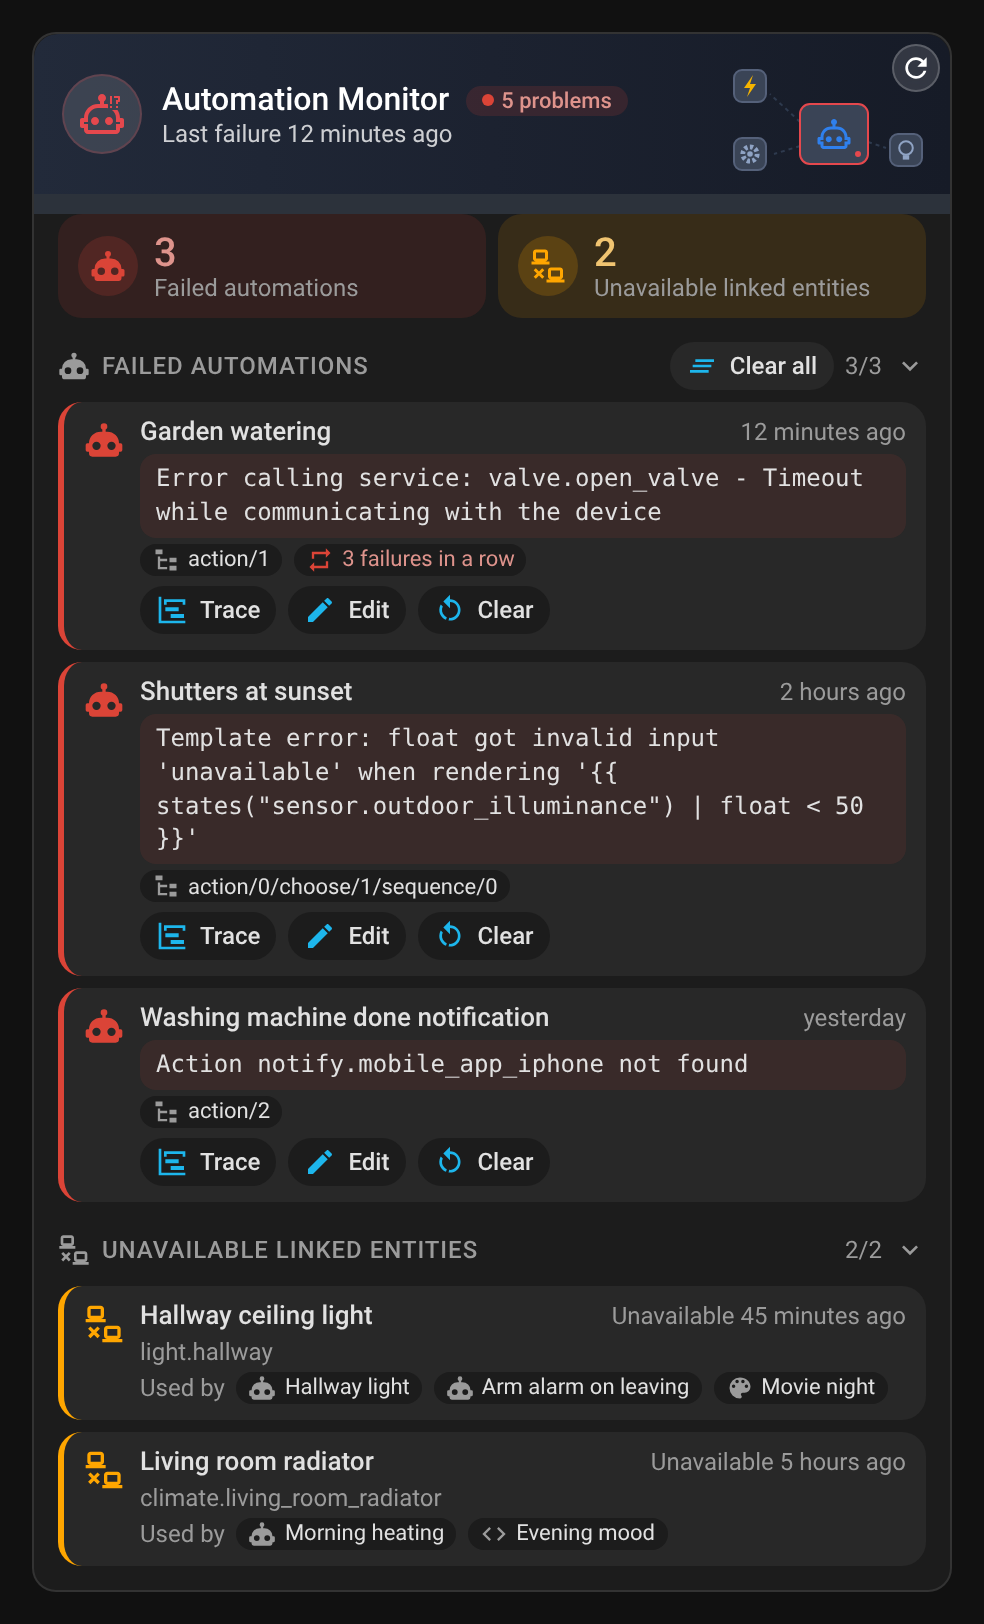 |
| All good | 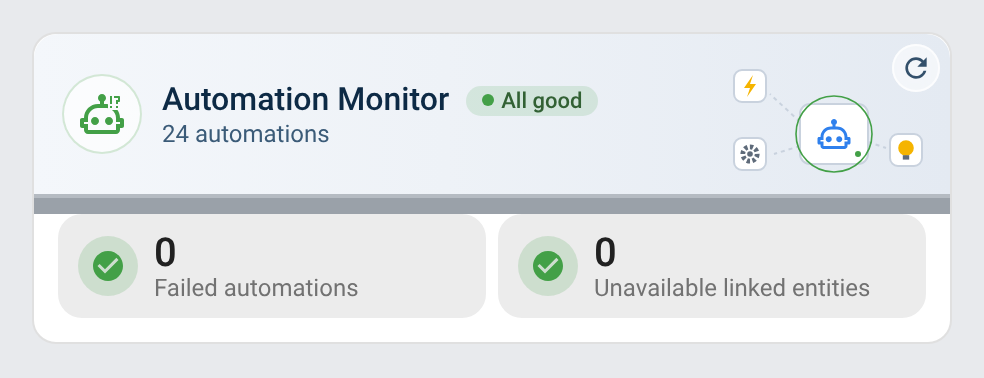 |
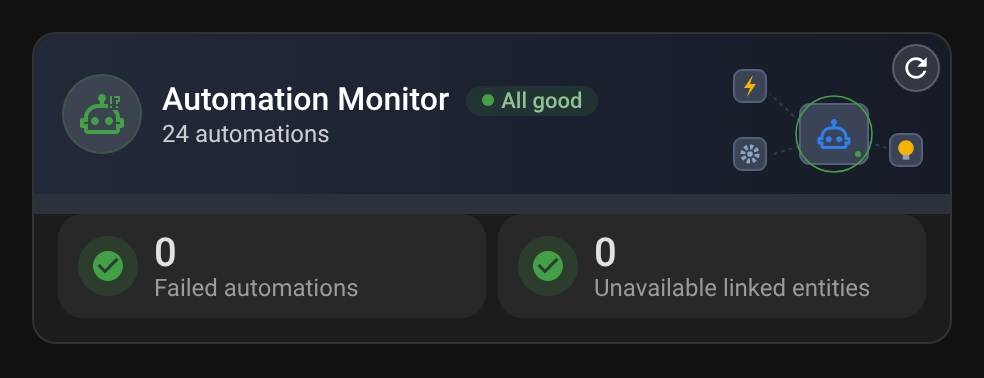 |
| Mini card | 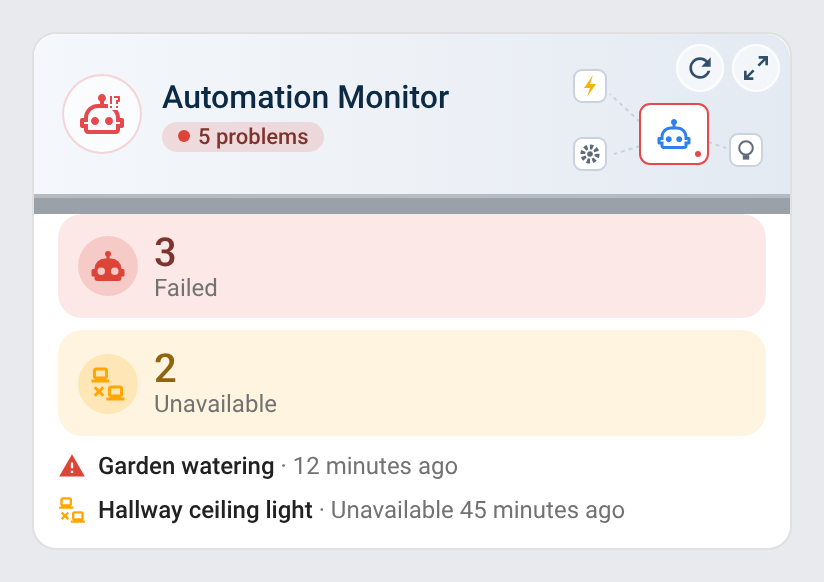 |
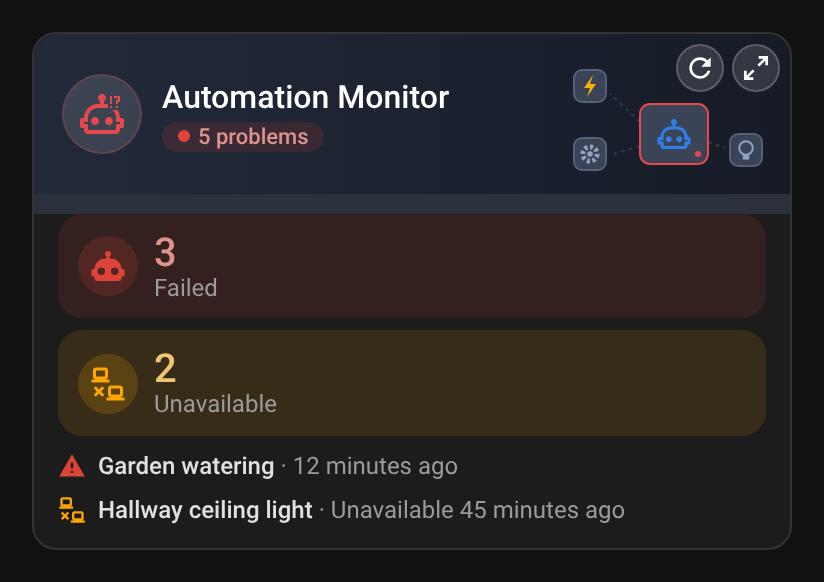 |
| Mini card, all good | 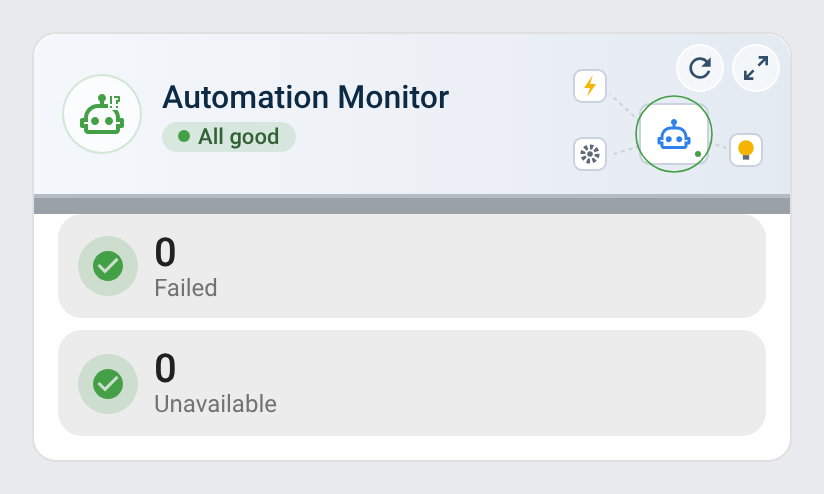 |
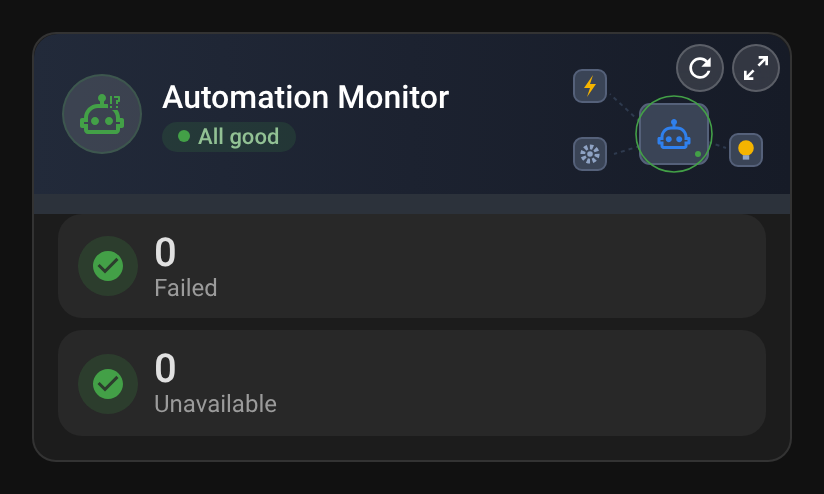 |
| Mini card zoomed in | 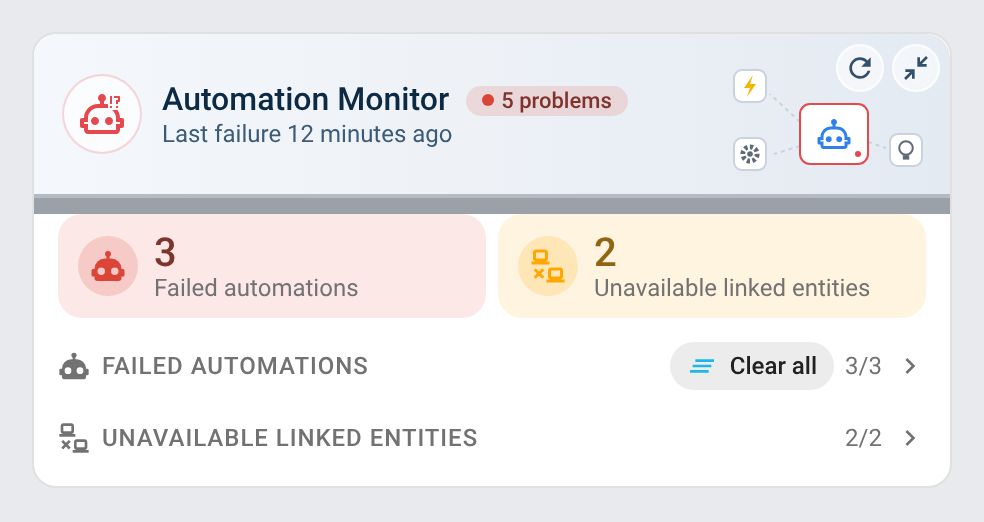 |
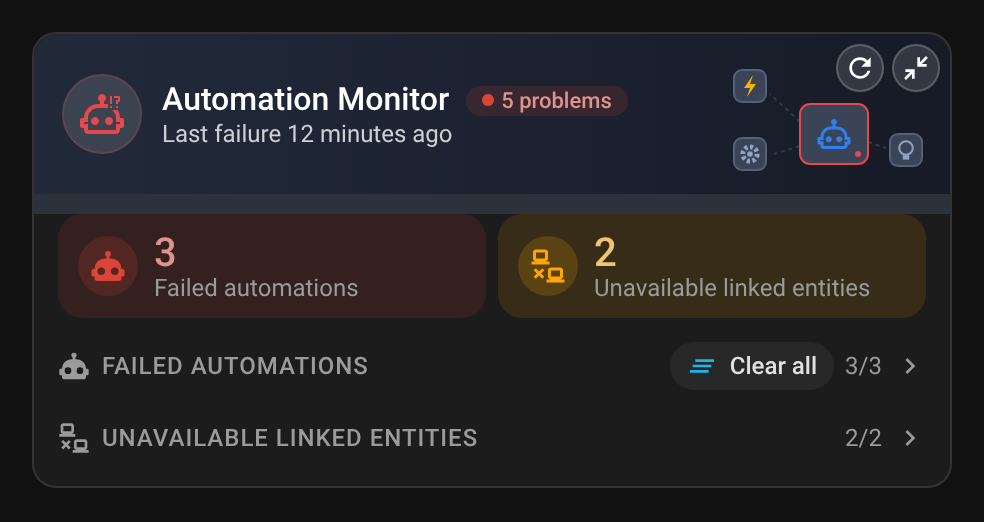 |
Git Sync
Commits and pushes the Home Assistant configuration to a Git remote (GitHub, Gitea…), with commit messages written by an AI task, and exports the dashboards. One repository or several, as the former Git Sync integration had one entry per repository.
Turning the module on (in the setup or with its switch in the panel's Settings tab) asks for the repository first: it is checked with Git (work tree, remote, branch name, commit author) before it is saved. Change it later with Settings → Versioning ⚙ → Repository settings, the options with Settings → Versioning ⚙.
Several repositories
Settings → Versioning ⚙ → Add a repository adds another one (an ESPHome folder, a /share folder…), checked the same way; Another repository sets one of them (its repository settings, then its options: schedule, export, notifications…, its own as an entry of the former integration had them), Remove repositories removes some. Each further repository has its own device, System Hub Git Sync (folder), with the same entities named after its folder (sensor.system_hub_versioning_esphome_status…), its own repairs and its own saved state; the first repository keeps the module's entities. Turned on next to the former Git Sync integration, the module takes over every one of its repositories: the configuration folder's first, the others as further repositories.
In the panel, the Git Sync tab shows one repository at a time, with a chip per repository; the Status tab shows the one most in need of action. The card shows the repository of the sensor it is given (entity), the first one by default.
Every action takes an optional repository: the path of a repository (or its id). Without it, git_sync_commit_push, git_sync_pull and git_sync_export_dashboards run on every repository, the other actions on the first one. The response keeps the first repository's result at its top, as with a single repository; with several, results also lists each repository's result with its path:
action: system_hub.git_sync_commit_push
data:
  repository: /config/esphome  # optional
response_variable: result
# {"committed": true, "pushed": true, "message": "...",
#  "results": [{"repository": "/config/esphome", "committed": true, "pushed": true, "message": "..."}]}
Prerequisites:
gitandsshin the Home Assistant container: they are in the official imagesThe configuration folder is a Git repository with a remote:
cd /config
git init -b main
git remote add origin [email protected]:<you>/homeassistant-config.git
# after the .gitignore below and a first commit:
git push -u origin main
Without
push -u, Git Sync sets the upstream at its first push (0.1.2 or newer).A
.gitignorekeeping secrets and runtime files out of the repository, for example:secrets.yaml .storage/ .cloud/ .ssh/ *.db* *.log* deps/ tts/ __pycache__/
[!WARNING] Everything that is not ignored is pushed. Keep credentials in
secrets.yaml(!secret) and prefer a private repository.
| Setting | Default | Description |
|---|---|---|
| Repository path | /config |
Folder containing .git |
| Remote | origin |
Remote to push to |
| Branch | current branch | Target branch on the remote |
| SSH private key | /config/.ssh/id_ed25519 |
Key used for the push |
| Author name / email | repository config | Overrides user.name / user.email. Required when Git has no identity in the Home Assistant container (the git config --global of the Terminal add-on is not seen there): the form asks for it instead of every commit failing |
| Option | Default | Description |
|---|---|---|
| AI task entity | the only ai_task entity, if there is one |
Writes the commit message from the diff. Without it: chore: update configuration (n files) |
| Commit message language | Home Assistant's, else English | en, fr, de, es, sr, sr-latn, it, nl, pt, pl, ro, da, sv, bg, ru, uk, hu, sk, cs, sl, lv or el |
| Automatic commit interval | 60 min | Commit and push every N minutes when something changed, 0 to disable, up to 1440 |
| Status refresh interval | 60 s | How often git status is read, from 10 to 3600 |
| Remote check interval | 15 min | How often the status refresh also runs git fetch, so that commits pushed from elsewhere show as behind or diverged; 0 to disable, up to 1440. A fetch always runs before each push |
| Pull before push | on | When the remote has new commits, rebase on them (git pull --rebase --autostash) before pushing. Off: nothing is committed nor pushed while the remote is ahead, and a repair says so |
| Commit before updates | off | When the update.install action runs (from an update entity, the Settings page, an automation or Update all), commit and push the configuration first, while the update downloads. Once per 10 minutes, so a batch of updates gets one snapshot from before the first. A failed snapshot is logged and never stops the update |
| Allow tracked sensitive files | off | Commit the changes of sensitive files that Git already tracks (see Secret guard). A new sensitive file is always refused |
| Notification action | none | Sent after each commit, for example notify.mobile_app_phone. An action that does not exist is refused by the form |
| Notification image URL | none | Absolute HTTPS URL (required by iOS) |
| Daily dashboard export | on | Export the dashboards every day |
| Export time | 08:00 | Time of the daily export |
| Export folder | dashboards_export |
Where the dashboards are written: inside the configuration folder (a relative path starts there) or a folder of allowlist_external_dirs, outside hidden folders such as .storage; any other folder is refused. The files an earlier export wrote there and that it no longer produces (deleted dashboard, format changed) are removed, unless you edited them since; any other file of the folder, such as your own lovelace-*.yaml, is never removed nor overwritten, even when it has the name of an export (a warning is logged and that file is skipped) |
| Export format | JSON | JSON (raw copy of .storage), YAML (dashboard configuration only, easier to read in diffs) or both |
| Export before each commit | off | Also export right before each commit |
SSH deploy key
- Developer tools → Actions →
system_hub.git_sync_generate_ssh_key→ Perform action: the response holds the public key (an existing key is kept) - On GitHub: repository → Settings → Deploy keys → Add deploy key, paste it and tick Allow write access
Entities
| Entity | Description |
|---|---|
sensor.system_hub_versioning_status |
clean, dirty, ahead (committed, push pending, or a branch never pushed), behind (the remote has commits that are not here: the next commit pulls them first), diverged (both sides have commits: nothing is pushed until it is resolved, see Repairs) or error (last push failed; retried by the automatic commit). Attributes: repository (its path), branch, upstream, remote_url (without the user or token of an HTTPS remote), ahead, behind, changed_count, changed_files (first 50), last_error, ai_task |
sensor.system_hub_versioning_changed_files |
Number of changed files |
sensor.system_hub_versioning_last_commit |
Time of the HEAD commit. Attributes: message, sha, short_sha |
sensor.system_hub_versioning_last_push |
Time of the last push made by the module. Attribute: message |
sensor.system_hub_versioning_last_export |
Time of the last dashboard export. Attribute: files |
sensor.system_hub_versioning_branch |
Current branch (diagnostic) |
button.system_hub_versioning_commit_and_push |
Commit and push now |
button.system_hub_versioning_export_dashboards |
Export the dashboards now |
Action system_hub.git_sync_commit_push
Fetches the remote, stages every change, commits, rebases on the remote's new commits if any, and pushes. Without message, the AI task writes it. Refused when the changes include a sensitive file, or when the branch has diverged from the remote. With nothing to commit, pushes the commits left pending by an earlier failure. Returns whether a commit was made and whether it pushed.
action: system_hub.git_sync_commit_push
data:
  message: "fix(corridor): lower the night light threshold"  # optional
response_variable: result  # {"committed": true, "pushed": true, "message": "..."}
Action system_hub.git_sync_pull
Fetches the remote and brings in its new commits: a fast-forward (git pull --ff-only, which Git refuses if it would overwrite a local change), or, when local commits are waiting to be pushed, those commits rebased on the remote ones (git pull --rebase --autostash, only on a clean work tree; a conflict aborts the rebase). Nothing is committed or pushed. Returns how many remote commits came in.
action: system_hub.git_sync_pull
response_variable: result  # {"pulled": 2}
Action system_hub.git_sync_generate_message
Writes a commit message for the current changes with the AI task, without committing: the diff is computed on a copy of the Git index, so what you staged by hand stays as it is. Returns null when nothing changed; fails when no AI task is set in the options.
action: system_hub.git_sync_generate_message
response_variable: result  # {"message": "feat(lights): add the corridor night scene"}
Action system_hub.git_sync_get_diff
Returns the changes a commit would include, file by file, without committing or staging anything (same copy of the index as generate_message). Each file carries its status (added, modified, deleted, renamed, copied or mode), the old path of a rename, whether it is binary, its added and removed lines and its hunks, each line with its line number on both sides. A file keeps at most 2000 lines (truncated counts the rest) and a response at most 200 files (more_files counts the rest).
action: system_hub.git_sync_get_diff
response_variable: diff
# {"files": [{"path": "automations.yaml", "status": "modified", "old_path": null, "binary": false,
#             "additions": 7, "deletions": 2, "truncated": 0,
#             "hunks": [{"header": "@@ -12,9 +12,14 @@", "lines": [{"kind": "context", "old": 12, "new": 12, "text": "  triggers:"}, ...]}]}],
#  "more_files": 0, "additions": 14, "deletions": 3}
Action system_hub.git_sync_export_dashboards
action: system_hub.git_sync_export_dashboards
response_variable: result  # {"files": ["lovelace", ...]}
Action system_hub.git_sync_generate_ssh_key
action: system_hub.git_sync_generate_ssh_key
response_variable: key  # {"public_key": "ssh-ed25519 AAAA... homeassistant"}
The actions are reserved to administrators (the diff can show secrets.yaml): a call from another user is refused, automations and scripts are not affected.
Event system_hub_git_committed
| Field | Description |
|---|---|
entry_id |
Config entry of System Hub |
message |
Commit message |
sha |
Commit hash |
files |
Number of files committed |
system_hub_dashboards_exported gives entry_id and files (names of the exported files).
How it works
The module runs the git command line in the configuration folder, never prompting (no terminal, SSH in batch mode). Every status interval it reads git status, the HEAD commit and the remote; every remote check interval it also runs git fetch (30 s timeout, skipped while a commit runs; a failed fetch is only logged), so that the behind count is current. A commit:
- fetches the remote, and stops if the branch has diverged (local commits not pushed and new remote commits), or is behind with Pull before push off;
- checks the changes for sensitive files, on a copy of the Git index;
- stages everything (
git add -A) and checks the staged files again, so a sensitive file written in the meantime is unstaged (git reset) and refused; sends the statistics and the first 8000 characters of the diff, secret values hidden, to the AI task, keeps the first line of its answer without quotes, backticks or dollar signs (100 characters max), and commits; - if the remote had new commits, runs
git pull --rebase --autostash; on a conflict the rebase is aborted (git rebase --abort), the commit stays local and nothing is pushed; - pushes.
Commits and exports never run at the same time. An automatic commit refused for a sensitive file, or blocked by a diverged or behind branch or a rebase conflict, is logged once as a warning and not tried again until the changed files or the commits ahead or behind change. Any other failure (remote unreachable, authentication refused) is tried again at every interval and logged as a warning once per distinct message, without a traceback. The last push and export are kept across restarts.
Secret guard
A commit, and the message generation, are refused when the changes include secrets.yaml, a file under .storage/ or .ssh/, *.pem, *.key, id_rsa*, known_devices.yaml, home-assistant_v2.db* or *.log. A sensitive file that Git already tracks can be allowed with the Allow tracked sensitive files option; a new one never is, and deleting one from the repository is always allowed. In the diff sent to the AI task, the value of every key naming a secret (password, passwd, token, api_key, api-key, apikey, x-api-key, secret, client_secret, private_key, authorization, bearer, and pin as a whole word such as door_pin) is replaced with <redacted>, in key: value, - key: value (YAML list item), "key": "value" and key = value lines, and so is any Bearer <token>; !secret references are kept.
Repairs
The module raises these issues in Settings → System → Repairs:
| Issue | When | Resolution |
|---|---|---|
| Cannot push (diverged) | The branch and the remote both have commits the other lacks, or the rebase of a commit stopped on a conflict | In a terminal in the repository: git pull --rebase, fix the conflicts (git add, git rebase --continue), then Commit & push. Removed by the next successful push |
| Cannot push (behind) | The remote has new commits and Pull before push is off | Turn the option on, or run git pull --rebase. Removed by the next successful push |
.gitignore does not exclude secrets |
The repository holds a configuration.yaml and its .gitignore lets secrets.yaml or .storage/ be committed |
Fix shows the lines to add and appends them to .gitignore once confirmed (repairs are for administrators only). A file already tracked stays tracked: git rm -r --cached secrets.yaml .storage removes it from the repository, not from the disk |
Git Sync card
The card of System Hub's Git Sync module, ported from ha-git-sync: same options and look (custom:system-hub-card with module: git_sync); the cards of the old integration are moved to it at System Hub's next start. System Hub serves it with its other cards: no separate install. Add it from the card picker, or:
type: custom:system-hub-card
module: git_sync
| Changes pending | Up to date |
|---|---|
|
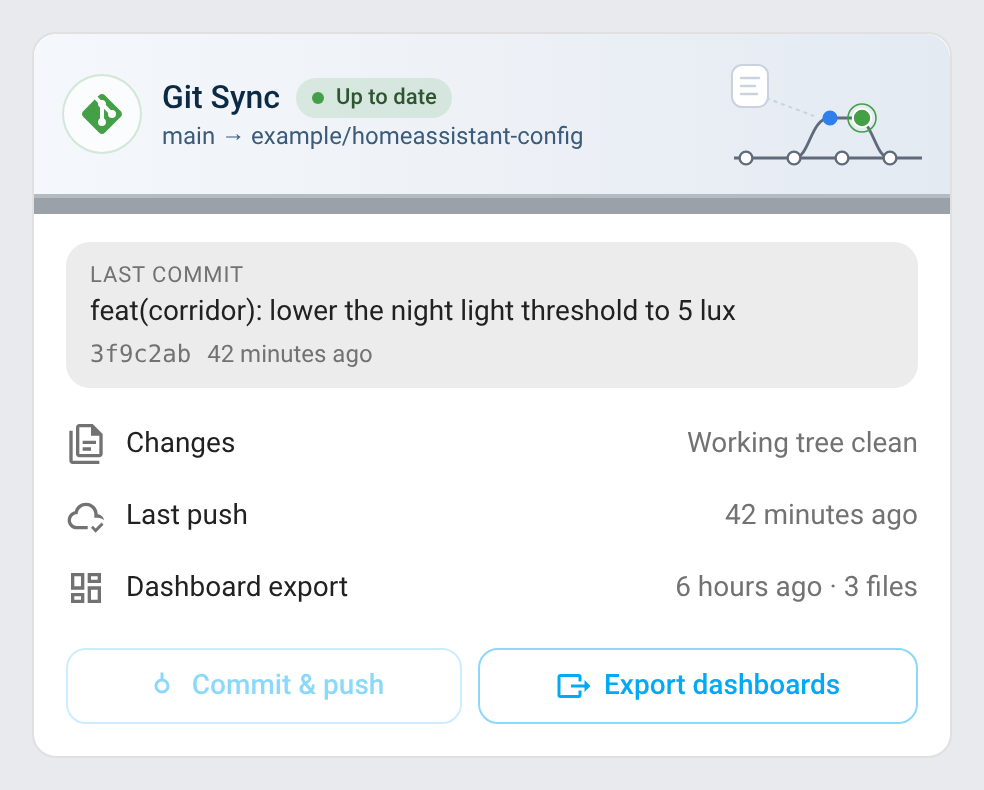 |
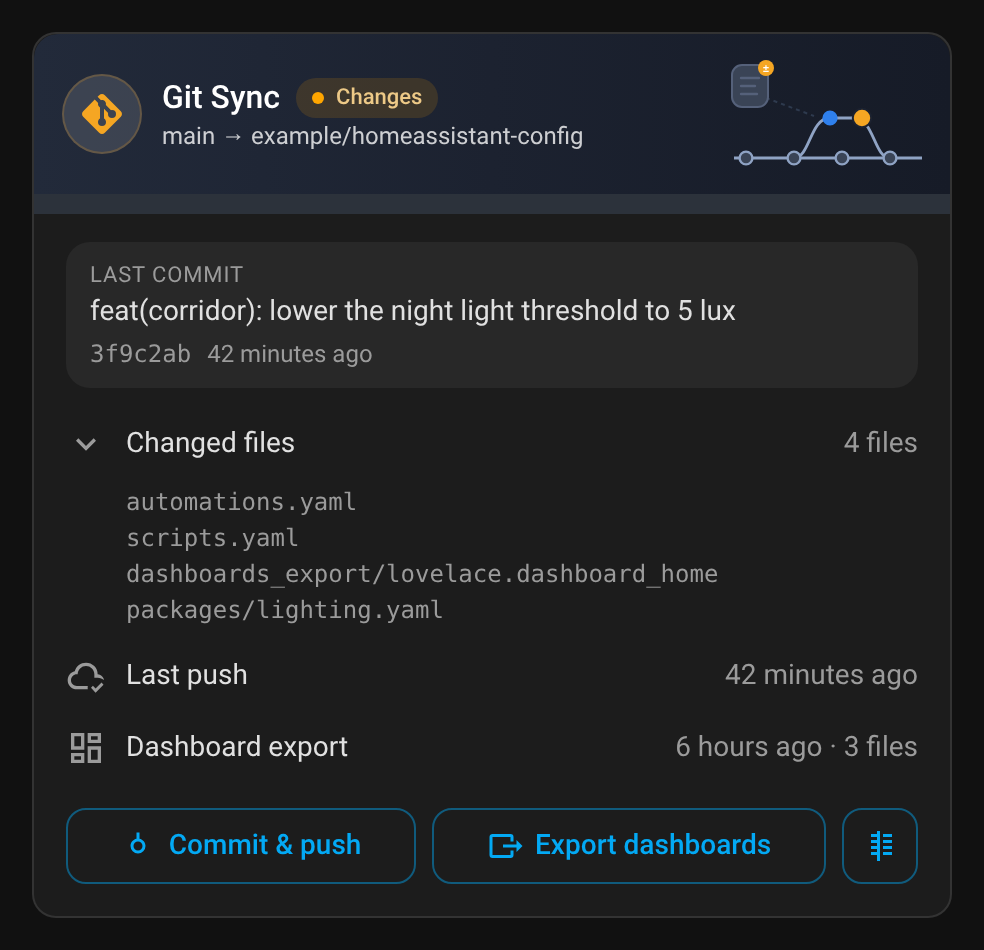 |
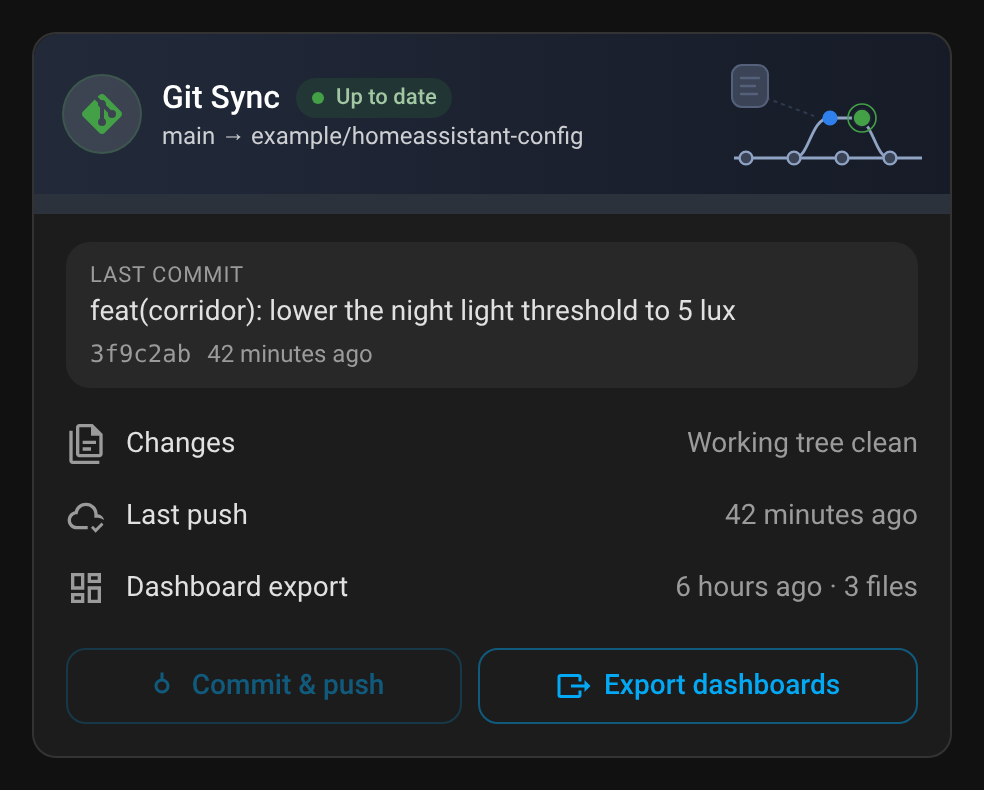 |
| Push failed | Commit & push, message written by the ✨ button |
|---|---|
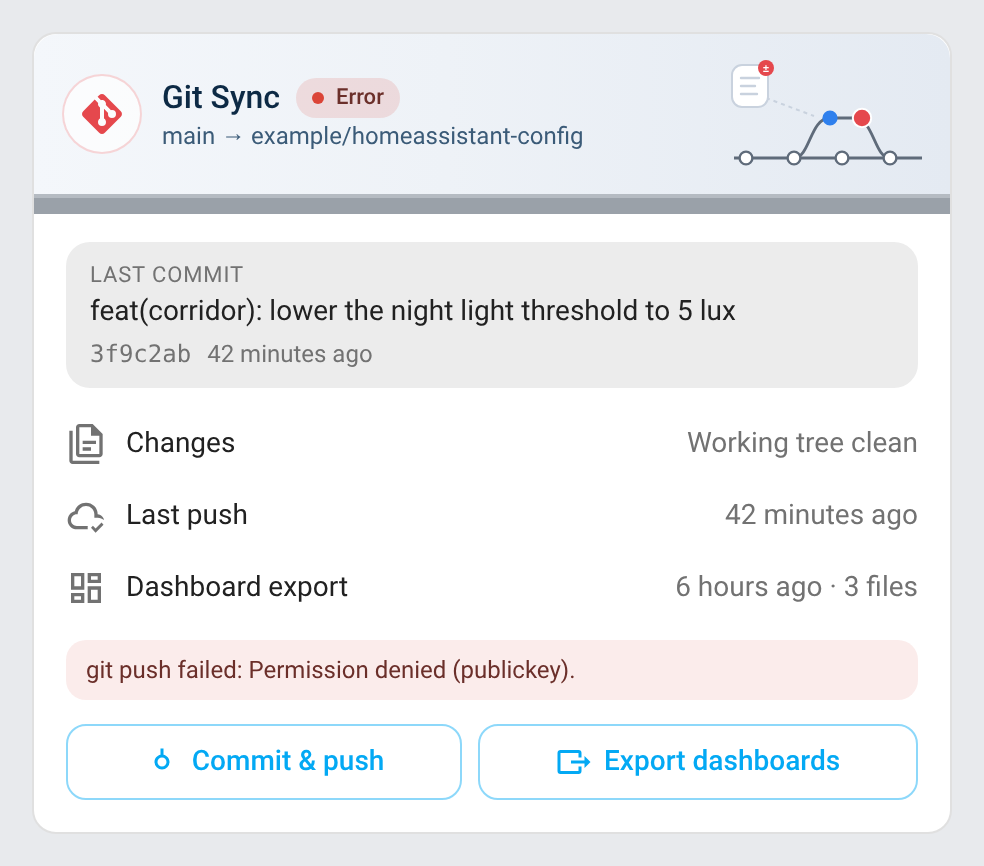 |
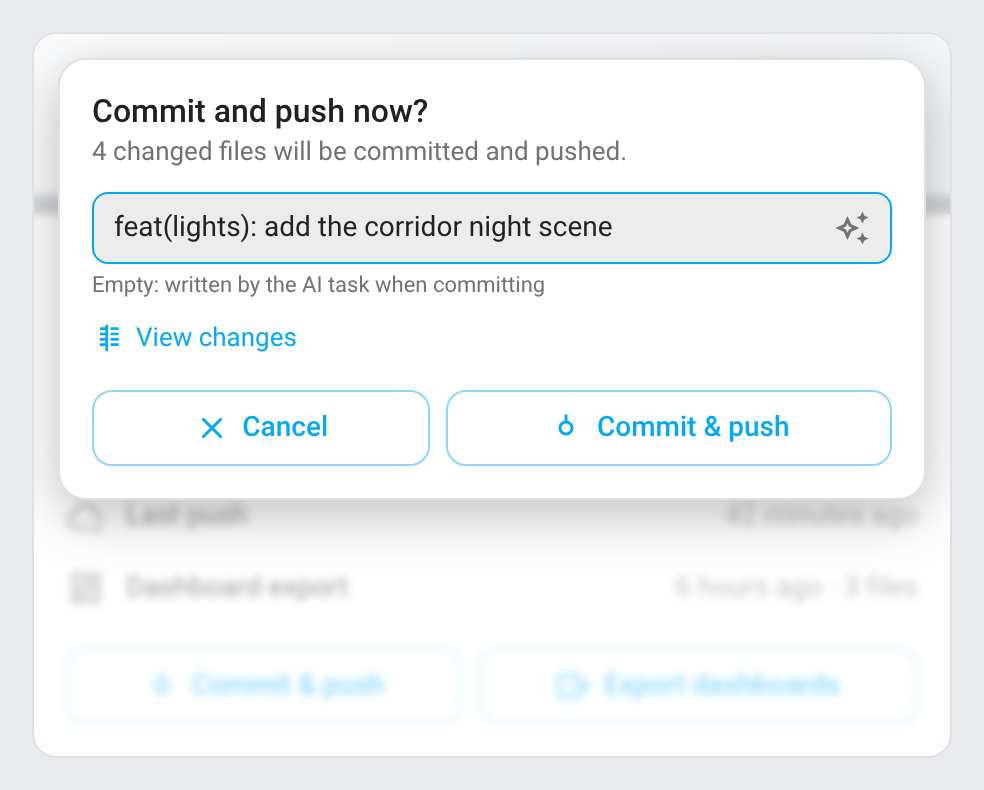 |
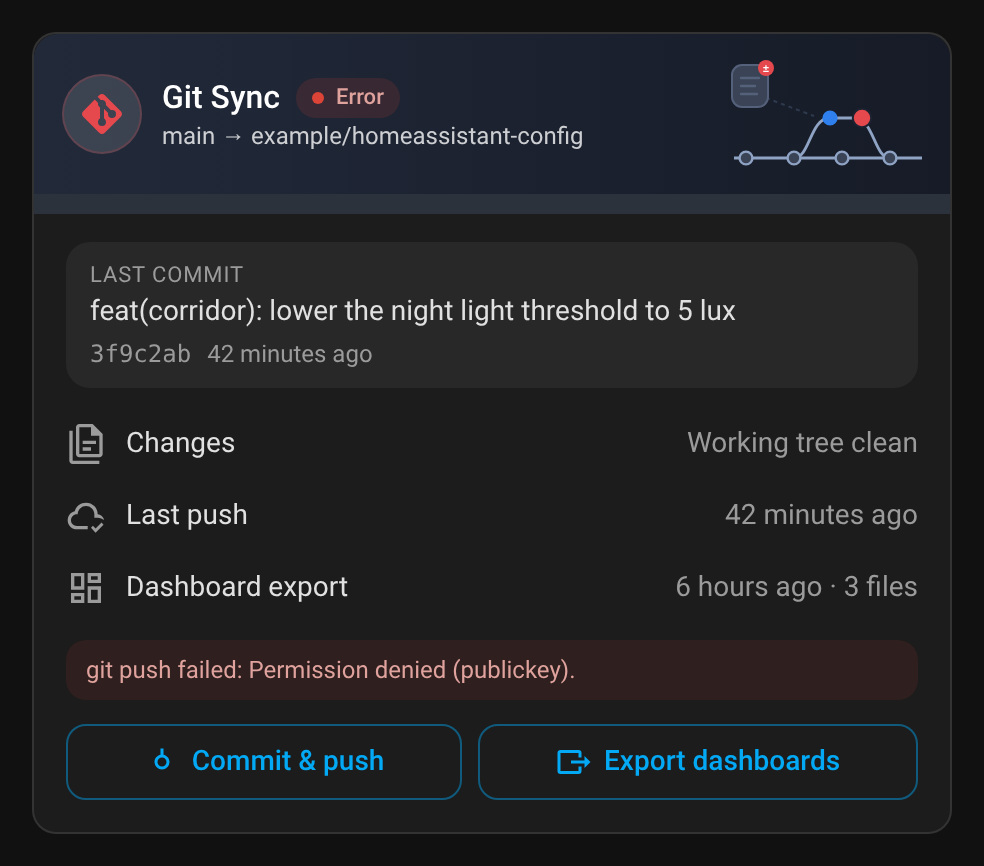 |
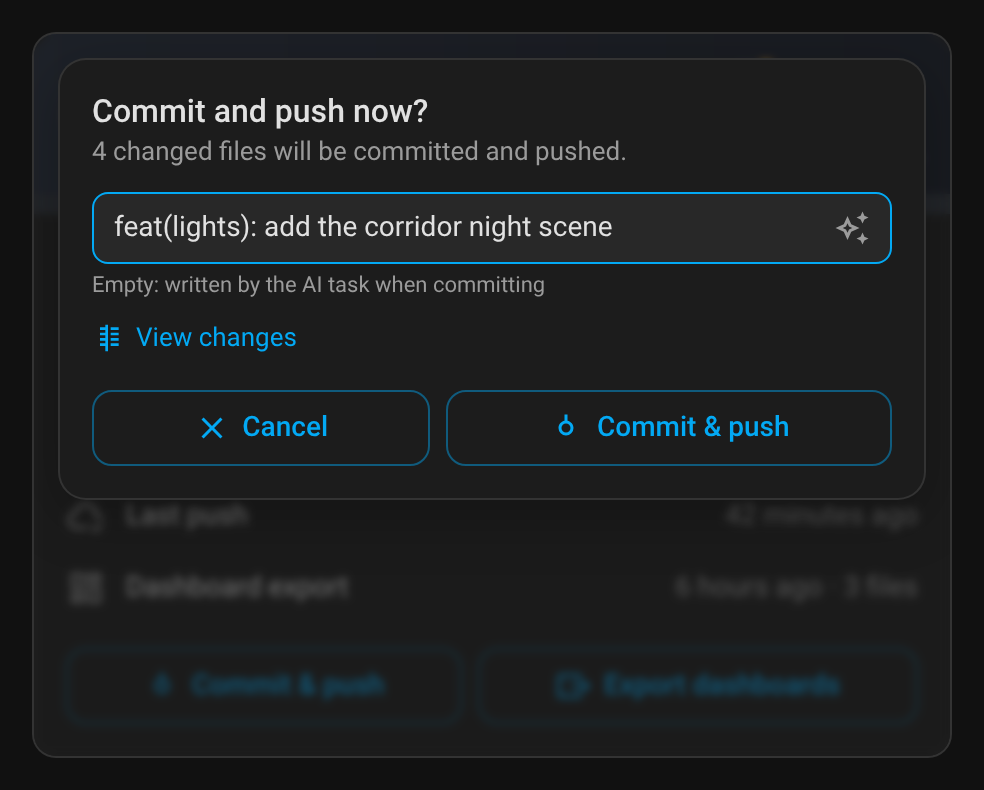 |
- Header: status (up to date, changes, push pending, behind, diverged, error, working…), branch and remote repository
- Last commit: message, short hash and how long ago
- Changed files: collapsible list, folded again when you click elsewhere
- Last push and Dashboard export, with the number of exported files
- Commit & push opens a confirmation at the top of the card with a message box, as in VS Code: the placeholder names the branch, and the ✨ button inside it (shown when an AI task is set) writes the message for the current changes without committing, so you can read and edit it before Commit & push. Left empty, the AI task writes it when committing. Enter commits, Escape closes. Export dashboards runs the export right away. The result is shown in a toast
- Pull (shown when the remote has commits that are not here, unless local changes sit on top of unpushed commits: commit first) brings in the remote commits right away, with
system_hub.git_sync_pull - The actions (Commit & push, Pull, Export dashboards, View changes, ✨) are shown to administrators only, as the actions themselves are reserved to them; other users see the status
- View changes (the compare button beside the actions, also linked from the commit confirmation, shown when something changed) opens the diff viewer below
Diff viewer
A full-screen view of what the next commit would include, laid out like an editor's source control view: the changed files on the left with their status letter (Added, Modified, Deleted, Renamed, Type or mode changed) and their added and removed lines, the selected file on the right hunk by hunk, with the line numbers of both sides, additions in green and deletions in red. On a phone it fills the screen and the files become a row of chips above the diff. Nothing is staged or committed by looking: the diff comes from a copy of the Git index (system_hub.git_sync_get_diff). ↑ ↓ walk the files, Escape or a click outside closes, Commit & push goes straight to the commit confirmation of the card.
| Desktop | Phone |
|---|---|
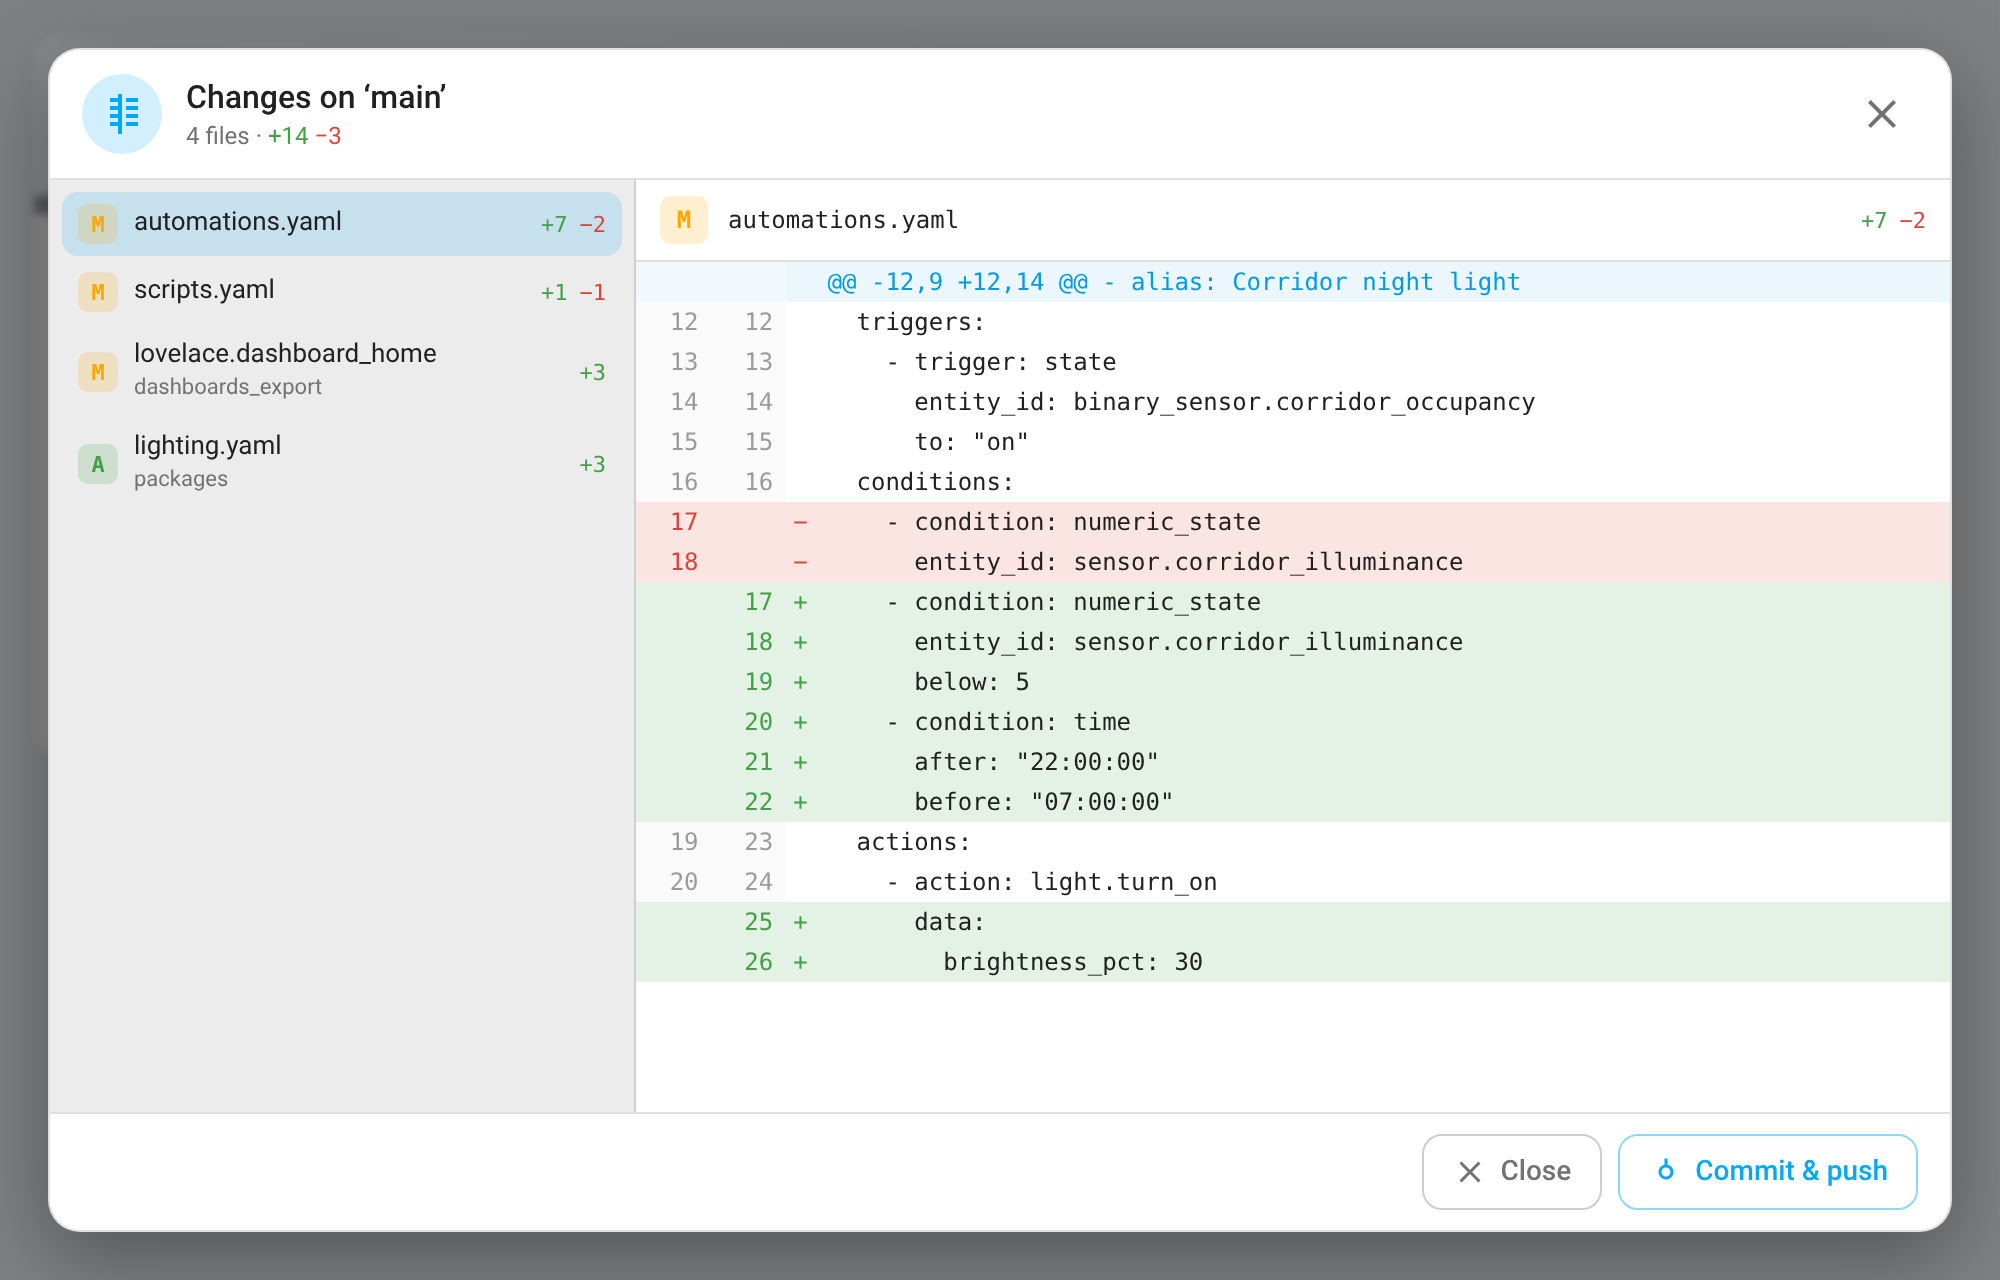 |
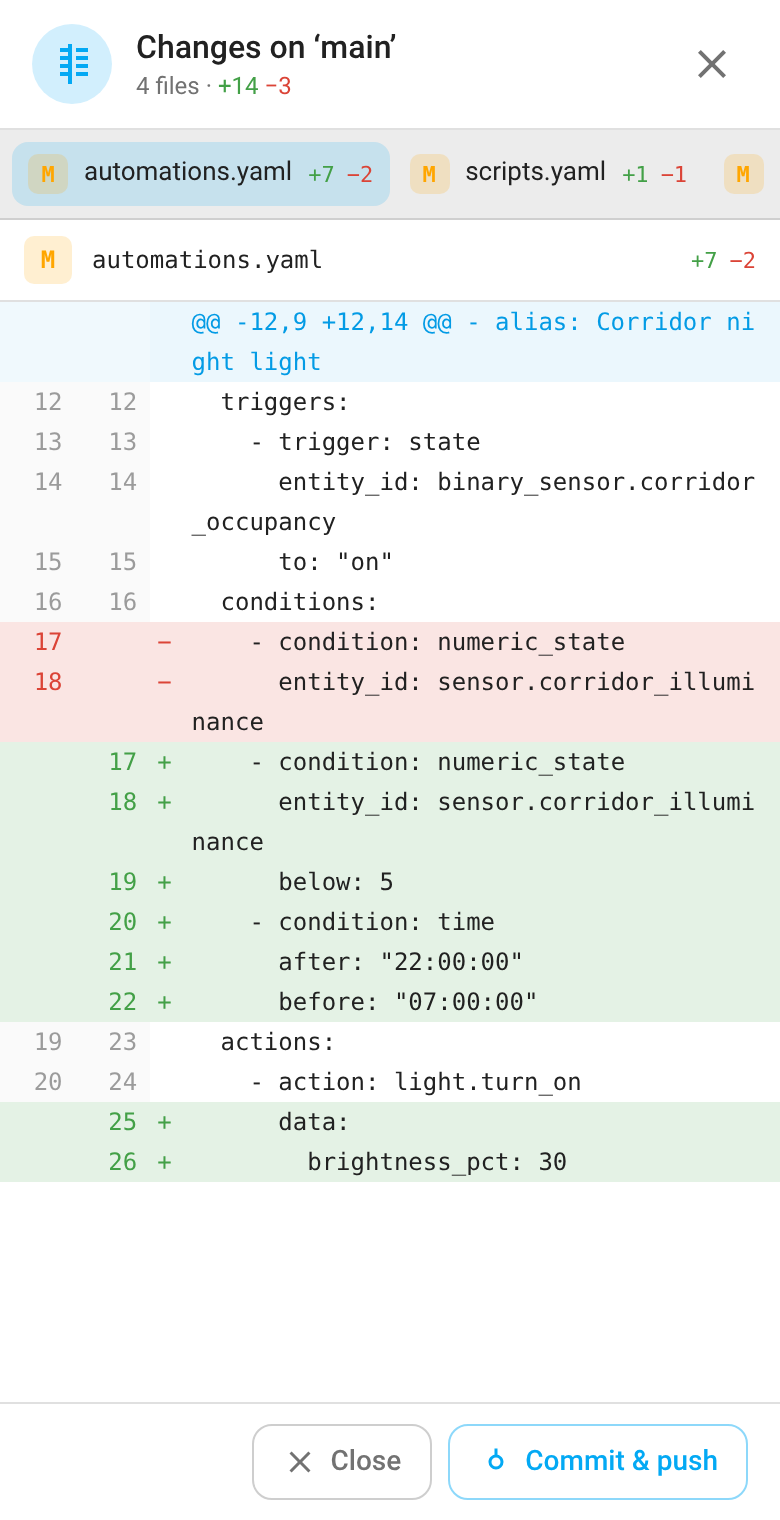 |
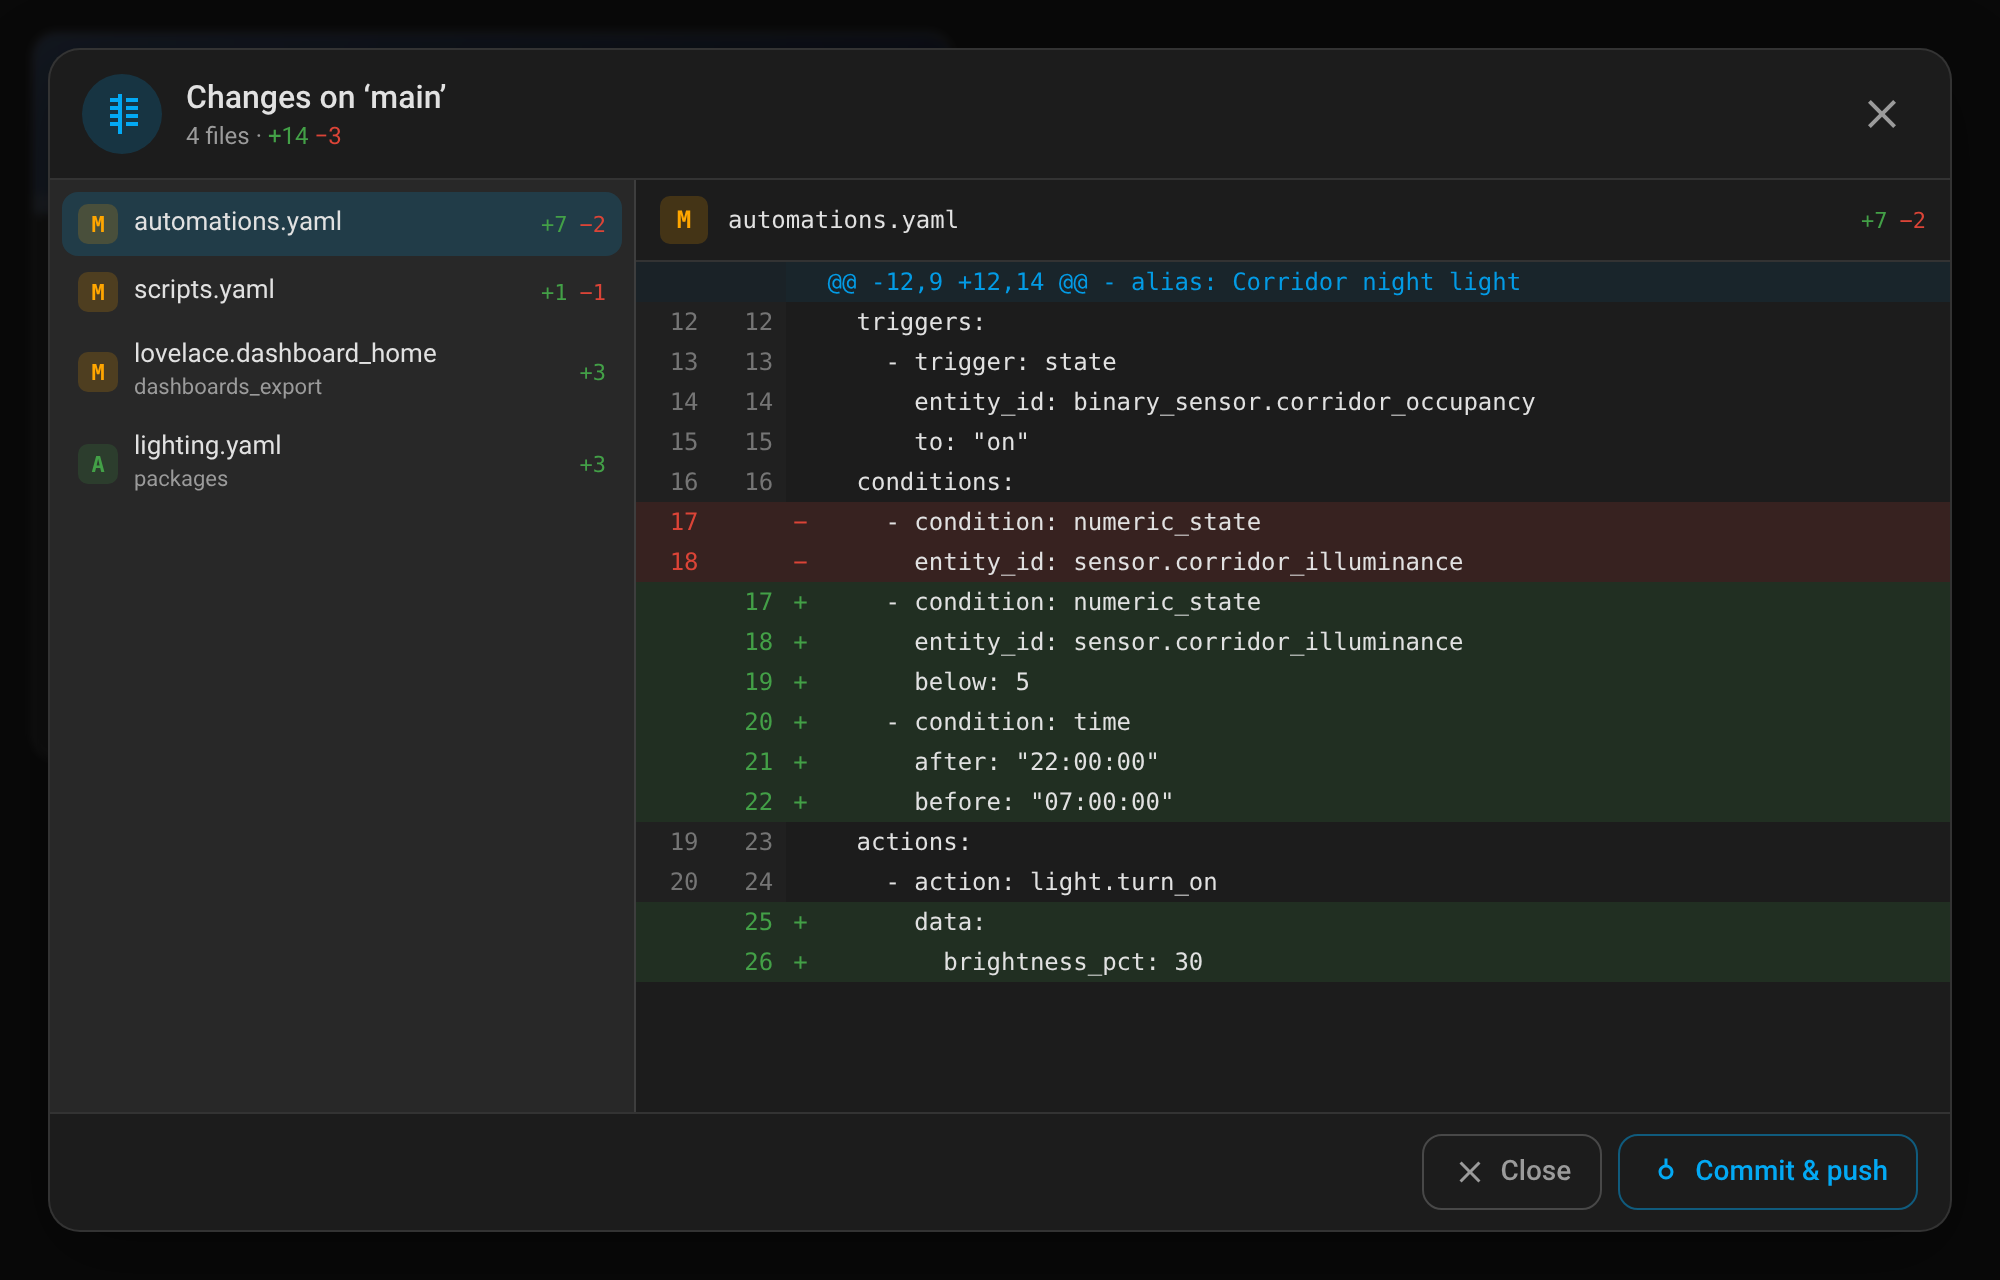 |
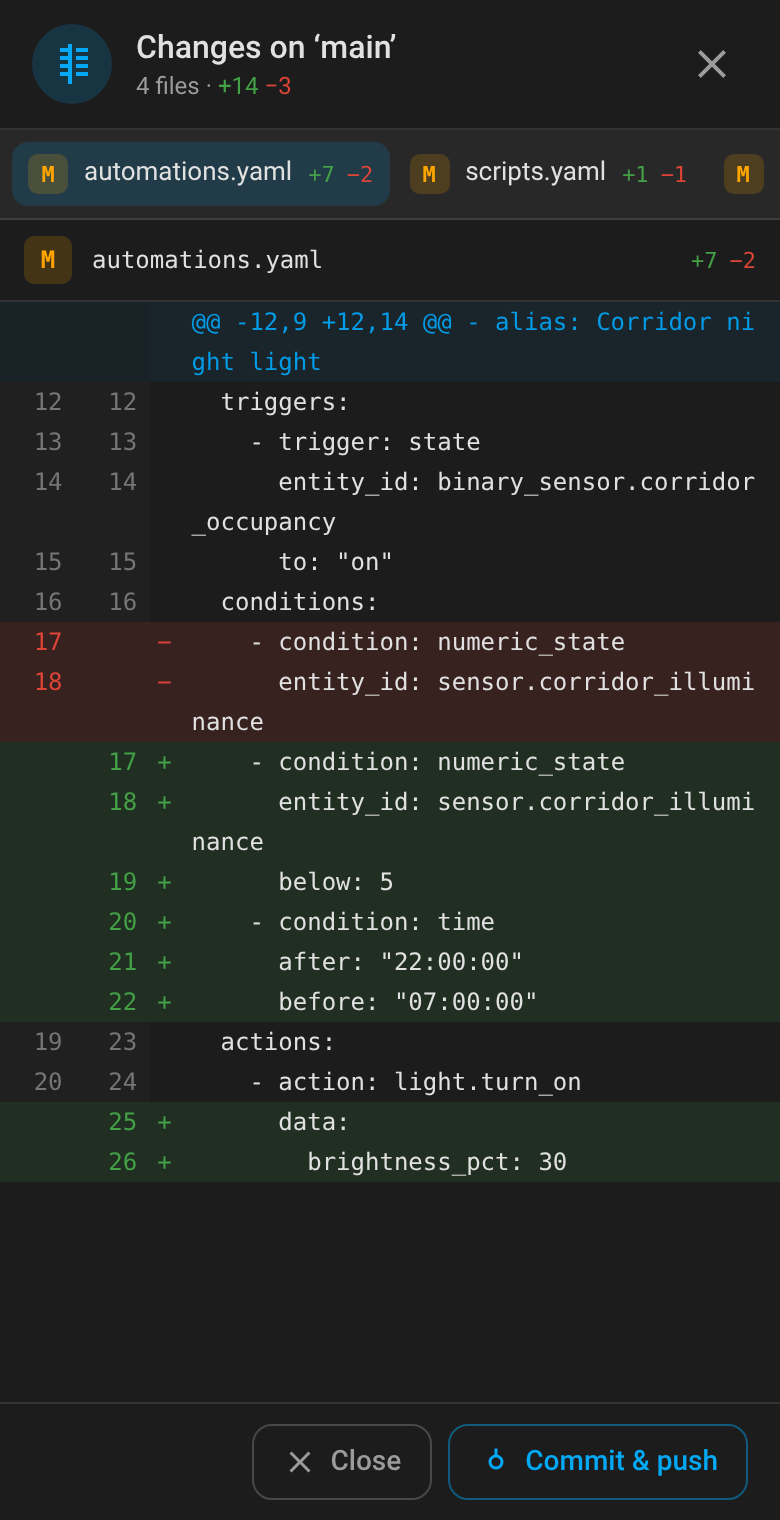 |
Every option is in the visual editor:
| Option | Default | Description |
|---|---|---|
entity |
found automatically | The Git Sync Status sensor (sensor.system_hub_versioning_status); any other Git Sync entity leads to it, and an entity that isn't one (from the old integration, say) falls back to it |
title |
Git Sync | Card title |
show_title |
true |
Show the title in the header (e.g. false under a section heading of your own) |
illustration |
true |
The illustrated header with the branch (see Lovelace cards); false for the classic header |
illustration_theme |
auto |
day or night picture; auto follows the Home Assistant theme |
show_subtitle |
true |
Show the subtitle under the title |
show_files |
true |
Collapsible list of the changed files |
show_export |
true |
Last export and the Export dashboards button |
language |
Home Assistant's | en, fr, de, es, it, nl, pt (European Portuguese), pl, ro, da, sv, bg, ru, uk, hu, sk, cs, sl, lv, el, sr (Serbian, Cyrillic) or sr-Latn (Serbian, Latin) |
Mini card
A compact version for a 6-column slot: status, branch, last commit on one line, number of changed files, last push and Commit & push as an icon button (plus Pull when the remote has new commits; administrators only). The zoom button at the top right switches it to the full card (same options) and back; a click anywhere else brings back the compact view.
type: custom:system-hub-mini-card
module: git_sync
| Changes pending | Up to date | Push failed |
|---|---|---|
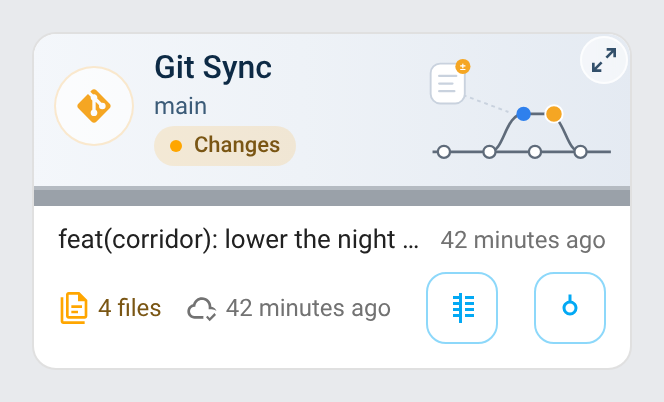 |
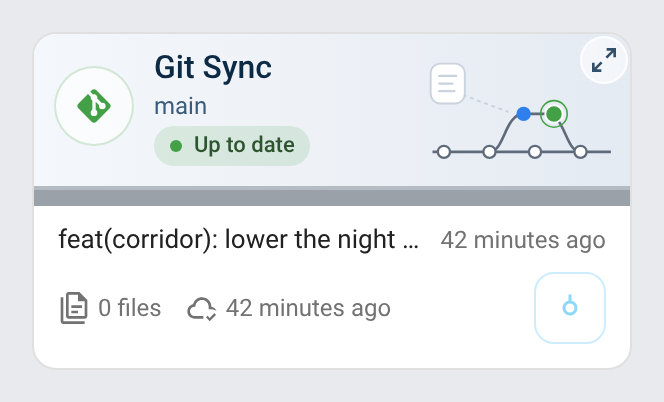 |
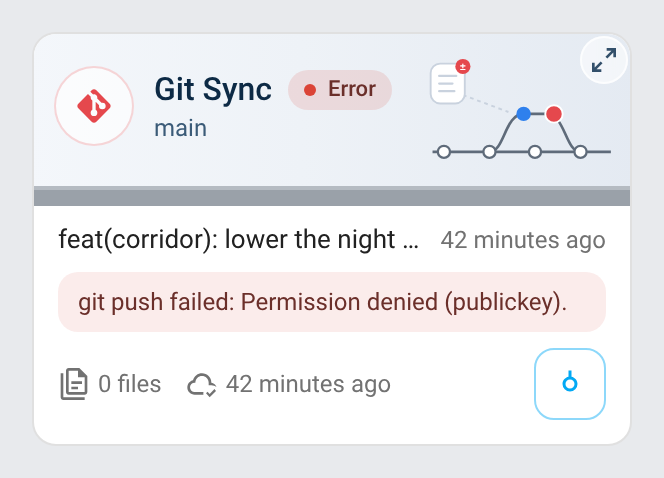 |
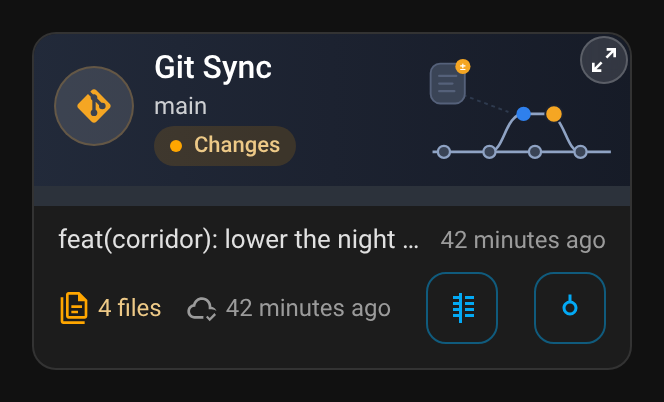 |
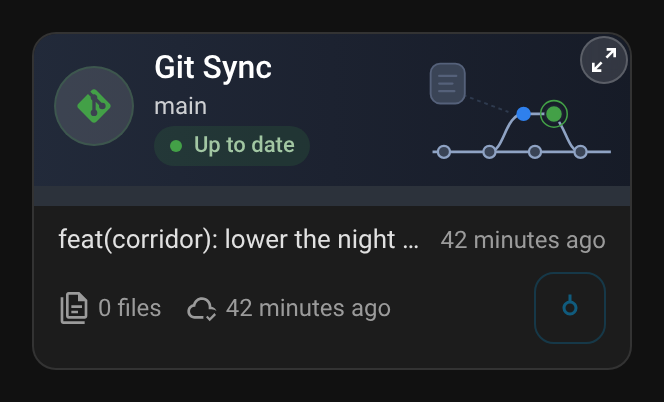 |
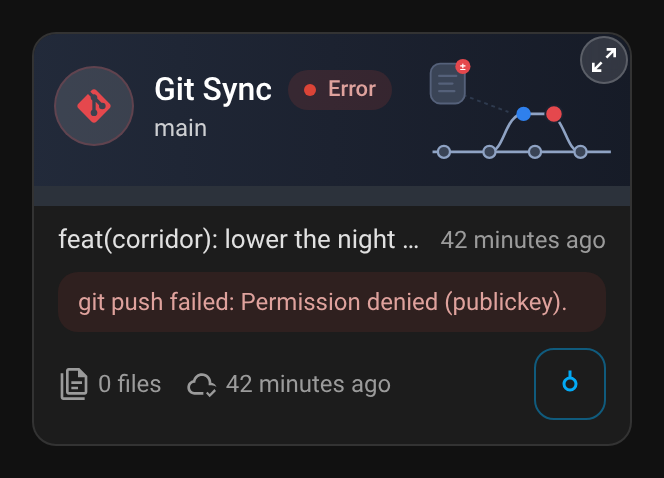 |
| Zoomed in | |
|---|---|
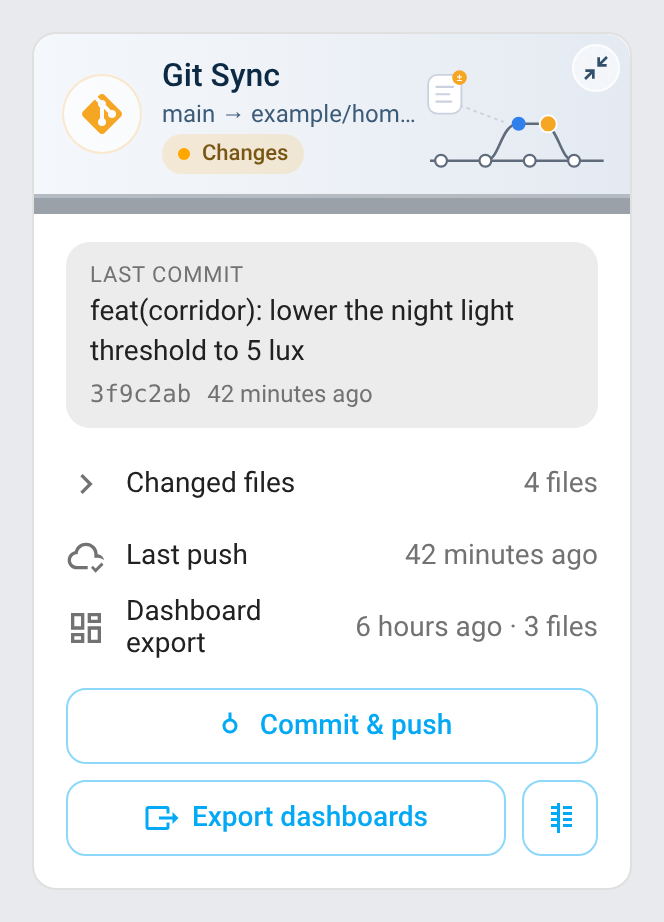 |
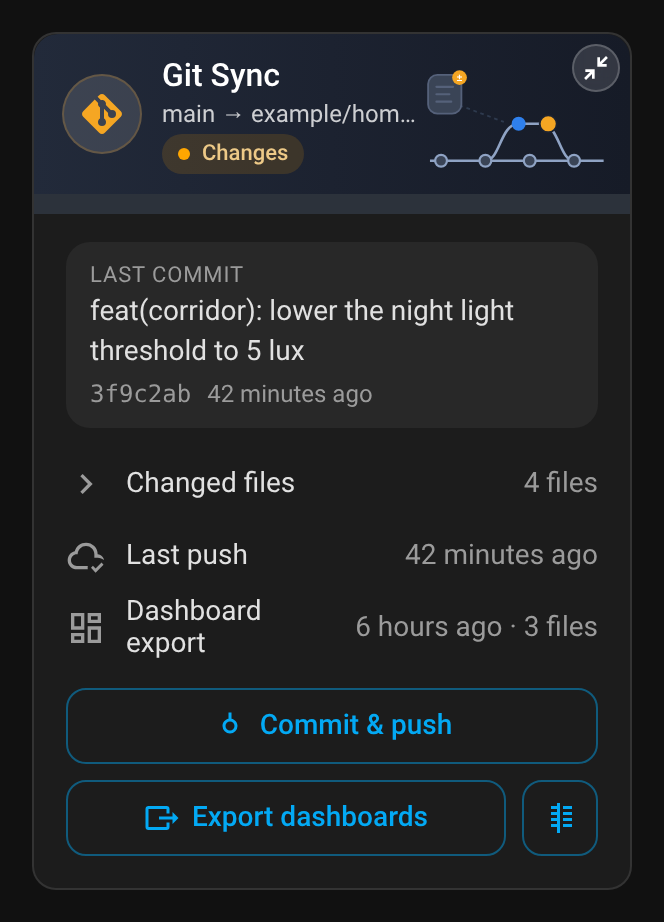 |
In the compact view Commit & push opens the same message box (✨ button included) in place of the content. The mini card takes the options of the full card, plus:
| Option | Default | Description |
|---|---|---|
zoom |
true |
Zoom button switching to the full card; show_files and show_export apply to the full view |
Entities and actions used
The card reads the Git Sync module's sensors, told apart by their translation key (git_sync_status, git_sync_last_commit, git_sync_last_push, git_sync_last_export) so renamed entity IDs keep working, and only System Hub's (the other modules have a status too). It calls system_hub.git_sync_commit_push, system_hub.git_sync_pull, system_hub.git_sync_export_dashboards, system_hub.git_sync_generate_message and system_hub.git_sync_get_diff, with no config entry: System Hub has a single one.
Screenshots: python scripts/screenshots_git_sync.py (mock data, frozen clock).
Orphans
Lists the entities their integration no longer provides, so that you can remove them in bulk, and the devices left behind by a removed integration. Formerly Orphan Entities.
The entity registry is scanned every 15 minutes (Scan interval), and a few seconds after it changes (an entity added or removed, an integration set up or removed). Nothing is scanned while Home Assistant is starting, nor during the Grace period after startup (10 minutes), while the integrations set up their entities; Scan now (the button, the action or the panel) scans at once, even within the grace period.
| Reason | Listed when | Colour |
|---|---|---|
| Integration removed | Its config entry no longer exists (listed even when disabled) | red |
| Integration not loaded | A YAML platform that is no longer loaded | red |
| Not provided | Its integration is loaded but no longer creates it (restored placeholder, or no state) | red |
| Unavailable | Still provided, but unavailable for longer than Stale after (24 hours; 0 never lists it) | orange |
| Unknown | Still provided, but unknown for that long (Include unknown entities); buttons, scenes, events and the like, unknown by design, never are | orange |
Entities of a disabled or failing integration are not listed: they come back with it (that is the Watchdog module's job), nor are disabled entities other than those of a removed integration. Ignored integrations and Ignored entities (entity IDs and device IDs, which Ignore adds) are never listed.
Used by: each orphan comes with what still uses it — automations, scripts, scenes, groups (old-style groups and group helpers) and dashboards in storage mode — each with a link to its editor; the dashboards are read once, then again only when one is saved. Removing an entity still in use asks you to confirm it.
Orphan devices: devices whose integration entries were all removed. Remove devices removes them from the device registry with their entities; the automations and scripts still using a device (device triggers, conditions, actions) are listed.
Every removal checks each entity (or device) again first: one that is no longer orphaned since the scan (its integration came back, it is available again) is kept and returned as skipped. Only what the last scan listed can be removed. The history stays in the database; an entity still provided by its integration comes back if the integration creates it again.
Panel
The Orphans tab: a counter per reason (a click filters on it), the orphan devices, the entities removed since Home Assistant started and the last scan; Scan now; the list with a search (name, entity ID, integration, device, config entry), an integration filter and a reason filter; tick entities one by one or Select every match, then Remove or Ignore them, once confirmed; each row shows what uses it, with links; the orphan devices below, removed or ignored the same way. The whole list is read from the system_hub/orphans WebSocket command, not from the sensor's attributes.
Cards
The Orphan Entities card and mini card are served by System Hub (custom:system-hub-card (module: orphans), custom:system-hub-mini-card (module: orphans)) and use the Orphans module's entities and actions.
| Card | Light | Dark |
|---|---|---|
| Card | |
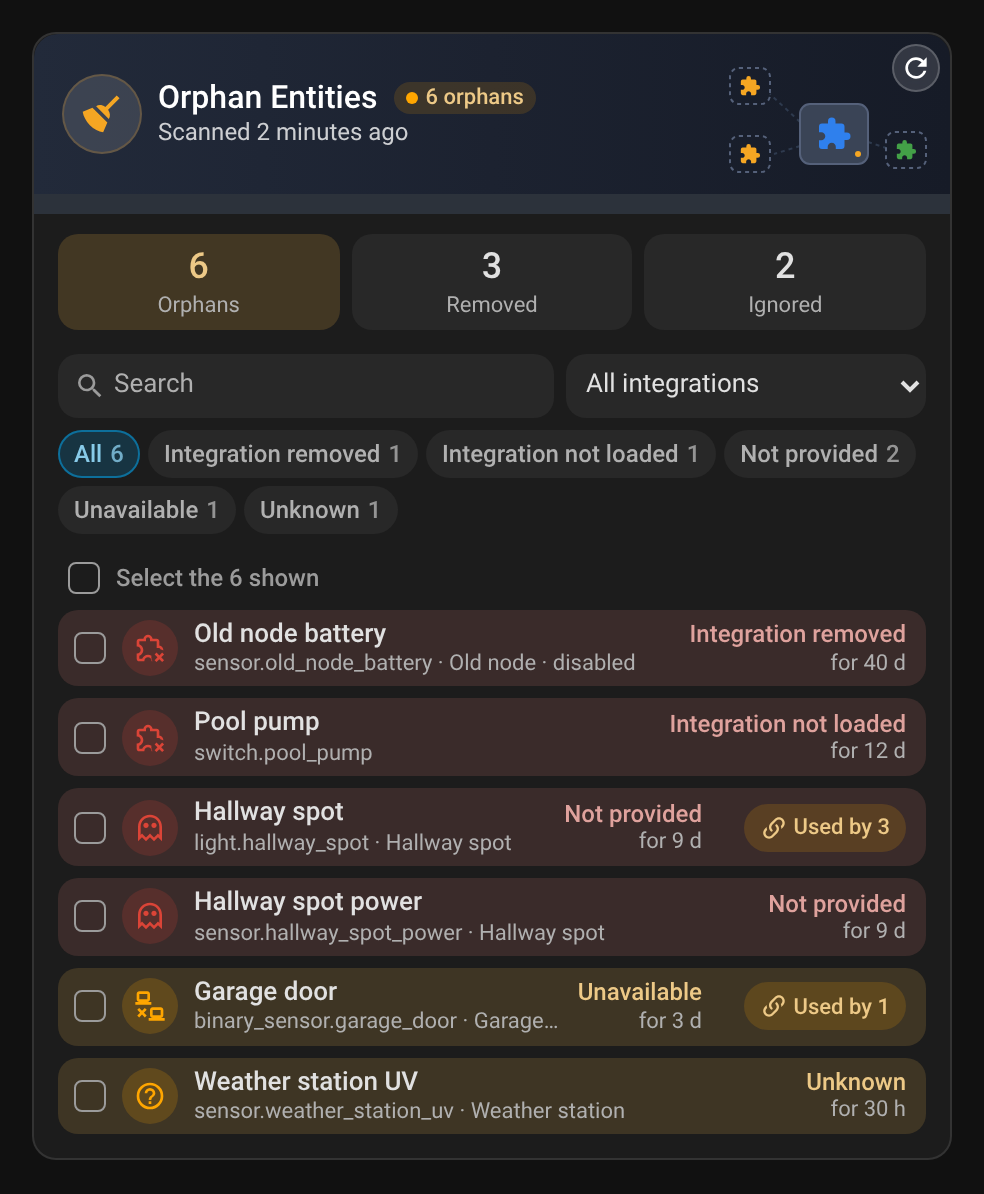 |
| Two entities selected | 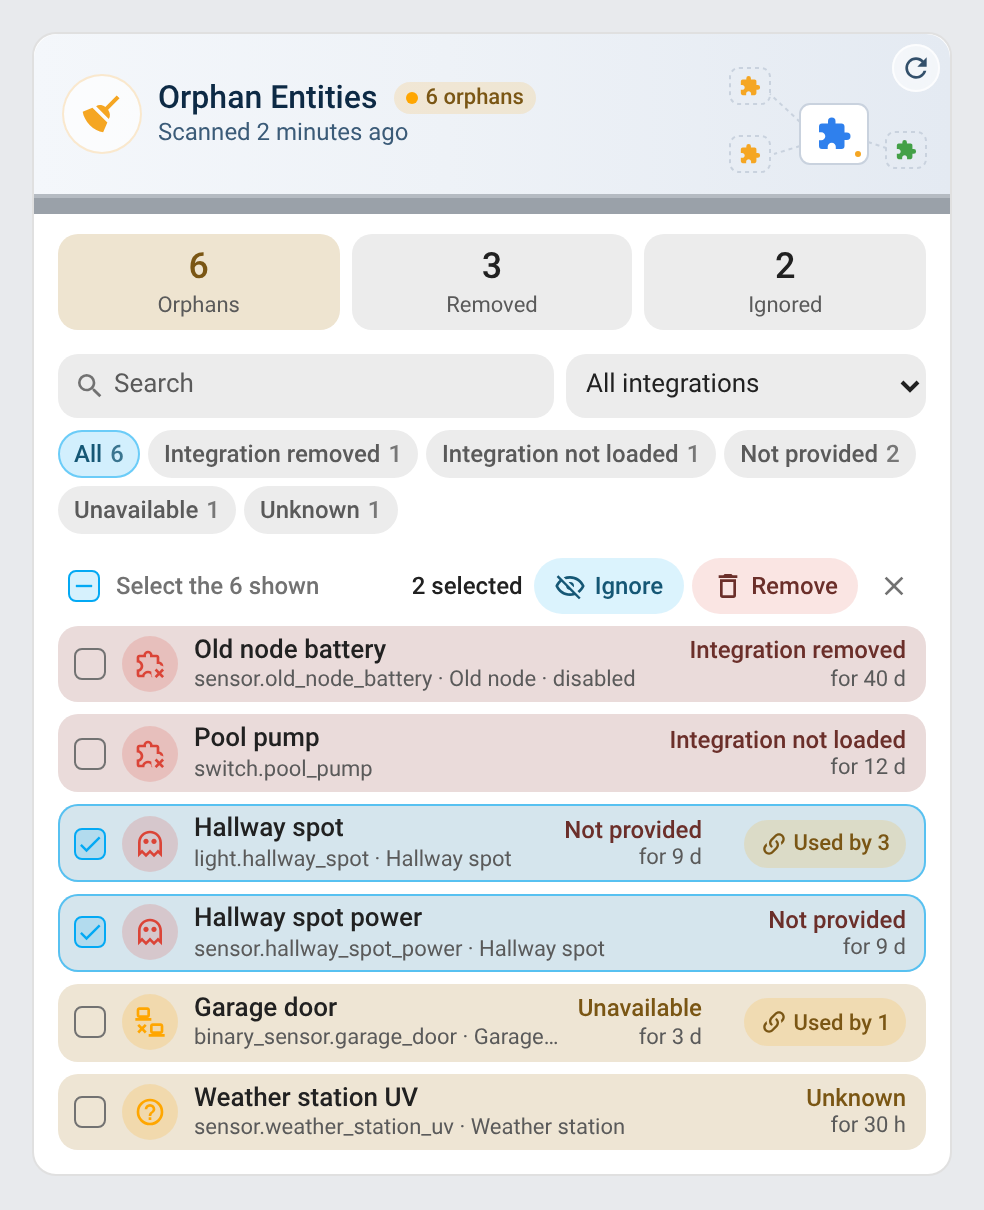 |
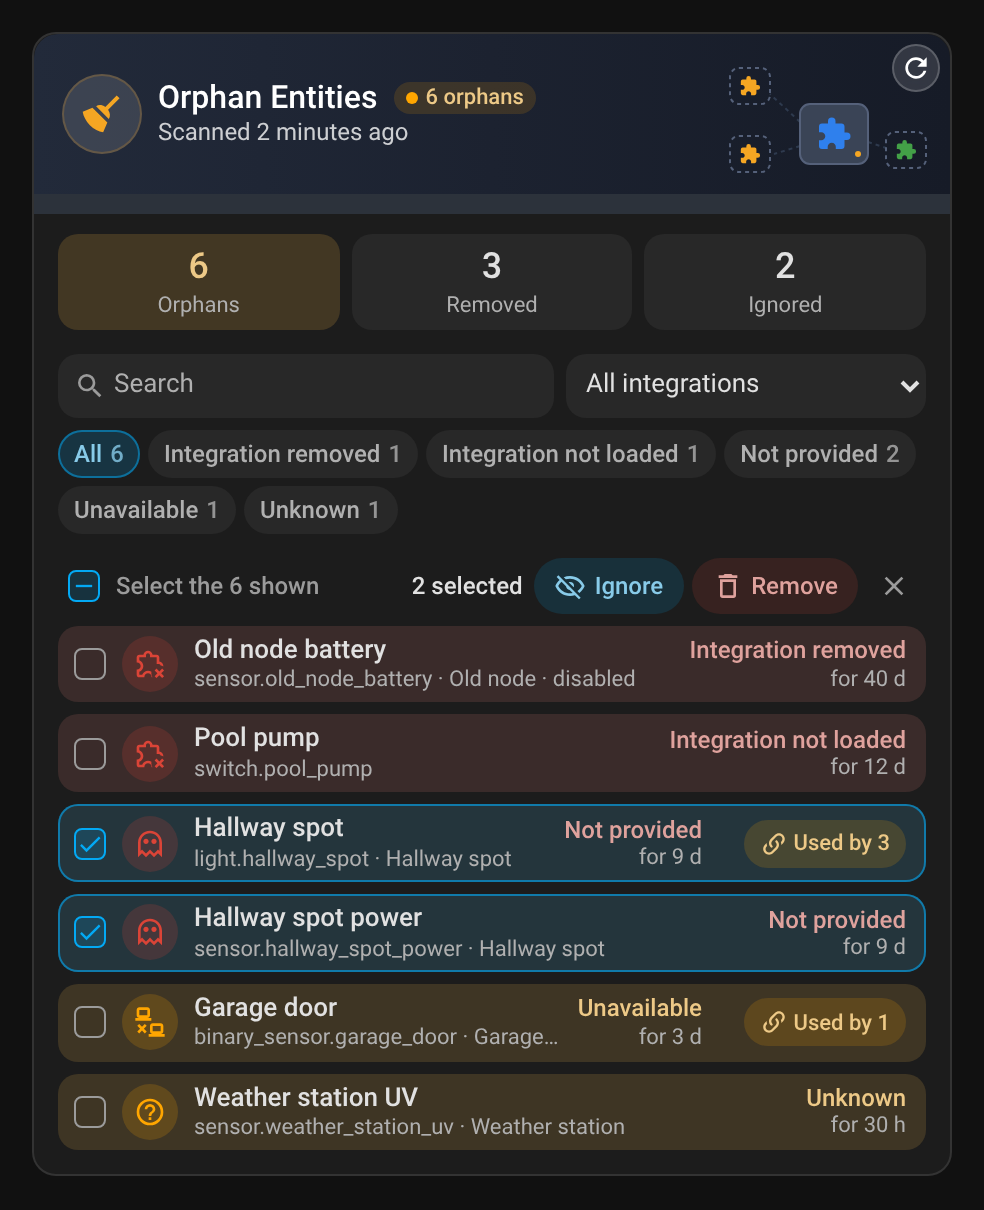 |
| Used by an automation or a dashboard | 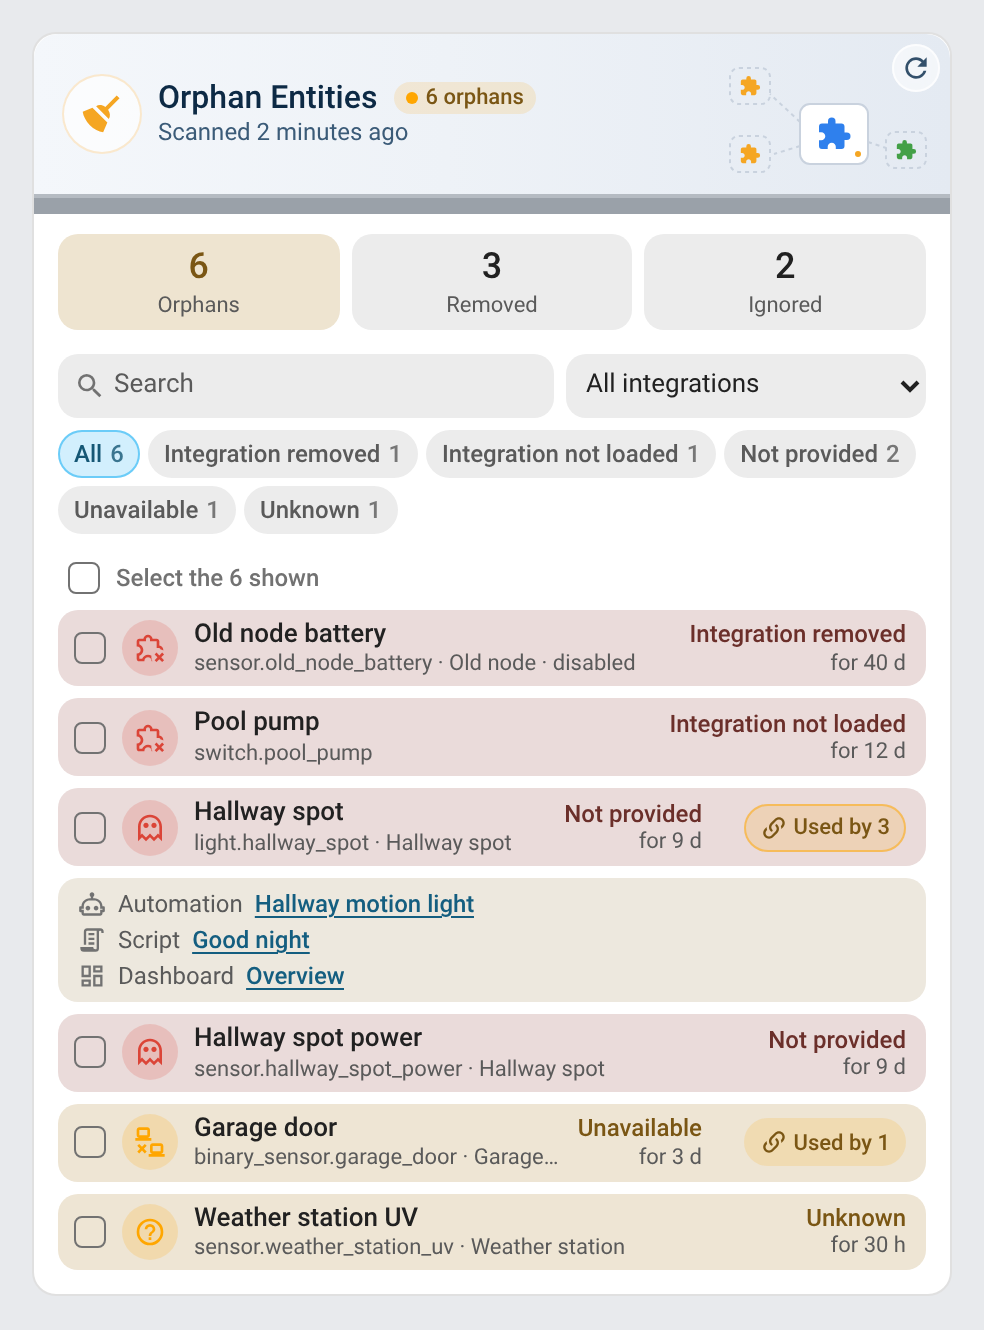 |
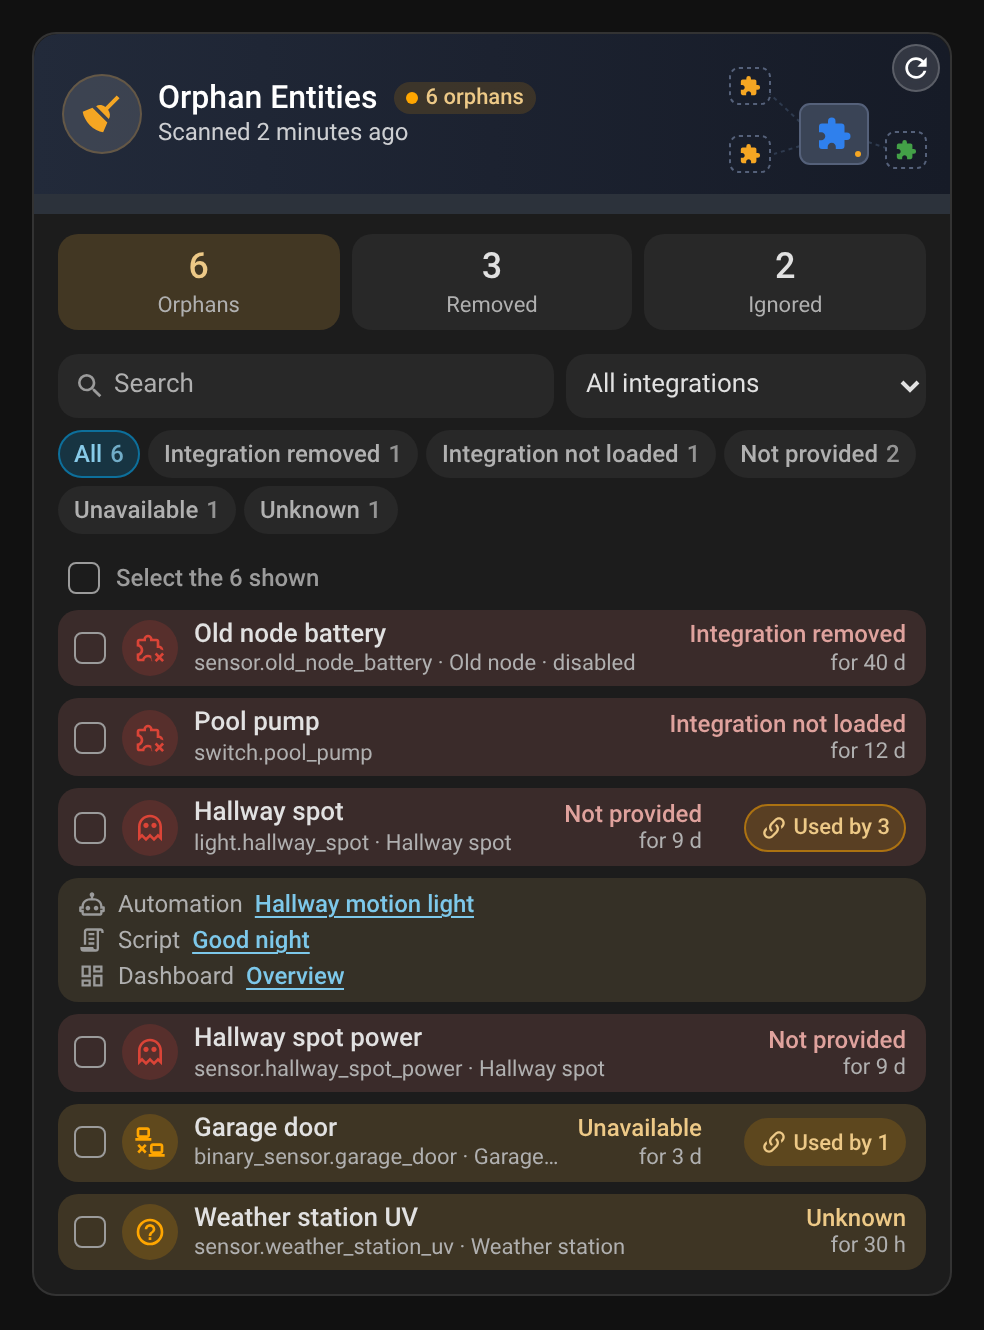 |
| Filtered on a reason | 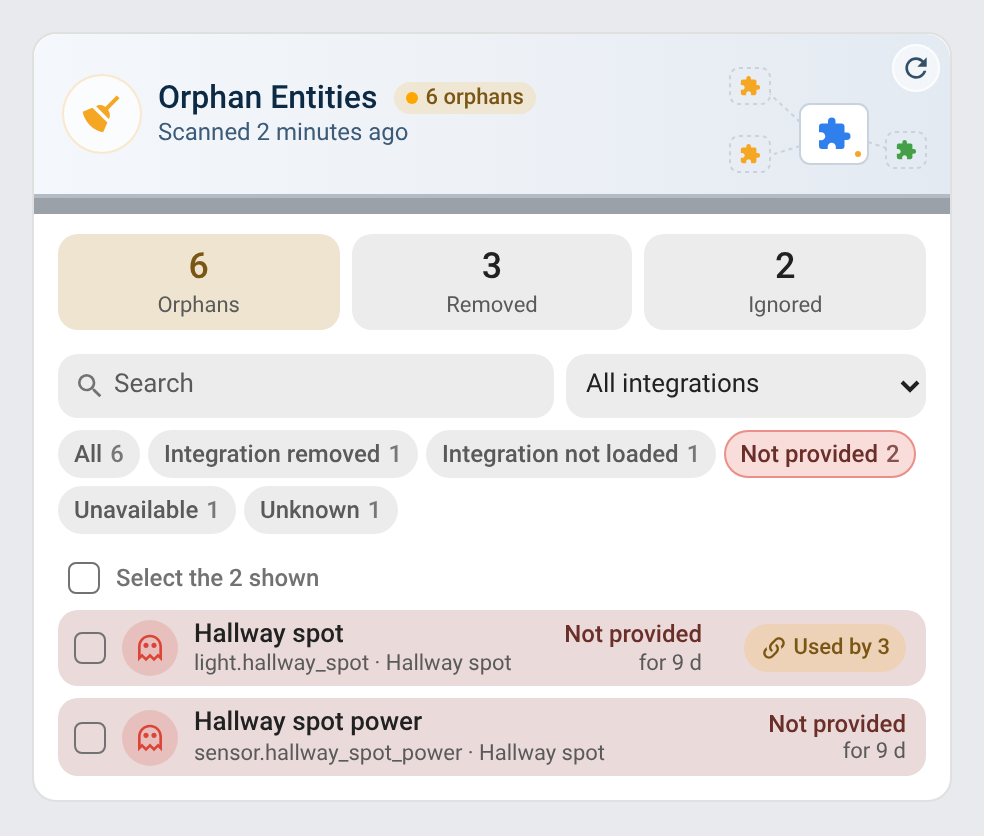 |
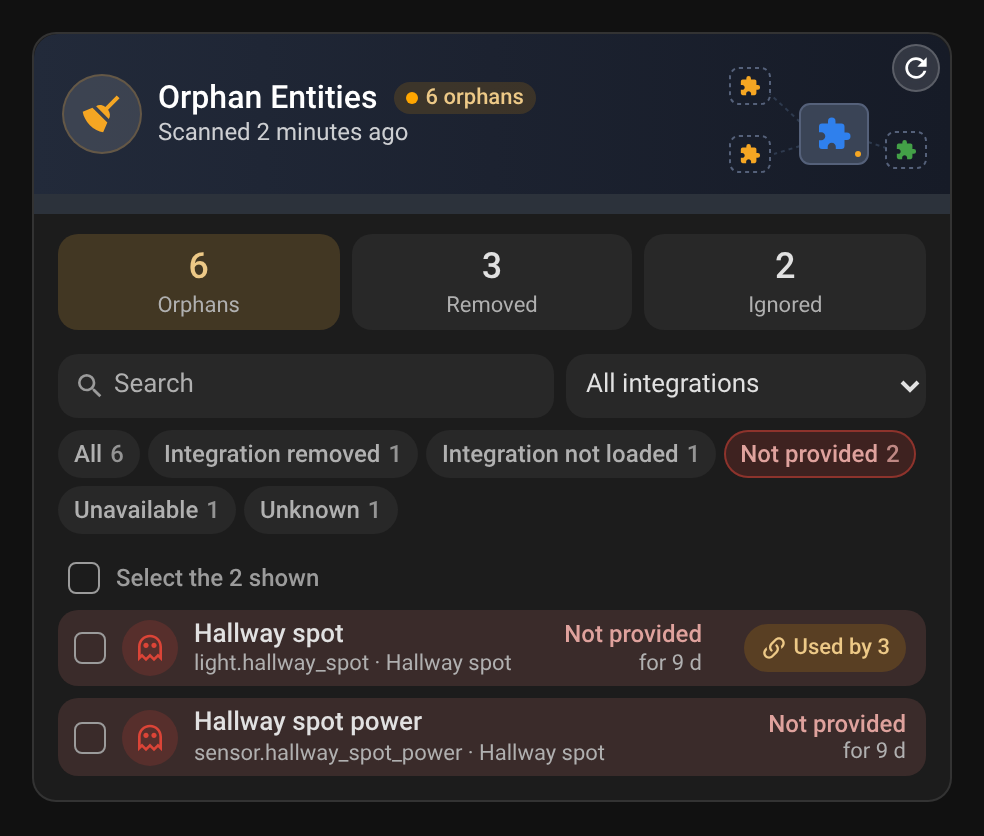 |
| No orphan | 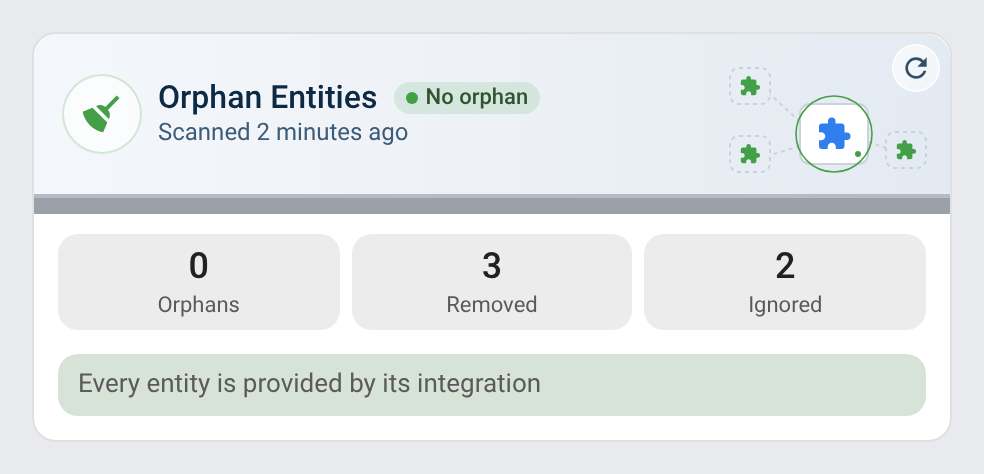 |
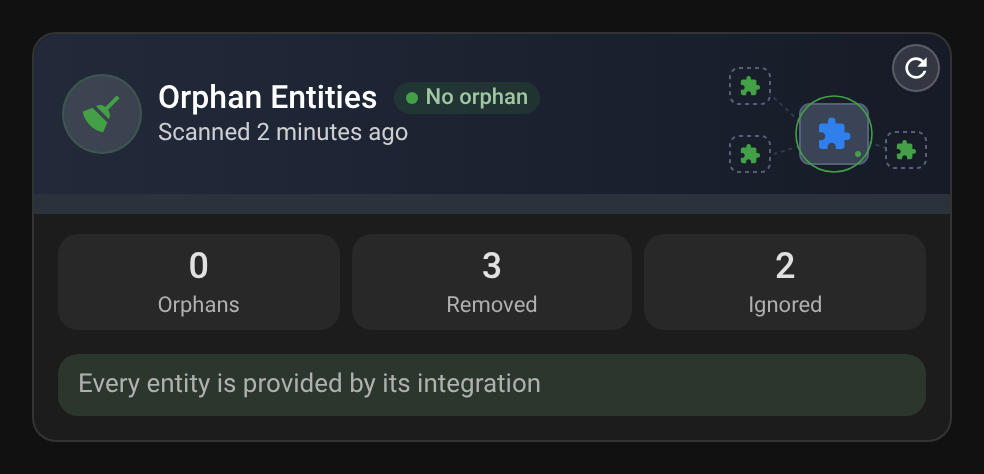 |
| Remove, confirmed | 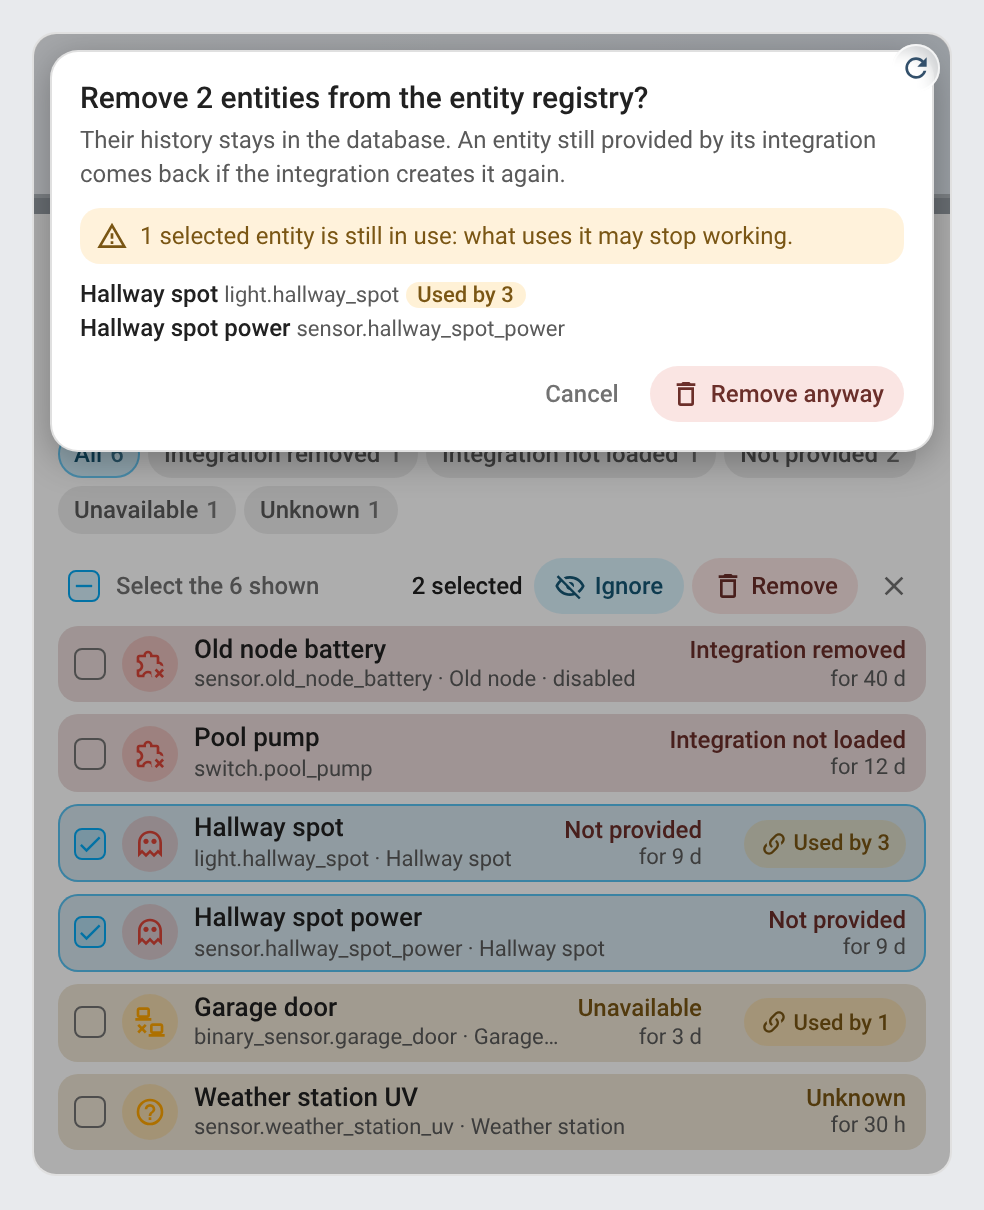 |
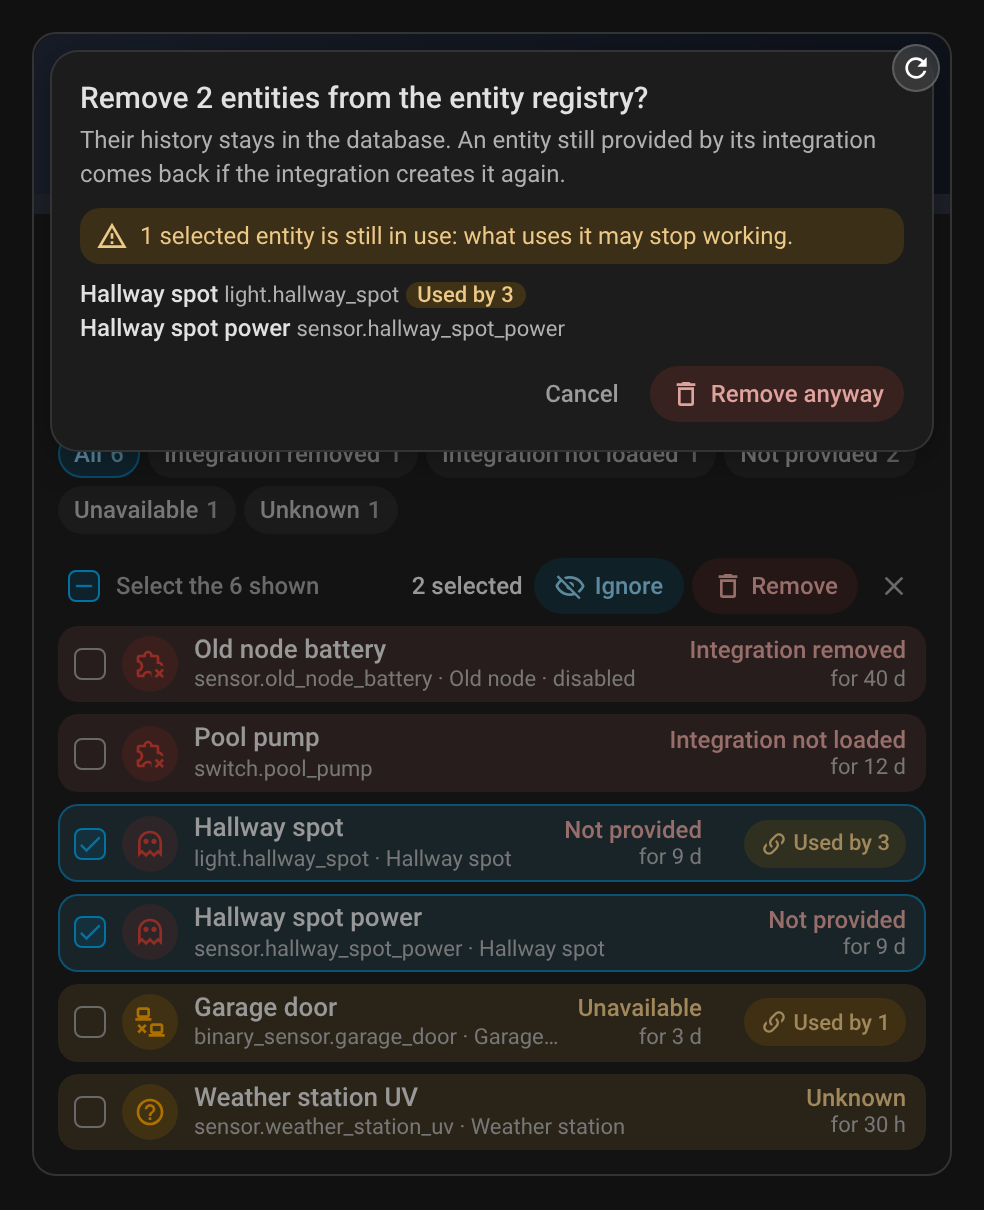 |
| Orphan devices | 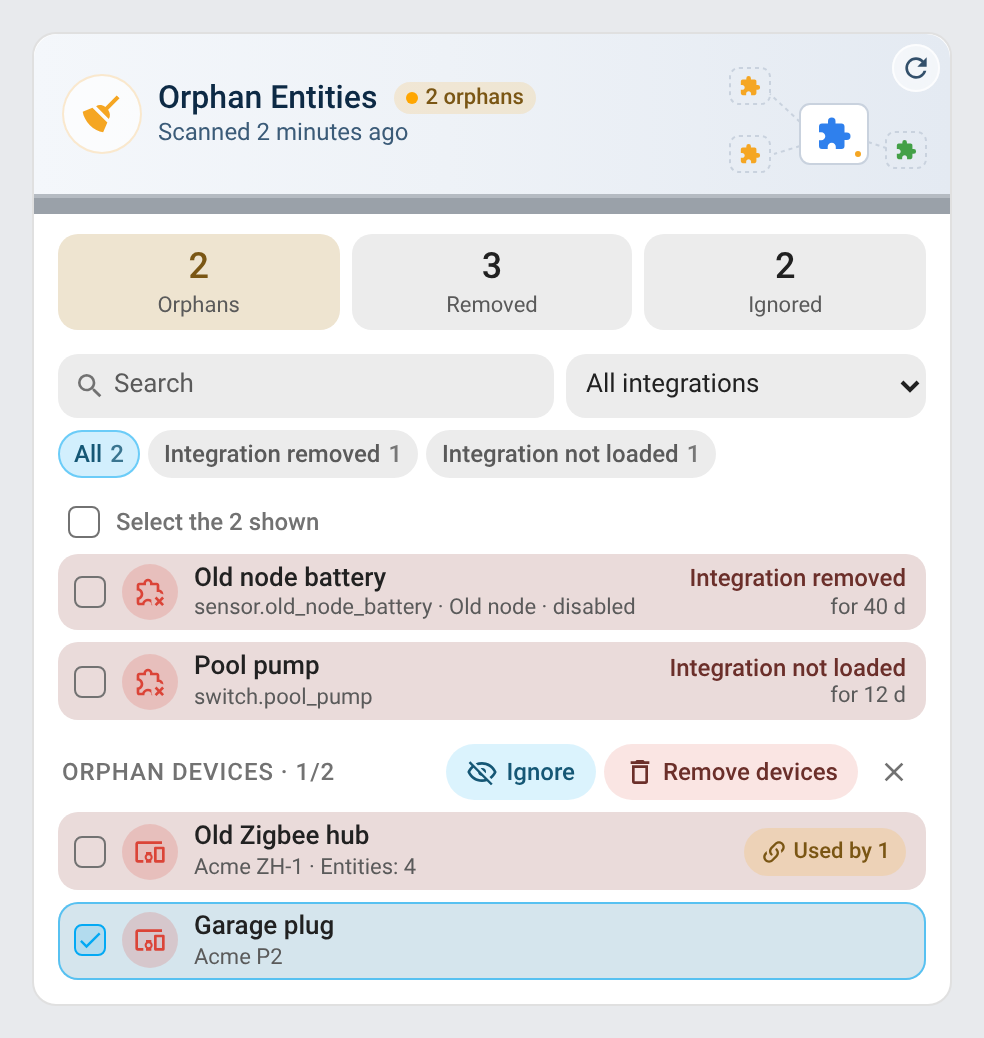 |
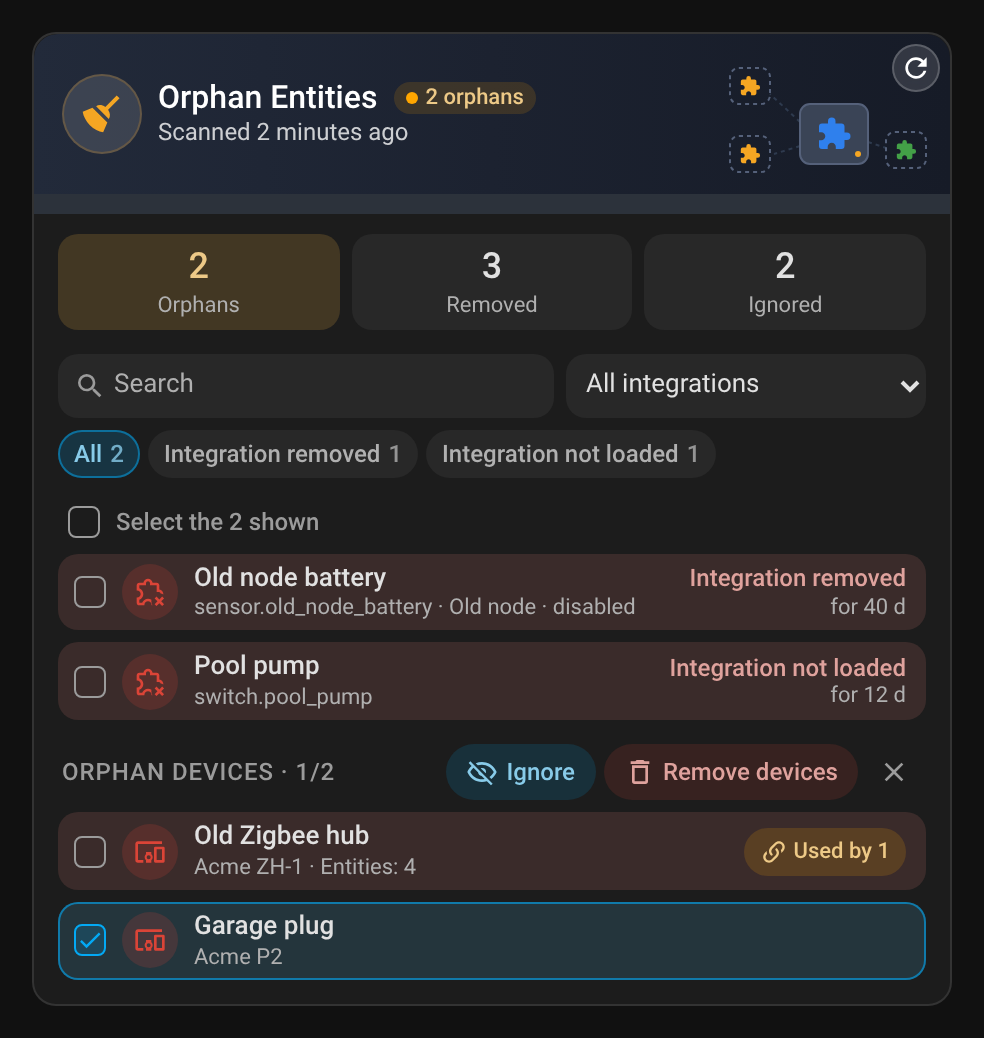 |
| Mini card | 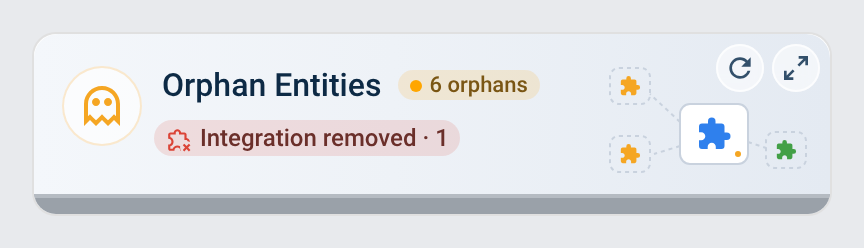 |
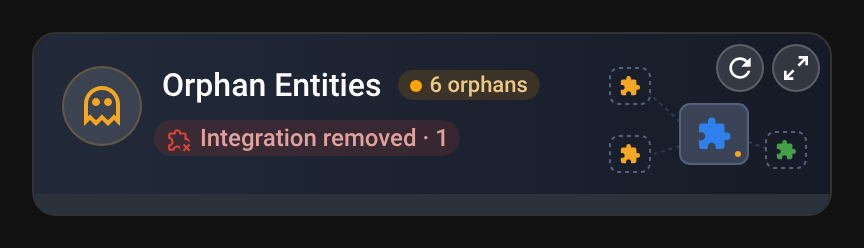 |
| Mini card, no orphan | 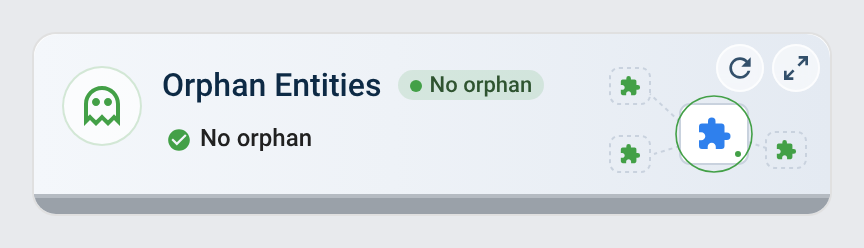 |
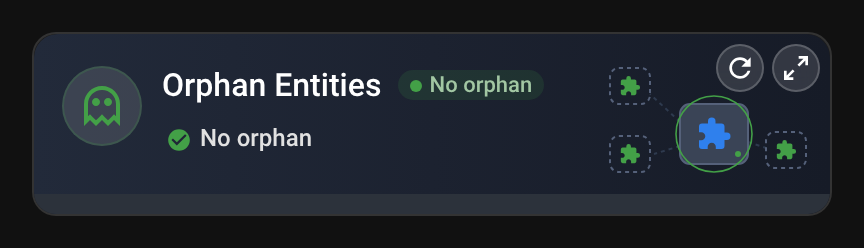 |
| Mini card zoomed in | 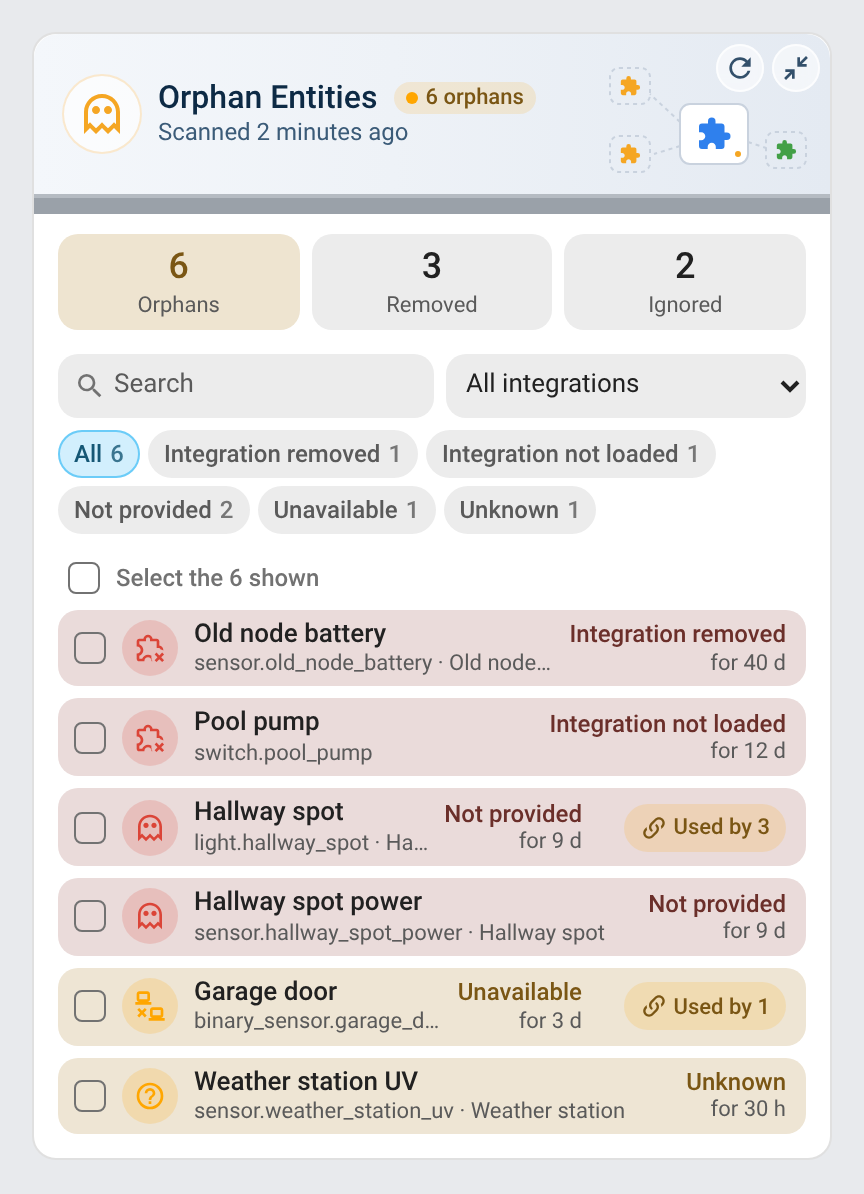 |
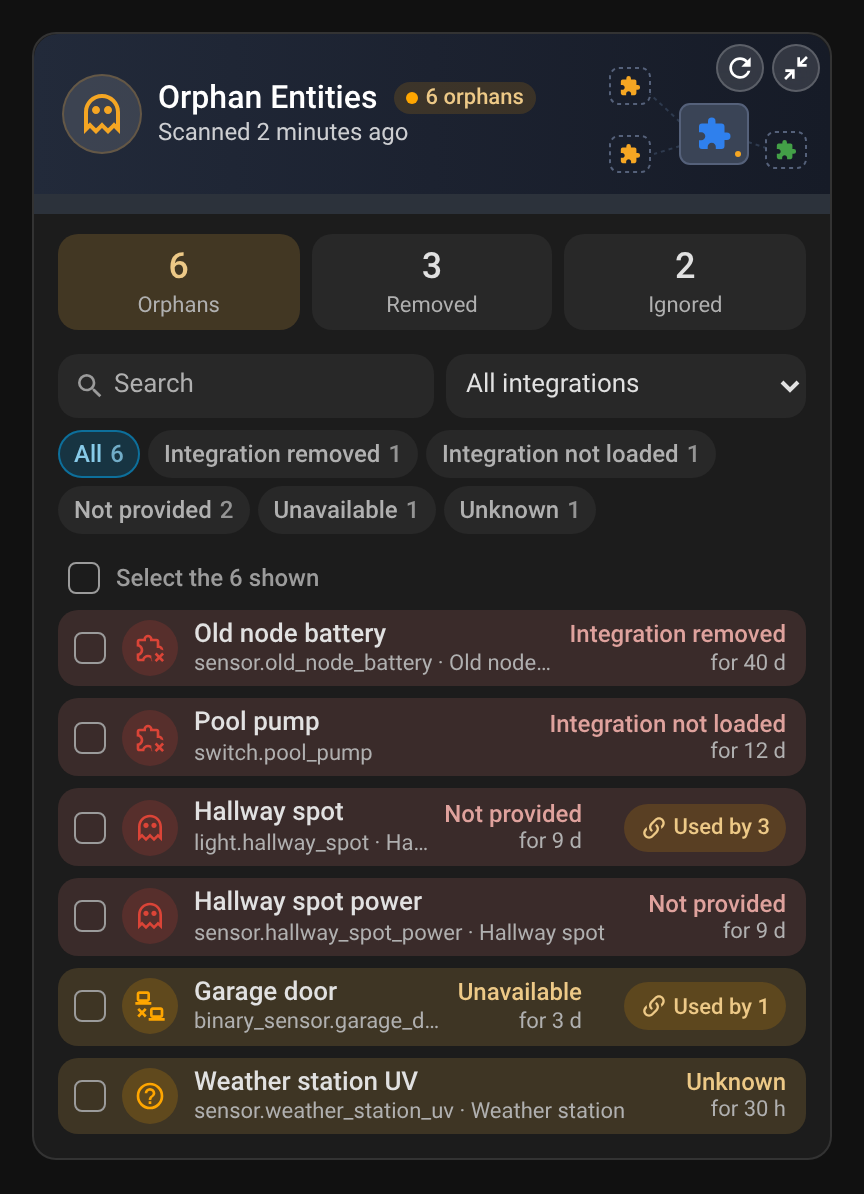 |
Entities
| Entity | Description |
|---|---|
sensor.system_hub_cleanup_orphaned_entities |
Number of orphaned entities; attributes entities (each with entity_id, name, platform, reason, since, entry_title, device, disabled, used_by), devices, counts by reason, removed, truncated and devices_truncated (the attributes list at most 250 of each), next_scan, the ignored integrations and entities |
sensor.system_hub_cleanup_last_scan |
End of the last scan |
button.system_hub_cleanup_scan_now |
Scans now, even within the grace period |
Action system_hub.orphans_scan
Scans now. Fails while Home Assistant is starting. Administrators only.
Action system_hub.orphans_remove
Removes entities listed by the last scan from the entity registry, at most 1000 at a time; refuses the whole request if one is not listed. Returns removed and skipped (no longer orphaned, kept). Administrators only.
action: system_hub.orphans_remove
data:
  entities:
    - sensor.old_temperature
Action system_hub.orphans_remove_devices
Removes orphan devices of the last scan with their entities; without devices, every orphan device of the last scan. Returns removed, skipped and the entities removed with them. Administrators only.
Action system_hub.orphans_ignore
Adds entities (entities) or devices (devices) to the ignored ones: they are dropped from the list at once and saved in Settings → Cleanup ⚙ (System Hub is not reloaded for it). Administrators only.
Events
| Event | Fired when | Data |
|---|---|---|
system_hub_orphans_removed |
Entities were removed (by orphans_remove, or with their devices) |
entities |
system_hub_orphans_devices_removed |
Orphan devices were removed | devices |
Migrating
System Hub replaces Integration Watchdog, Marketplace Refresh, Battery Monitor, Git Sync and Orphan Entities, the System Monitor cards of ha-system-monitor-card and the Automation Monitor cards of ha-automation-monitor-card (same card types). These repositories are archived: remove the integrations and their card resources once System Hub is set up, so that nothing runs twice. While one of them is still set up next to System Hub, it raises a repair in Settings → Repairs.
A module turned on for the first time takes over the settings of the integration it replaces: Watchdog (with its ignored integrations and power cycles), Marketplace Refresh, Battery Monitor and Orphan Entities (with its ignored integrations and entities). For Git Sync, the repository form is filled with the standalone integration's repository, remote, SSH key and author, and its schedule, export and notification settings are kept (the repository of the configuration folder when it had several). Battery Monitor's battery types set in its cards and its spare batteries are imported with Settings → Batteries → Import from Battery Monitor. Rename in your automations:
| Before | System Hub |
|---|---|
integration_watchdog.check / .reset |
system_hub.watchdog_check / .watchdog_reset |
integration_watchdog_reloaded / _power_cycled events |
system_hub_integration_reloaded / system_hub_device_power_cycled |
sensor.integration_watchdog_*, button.integration_watchdog_check_now |
sensor.system_hub_sentinel_*, button.system_hub_sentinel_check_now |
marketplace_refresh.check_updates / .check_repository / .install_updates |
system_hub.marketplace_check_updates / .marketplace_check_repository / .marketplace_install_updates |
marketplace_refresh_updates_found event |
system_hub_marketplace_updates_found |
sensor.marketplace_refresh_*, button.marketplace_refresh_check_for_updates |
sensor.system_hub_updates_*, button.system_hub_updates_check_for_updates |
battery_monitor.notify / .set_stock / .export |
system_hub.batteries_notify / .batteries_set_stock / .batteries_export |
battery_monitor_low / _replaced events |
system_hub_battery_low / system_hub_battery_replaced |
sensor.battery_monitor_*, button.battery_monitor_notify_now |
sensor.system_hub_batteries_*, button.system_hub_batteries_notify_now |
git_sync.commit_push / .pull / .generate_message / .get_diff / .export_dashboards / .generate_ssh_key |
system_hub.git_sync_commit_push / .git_sync_pull / … (repository, a path or id, instead of config_entry_id; the first repository's result at the top of the response, and results with several repositories) |
git_sync_committed / git_sync_exported events |
system_hub_git_committed / system_hub_dashboards_exported |
sensor.git_sync_<repo>_*, button.git_sync_<repo>_* |
sensor.system_hub_versioning_*, button.system_hub_versioning_* |
orphan_entities.scan / .remove / .remove_devices / .ignore |
system_hub.orphans_scan / .orphans_remove / .orphans_remove_devices / .orphans_ignore |
orphan_entities_removed / _devices_removed events |
system_hub_orphans_removed / system_hub_orphans_devices_removed |
sensor.orphan_entities_*, button.orphan_entities_scan_now |
sensor.system_hub_cleanup_*, button.system_hub_cleanup_scan_now |
ha-orphan-entities is replaced by the Orphans module: its cards are now custom:system-hub-card and custom:system-hub-mini-card with module: orphans, moved at System Hub's next start; once Orphan Entities is removed, point a card's entity (if set) to the Cleanup module's Orphaned entities sensor. Its ignored integrations and entities are taken over when the Orphans module is turned on.
Translations
English, French, German, Spanish, Italian, Dutch, Portuguese (Portugal and Brazil), Polish, Romanian, Danish, Swedish, Bulgarian, Russian, Ukrainian, Hungarian, Slovak, Czech, Slovenian, Latvian, Greek and Serbian (Cyrillic and Latin).
License
Support
If you find this project useful, you can support its development: