
josephmachado/beginner_de_project
josephmachado/beginner_de_project has 617 GitHub stars and 208 forks. GitHot measured +1 stars in 24 hours and +2 in 7 days. Last checked 2026-11-10 03:28 UTC. Last push 2026-04-13.
Beginner data engineering project - batch edition
Measured star growth
- in 24h
- +1
- in 7 days
- +2
- in 15 days
- Collecting history
- in 1 month
- Collecting history
Net star changes over overlapping periods, not daily totals. Missing measurements are left blank. Stars measure attention, not software quality.
README.md
OriginalBeginner DE Project - Batch Edition
Code for blog at Data Engineering Project for Beginners.
Run Data Pipeline
Code available at beginner_de_project repository.
Run on codespaces
You can run this data pipeline using GitHub codespaces. Follow the instructions below.
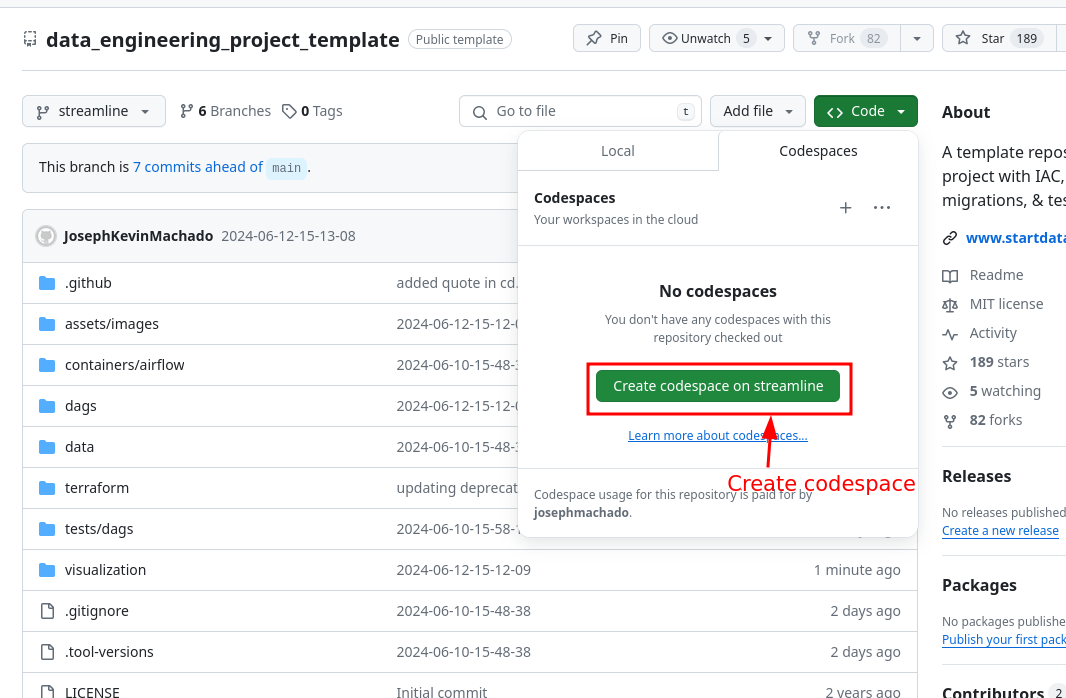
- Create codespaces by going to the beginner_de_project repository, cloning it(or click
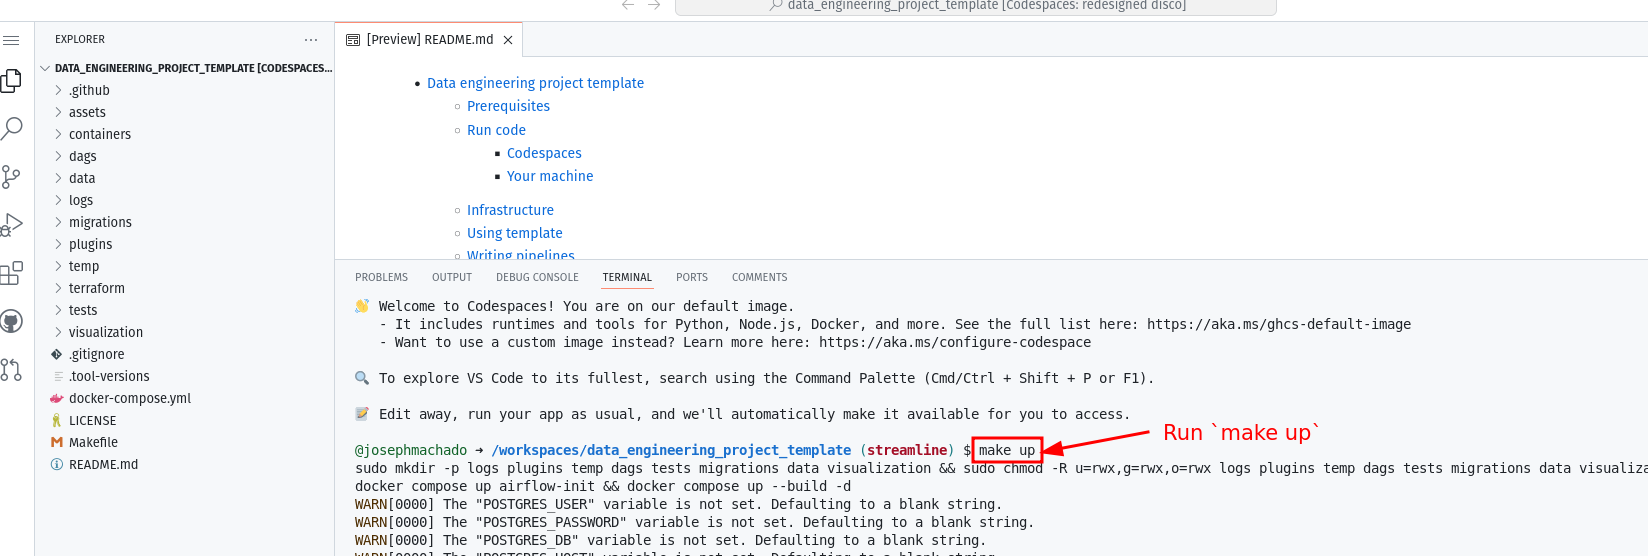
Use this templatebutton) and then clicking onCreate codespaces on mainbutton. - Wait for codespaces to start, then in the terminal type
make up. - Wait for
make upto complete, and then wait for 30s (for Airflow to start). - After 30s go to the
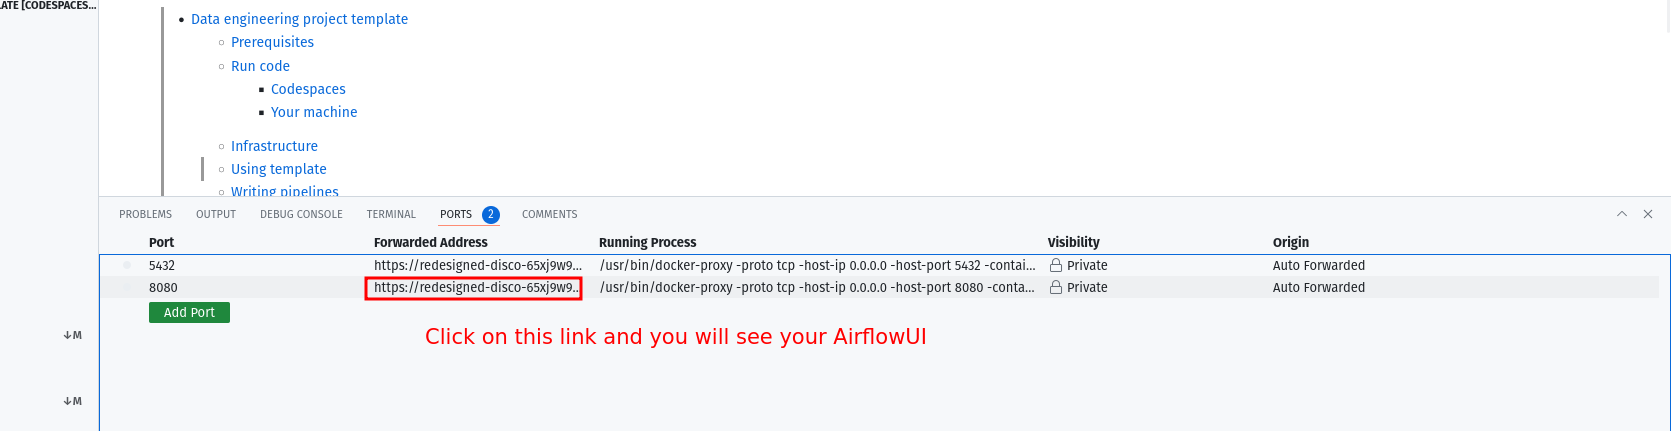
portstab and click on the link exposing port8080to access Airflow UI (username and password isairflow).
Note Make sure to switch off codespaces instance, you only have limited free usage; see docs here.
Run locally
To run locally, you need:
- git
- Github account
- Docker with at least 4GB of RAM and Docker Compose v1.27.0 or later
Clone the repo and run the following commands to start the data pipeline:
git clone https://github.com/josephmachado/beginner_de_project.git
cd beginner_de_project
make up
sleep 30 # wait for Airflow to start
make ci # run checks and tests
Go to http:localhost:8080 to see the Airflow UI. Username and password are both airflow.
Architecture
This data engineering project, includes the following:
Airflow: To schedule and orchestrate DAGs.Postgres: To store Airflow's details (which you can see via Airflow UI) and also has a schema to represent upstream databases.DuckDB: To act as our warehouseQuarto with Plotly: To convert code inmarkdownformat to html files that can be embedded in your app or servered as is.Apache Spark: To process our data, specifically to run a classification algorithm.minio: To provide an S3 compatible open source storage system.
For simplicity services 1-5 of the above are installed and run in one container defined here.
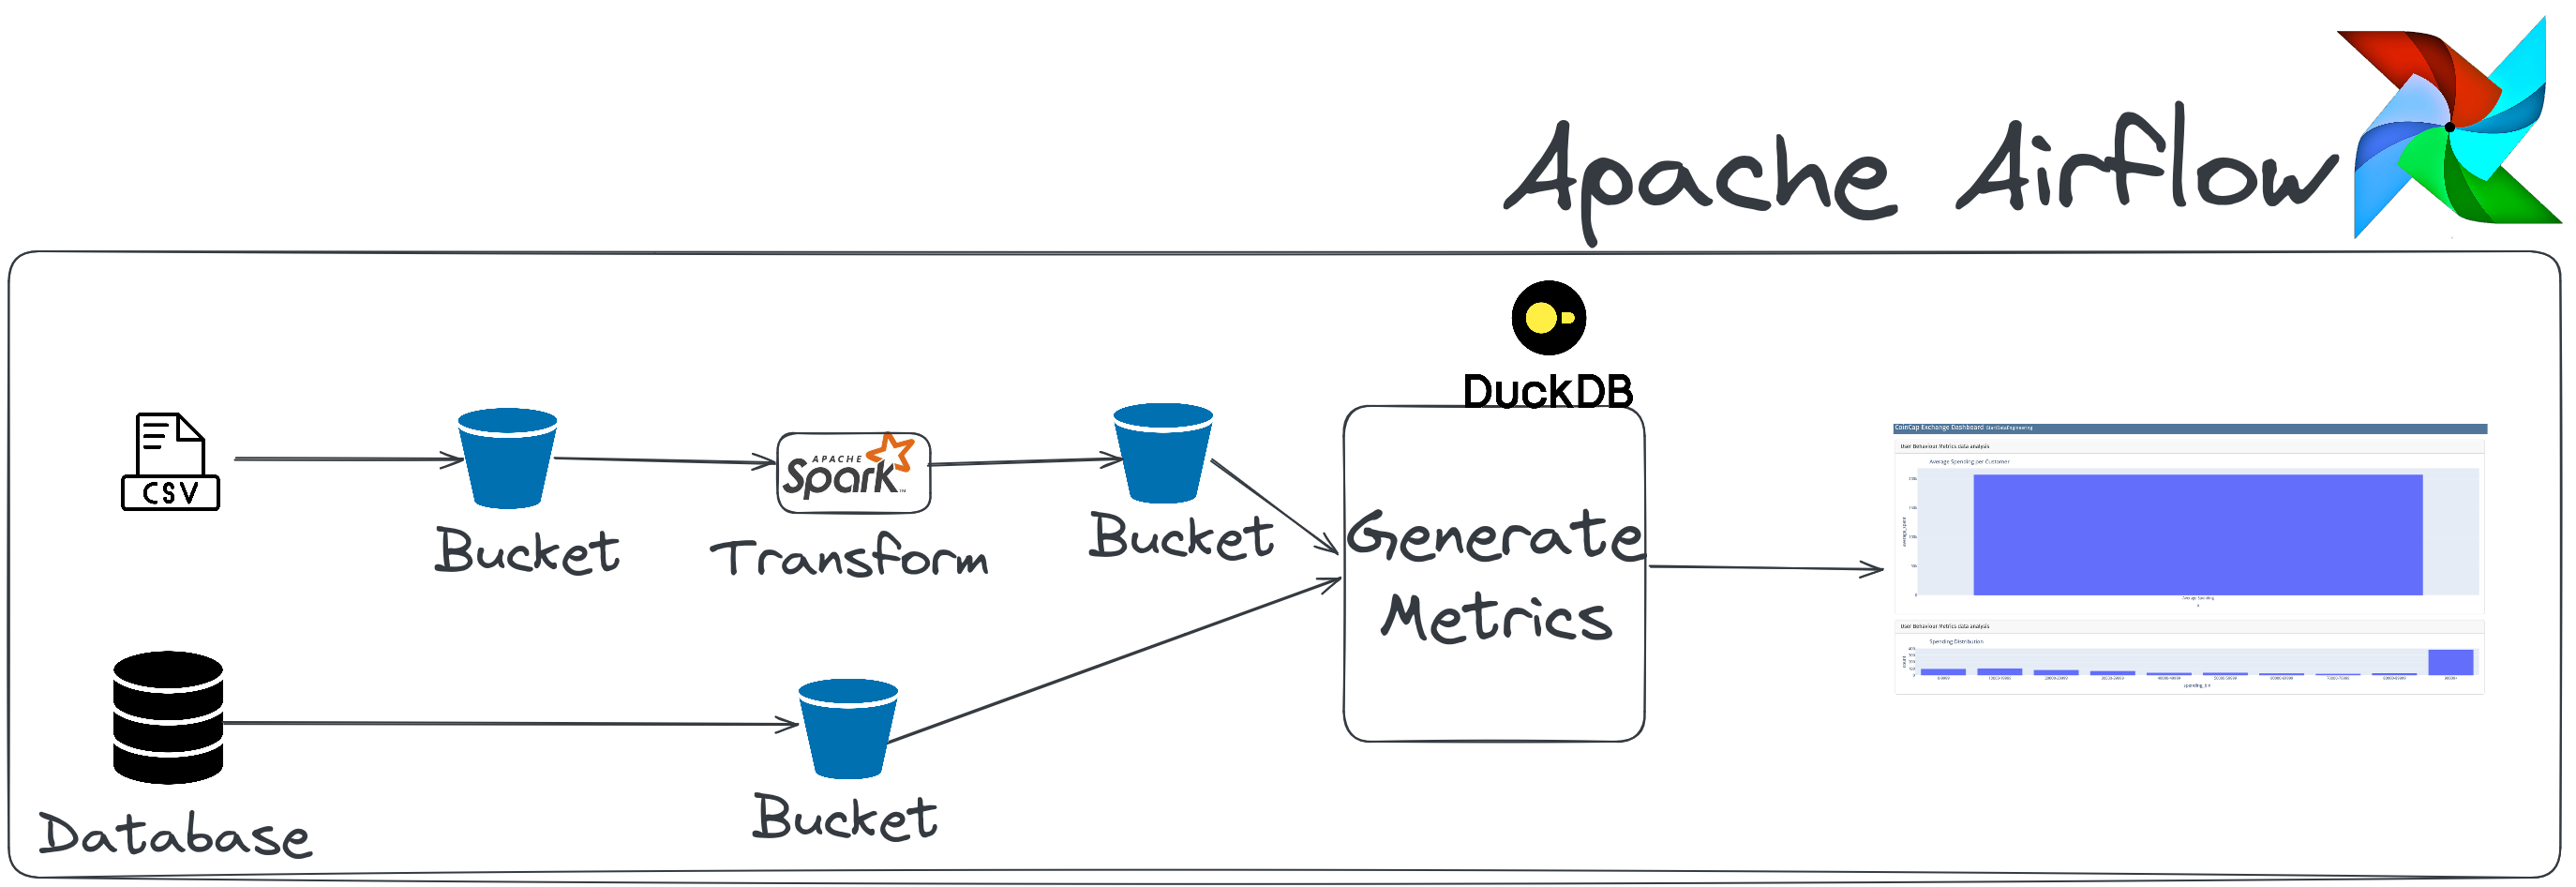
The user_analytics_dag DAG in the Airflow UI will look like the below image:
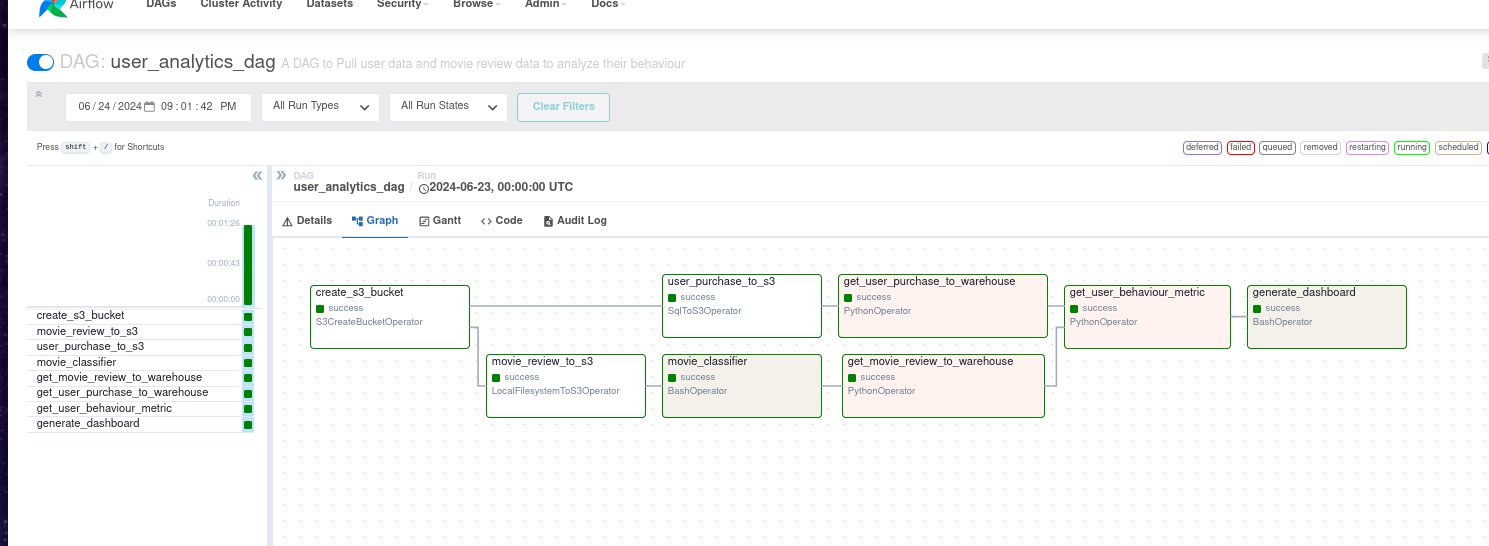
On completion, you can see the dashboard html rendered at./dags/scripts/dashboard/dashboard.html.
Read this post, for information on setting up CI/CD, IAC(terraform), "make" commands and automated testing.
Explore related projects
Asabeneh/30-Days-Of-Python
The 30 Days of Python programming challenge is a step-by-step guide to learn the Python programming language in 30 days. This challenge may take more than 100 days. Follow your own pace. These videos may help too: https://www.youtube.com/channel/UC7PNRuno1rzYPb1xLa4yktw
78,486 starsgrafana/grafana
The open and composable observability and data visualization platform. Visualize metrics, logs, and traces from multiple sources like Prometheus, Loki, Elasticsearch, InfluxDB, Postgres and many more.
77,790 starsredis/redis
For developers, who are building real-time data-driven applications, Redis is the preferred, fastest, and most feature-rich cache, data structure server, and document and vector query engine.
77,332 starsapache/superset
Apache Superset is a Data Visualization and Data Exploration Platform
75,455 stars