
jonnyhyman/Chaos
jonnyhyman/Chaos has 1,968 GitHub stars and 305 forks. GitHot measured 0 stars in 24 hours. Last checked 2026-11-07 00:48 UTC. Last push 2023-10-17.
Visualizations of the connections between chaos theory and fractals through the logistic map; made for Veritasium YouTube video
Measured star growth
- in 24h
- 0
- in 7 days
- Collecting history
- in 15 days
- Collecting history
- in 1 month
- Collecting history
Net star changes over overlapping periods, not daily totals. Missing measurements are left blank. Stars measure attention, not software quality.
README.md
OriginalChaos
Visualizations connecting chaos theory, fractals, and the logistic map!
Written by Jonny Hyman, 2020
This code was developed for this YouTube video from Veritasium
This is not a library, but rather a collection of standalone scripts! As such, there is a bit of code duplication between scripts.
Quick start guide
Install these requirements
- Python 3.6 to 3.10
- pip package :
python -m pip install --upgrade pip - Numpy package :
pip install numpy - Numba package :
pip install numba
Run guide for total beginners
- Open "Terminal" on macOS & Linux, "Powershell" or "Command Prompt" on Windows
- Download this repository and unzip it or run
git clone https://github.com/jonnyhyman/Chaos.git - Change directory into the folder where you extracted files
cd ~/route/to/your/folder - Run the program you're interested in, like
python logistic_interactive.py - To make changes to the code, install a text editor like Visual Studio Code and then open the file you want to edit. If this is your first python project, GO FOR IT, but also it might not be the easiest to get your head wrapped around (I use a lot of nuanced python functionality).
If you run into problems
- Google the problem you're running into
- If it seems to be a problem with this code, check if others are having the same problem in "Issues"
- Post an issue if no one else has encountered the same thing
Logistic Map - Interactive
python logistic_interactive.py
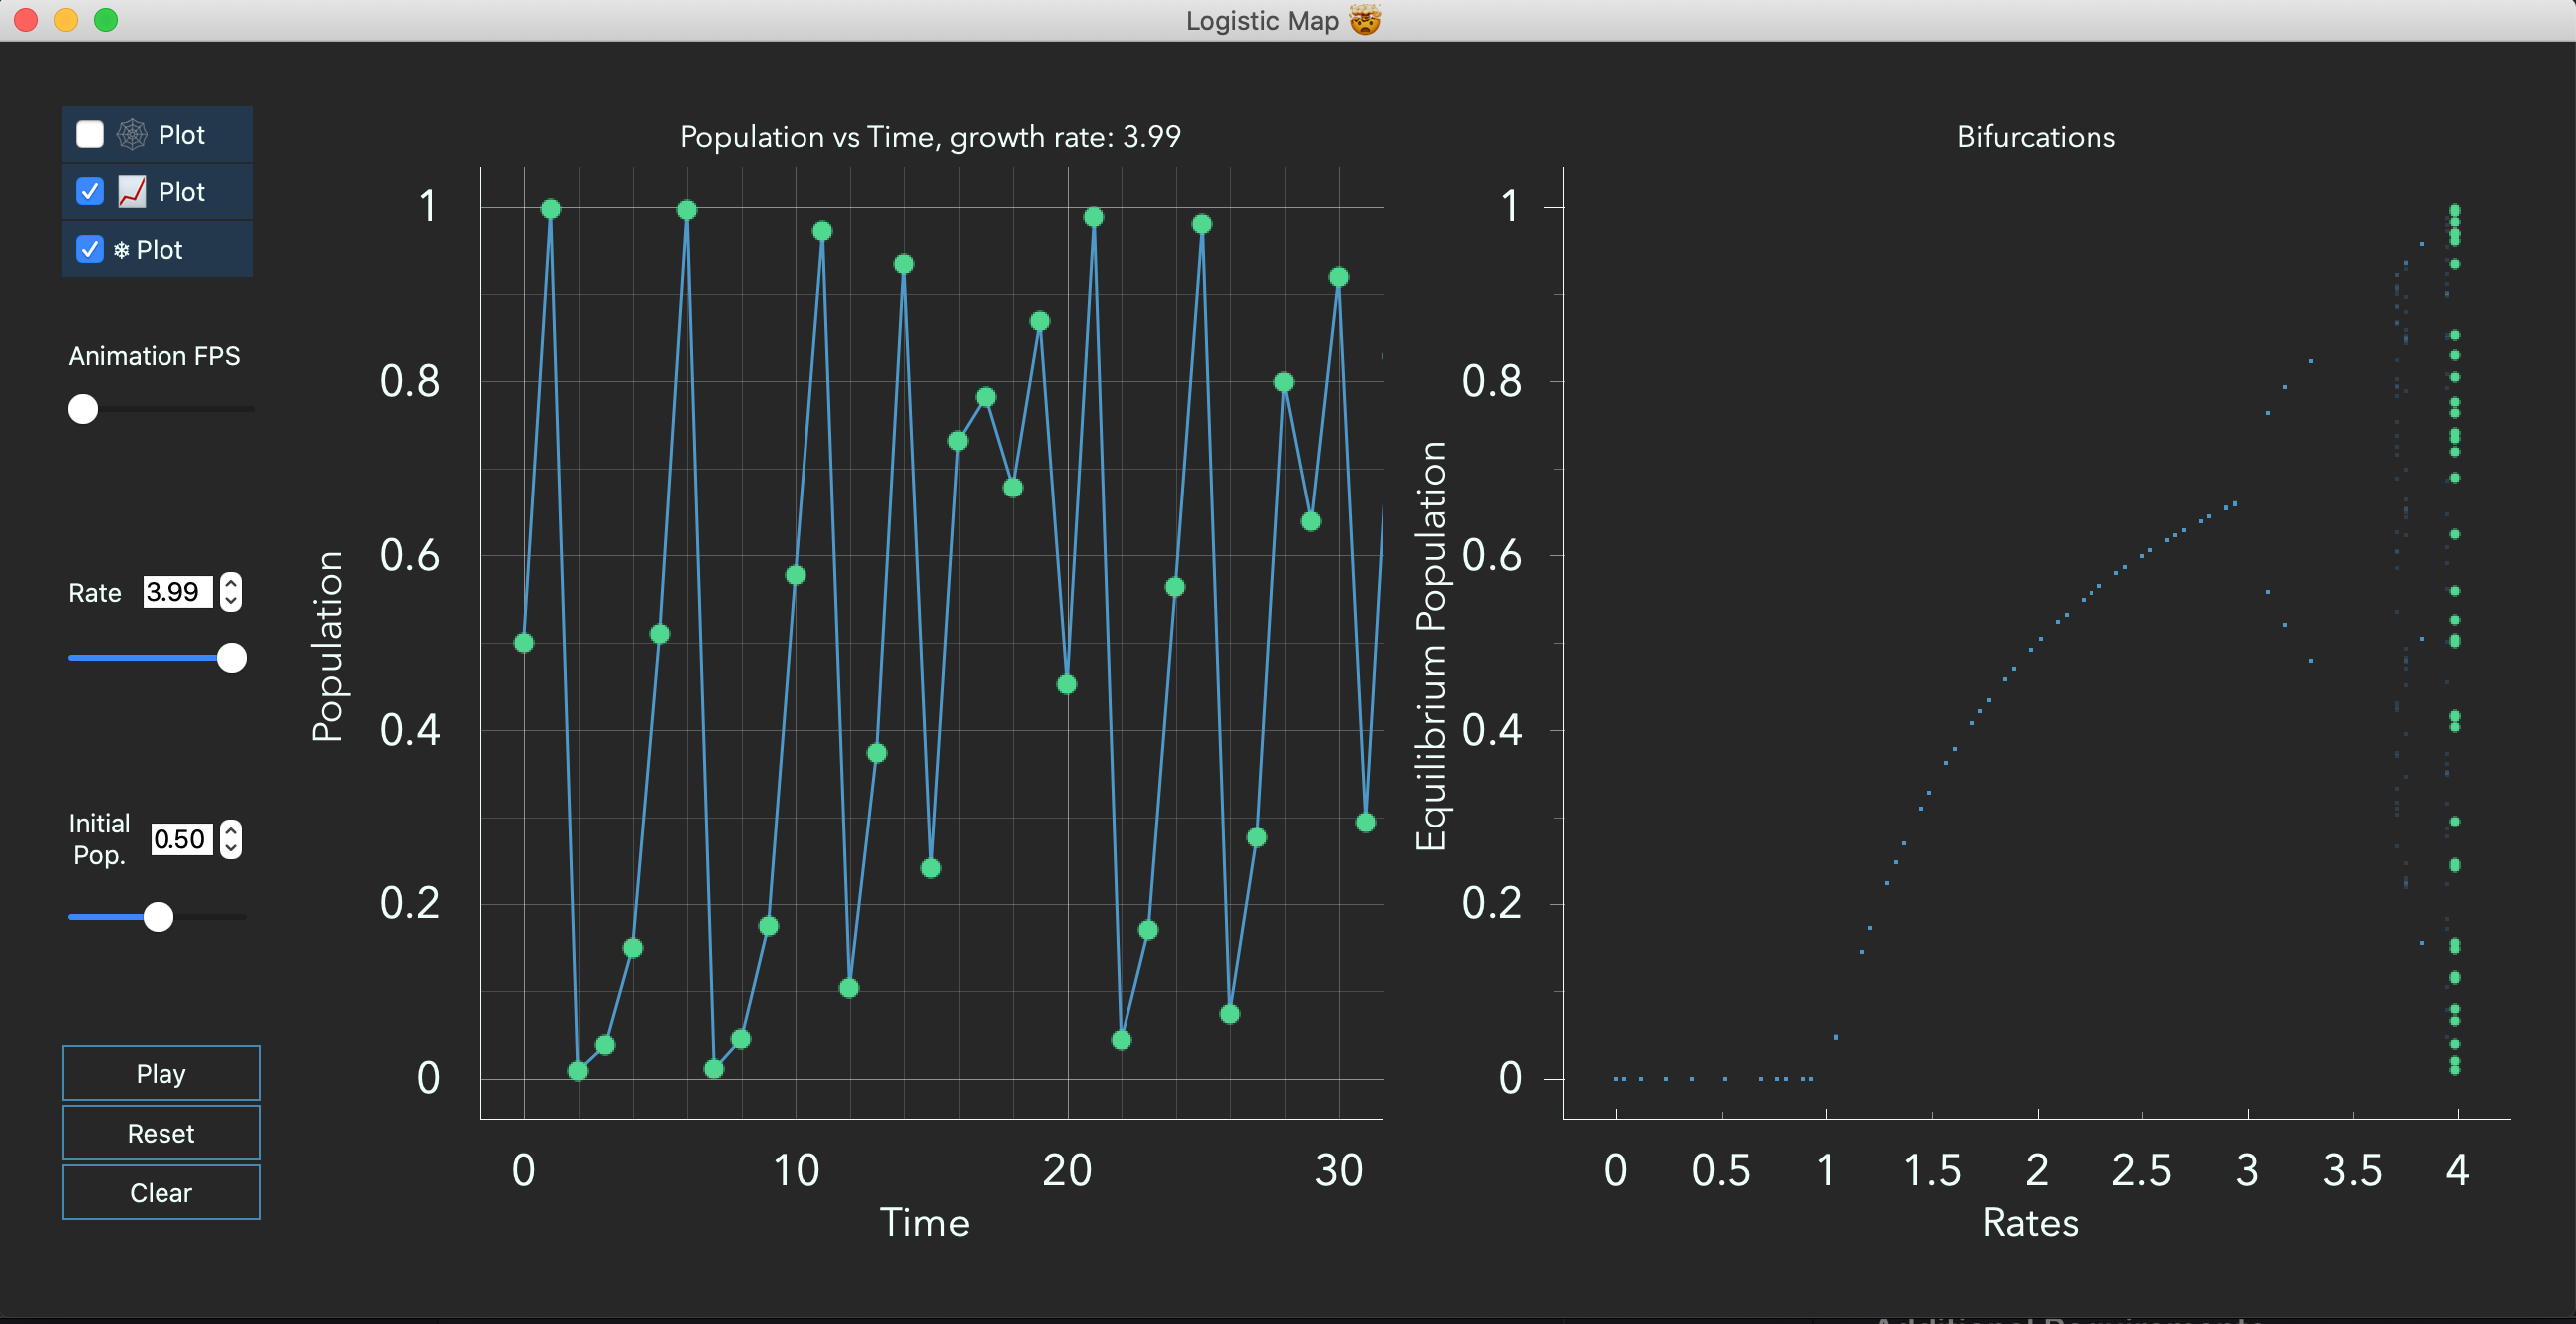
This visualization creates a cobweb plot, time series graph, and bifurcation plot for visualizing the logistic map. The font pictured is "Avenir Next" which is licensed as part of macOS. Other OSes will see their default font.
Shortcuts:
- Spacebar: play/pause
- Backspace: reset view & animation
3D Mandelbrot Set
python logistic_mandelbrot.py

Here we see the Mandelbrot set on the x-y plane, and iterations of the Mandelbrot set in the z axis. This reveals the bifurcation plot beneath the Mandelbrot set!
Final visualization is accomplished by a volume rendering of 1000x1000x1000 voxels, oversampled by 16 to reduce aliasing. At that resolution the visual does not run in realtime.
Logistic Map Zoom
python logistic_zoom.py

- Note: The final version of the visualization used a custom version of Vispy, modified to improve the appearance of axes. I have not released this and don't plan to.
Explore related projects
ytdl-org/youtube-dl
Command-line program to download videos from YouTube.com and other video sites
141,473 starsexcalidraw/excalidraw
Virtual whiteboard for sketching hand-drawn like diagrams
135,243 starsgodotengine/godot
Godot Engine – Multi-platform 2D and 3D game engine
119,710 starsmrdoob/three.js
JavaScript 3D Library.
117,745 stars