
jbengler/tidyplots
jbengler/tidyplots has 716 GitHub stars and 33 forks. GitHot measured 0 stars in 24 hours. Last checked 2026-11-15 18:45 UTC. Last push 2026-11-13.
Measured star growth
- in 24h
- 0
- in 7 days
- Collecting history
- in 15 days
- Collecting history
- in 1 month
- Collecting history
Net star changes over overlapping periods, not daily totals. Missing measurements are left blank. Stars measure attention, not software quality.
About
Tidy Plots for Scientific Papers
Developer ToolsREADME.md
Originaltidyplots 

The goal of tidyplots is to streamline the creation of
publication-ready plots for scientific papers. It allows to gradually
add, remove and adjust plot components using a consistent and intuitive
syntax.
Citation
Engler, Jan Broder. 2025. “Tidyplots Empowers Life Scientists With Easy Code-Based Data Visualization.” iMeta e70018. https://doi.org/10.1002/imt2.70018
Installation
You can install the released version of tidyplots from CRAN with:
install.packages("tidyplots")
And the development version from GitHub with:
# install.packages("pak")
pak::pak("jbengler/tidyplots")
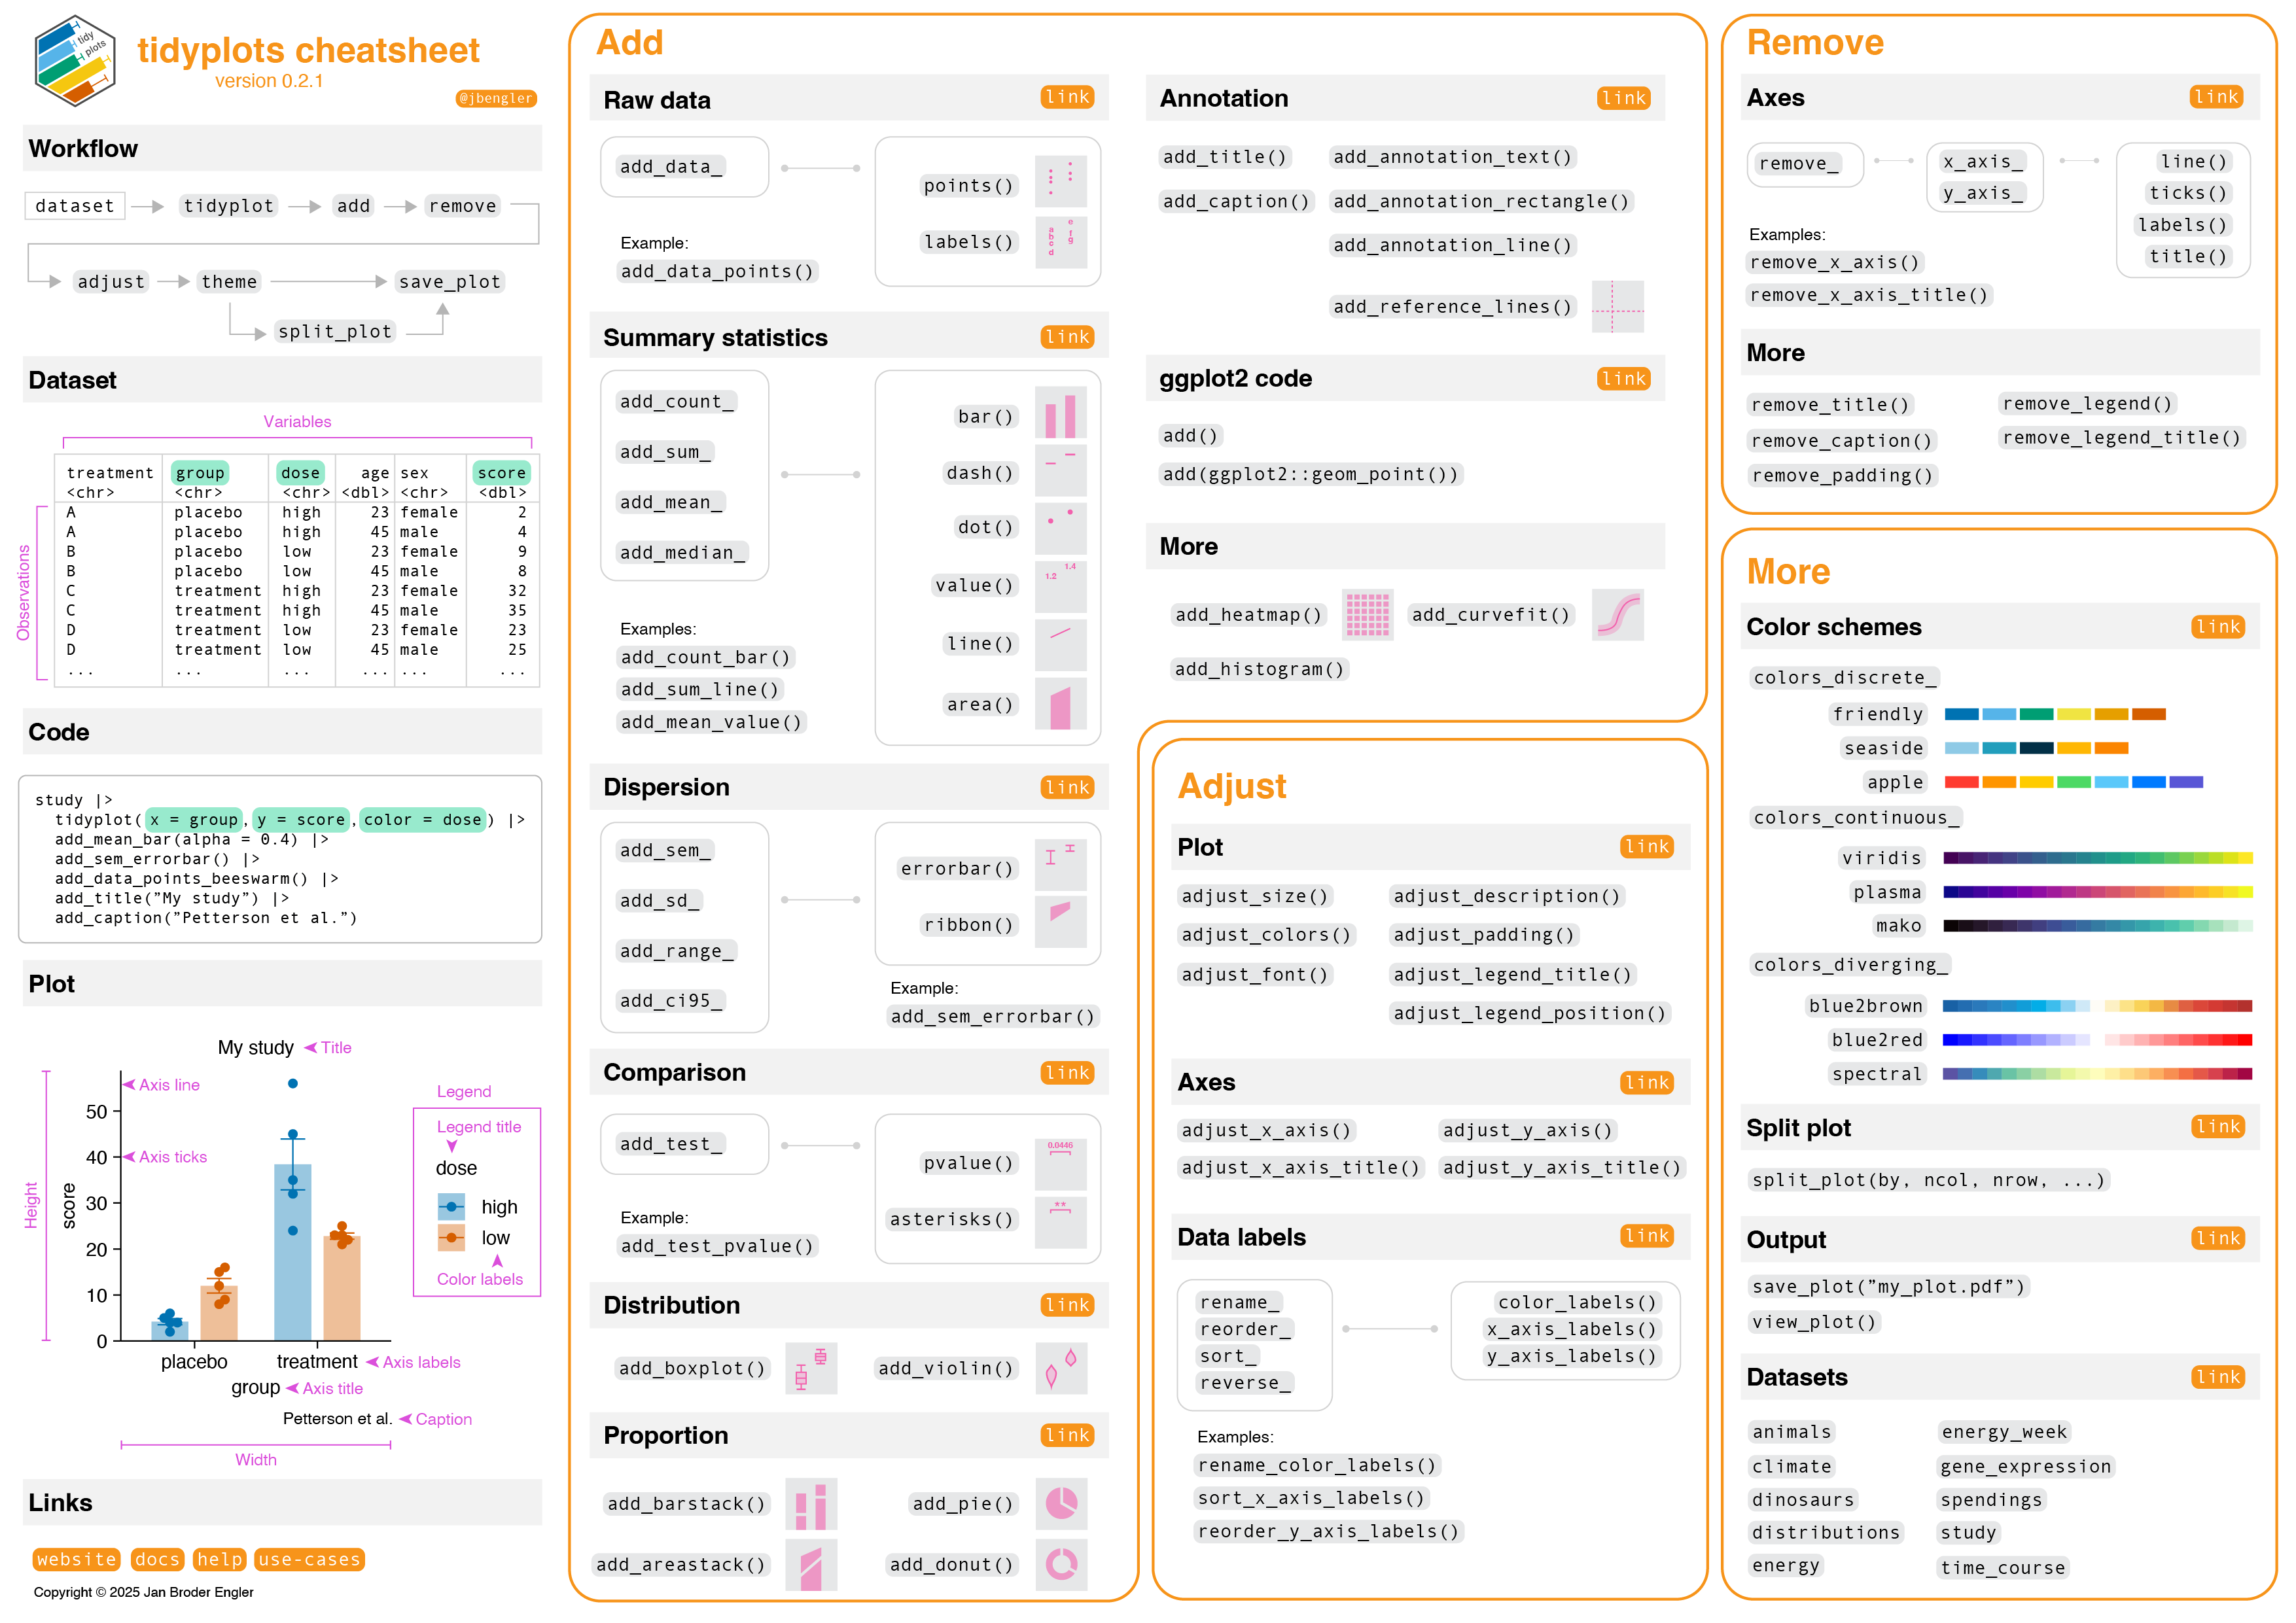
Cheatsheet
This cheatsheet gives a high level overview of available functions.
Usage
Here are some examples.
Also have a look at the getting started guide and the full documentation. For more example plots, check out the tidyplots use cases website.
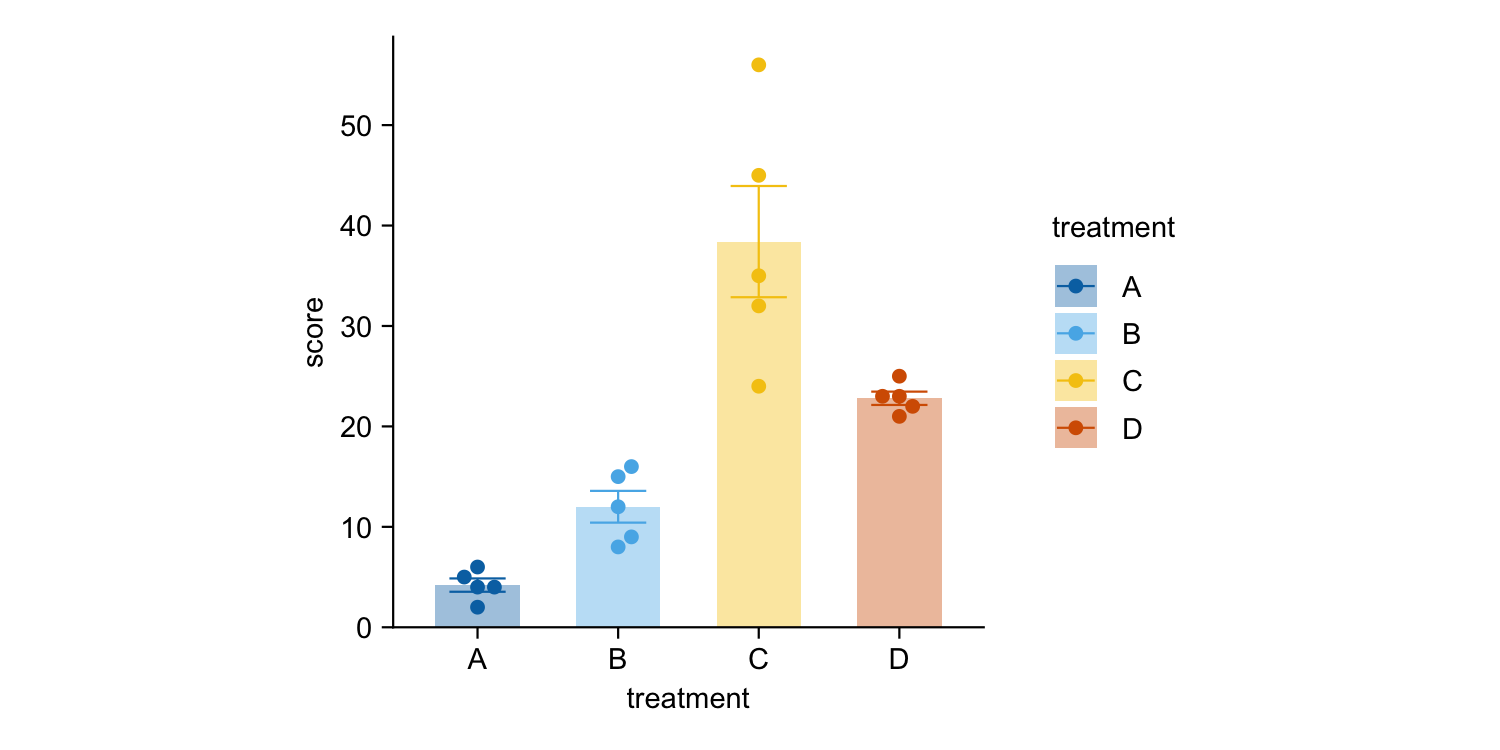
library(tidyplots)

study |>
  tidyplot(x = treatment, y = score, color = treatment) |>
  add_mean_bar(alpha = 0.4) |>
  add_sem_errorbar() |>
  add_data_points_beeswarm()
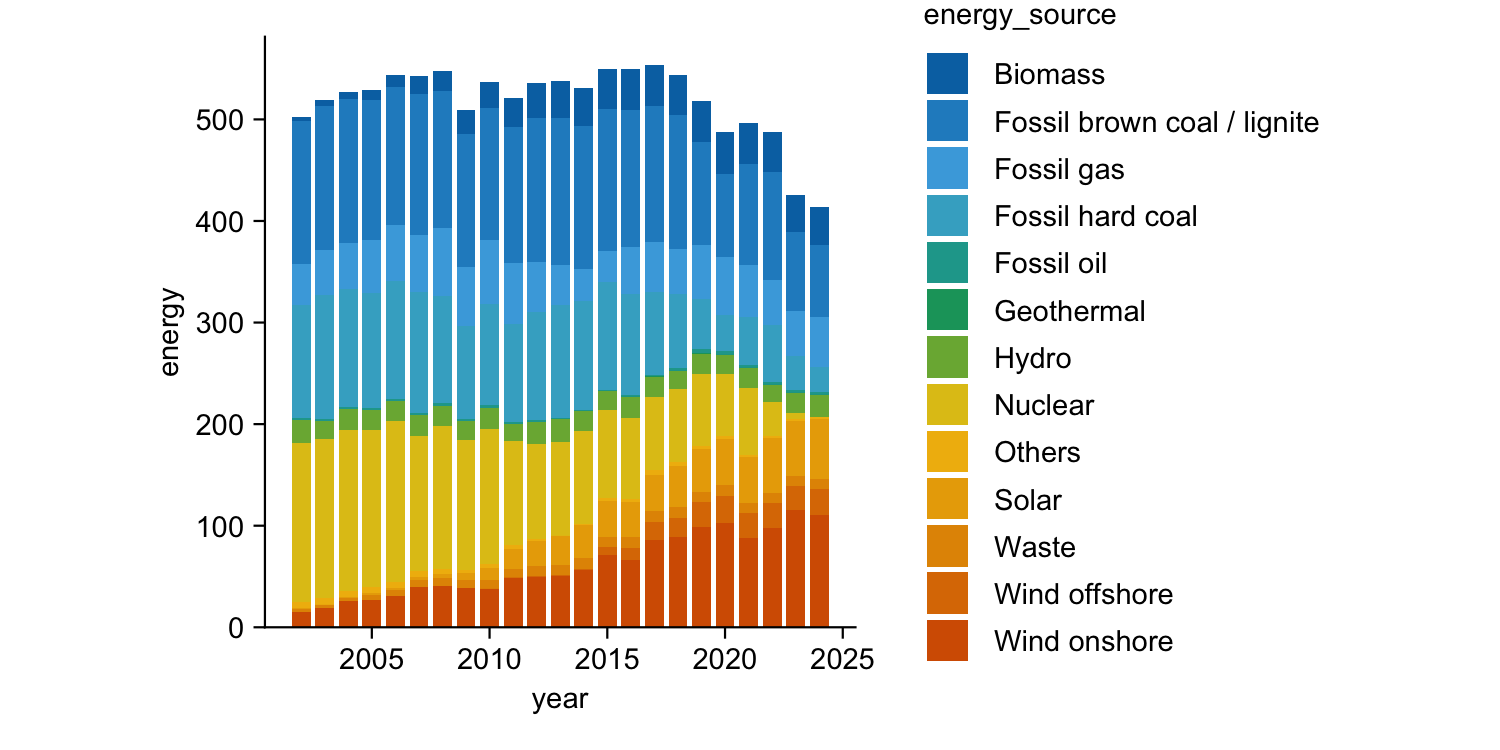
energy |>
  tidyplot(x = year, y = energy, color = energy_source) |>
  add_barstack_absolute()
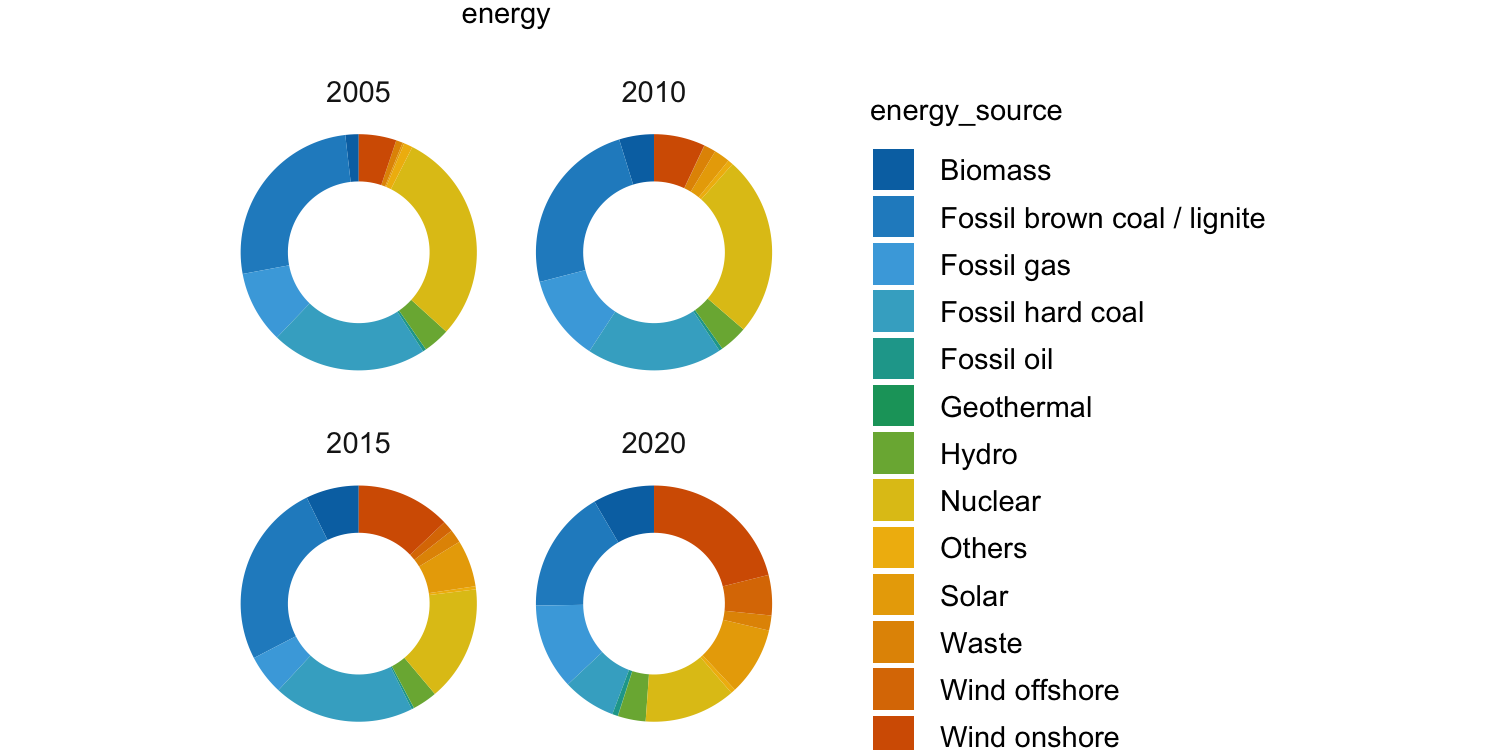
energy |>
  dplyr::filter(year %in% c(2005, 2010, 2015, 2020)) |>
  tidyplot(y = energy, color = energy_source) |>
  add_donut() |>
  adjust_size(width = 25, height = 25) |>
  split_plot(by = year)
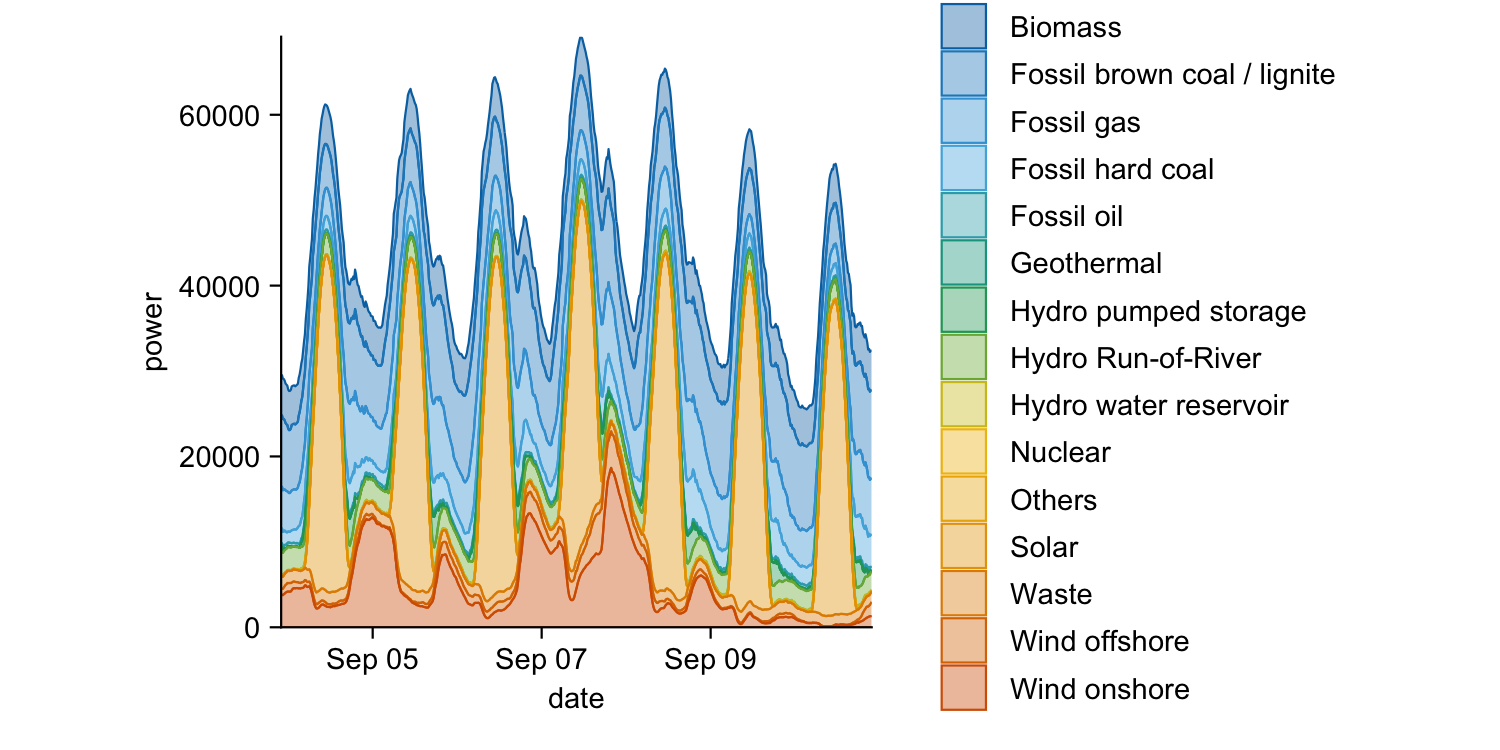
energy_week |>
  tidyplot(x = date, y = power, color = energy_source) |>
  add_areastack_absolute()
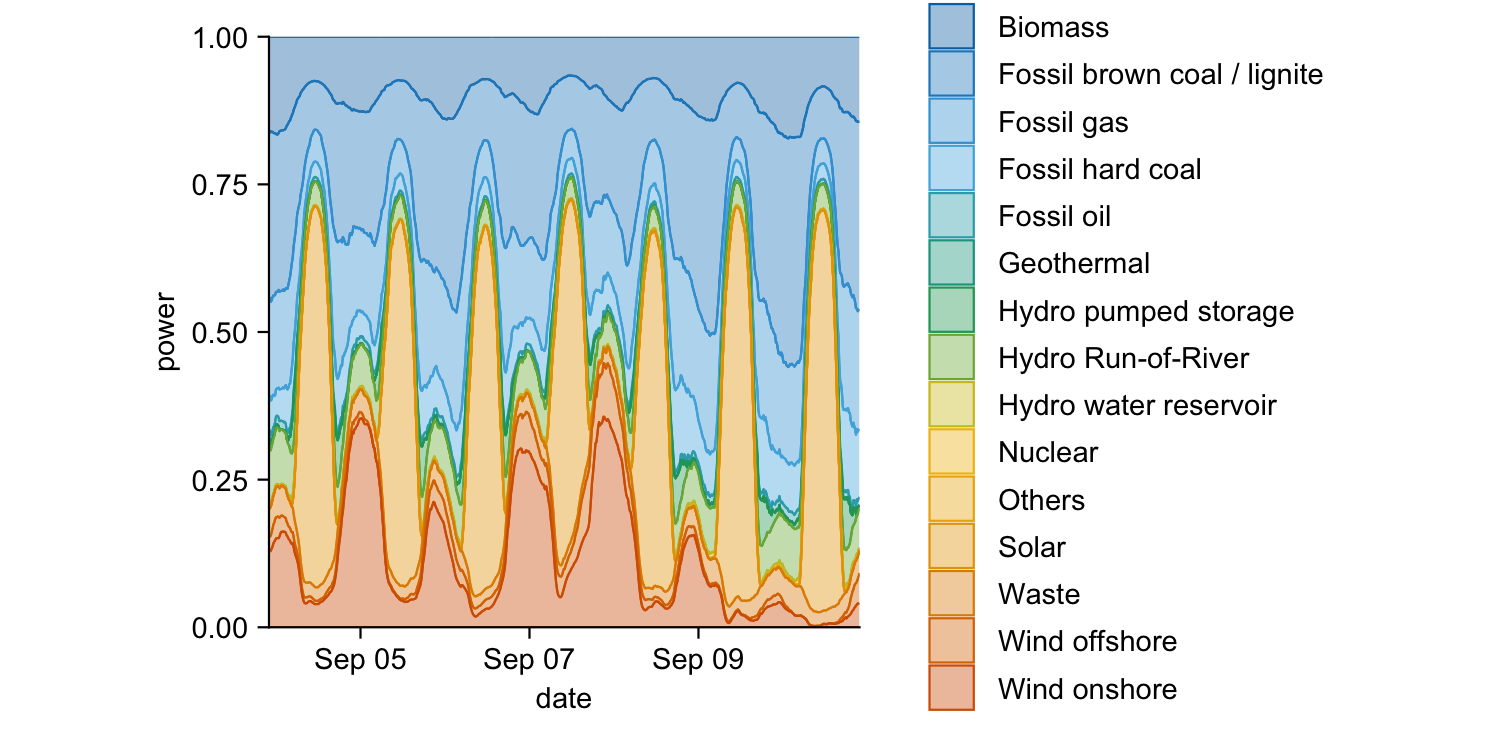
energy_week |>
  tidyplot(x = date, y = power, color = energy_source) |>
  add_areastack_relative()
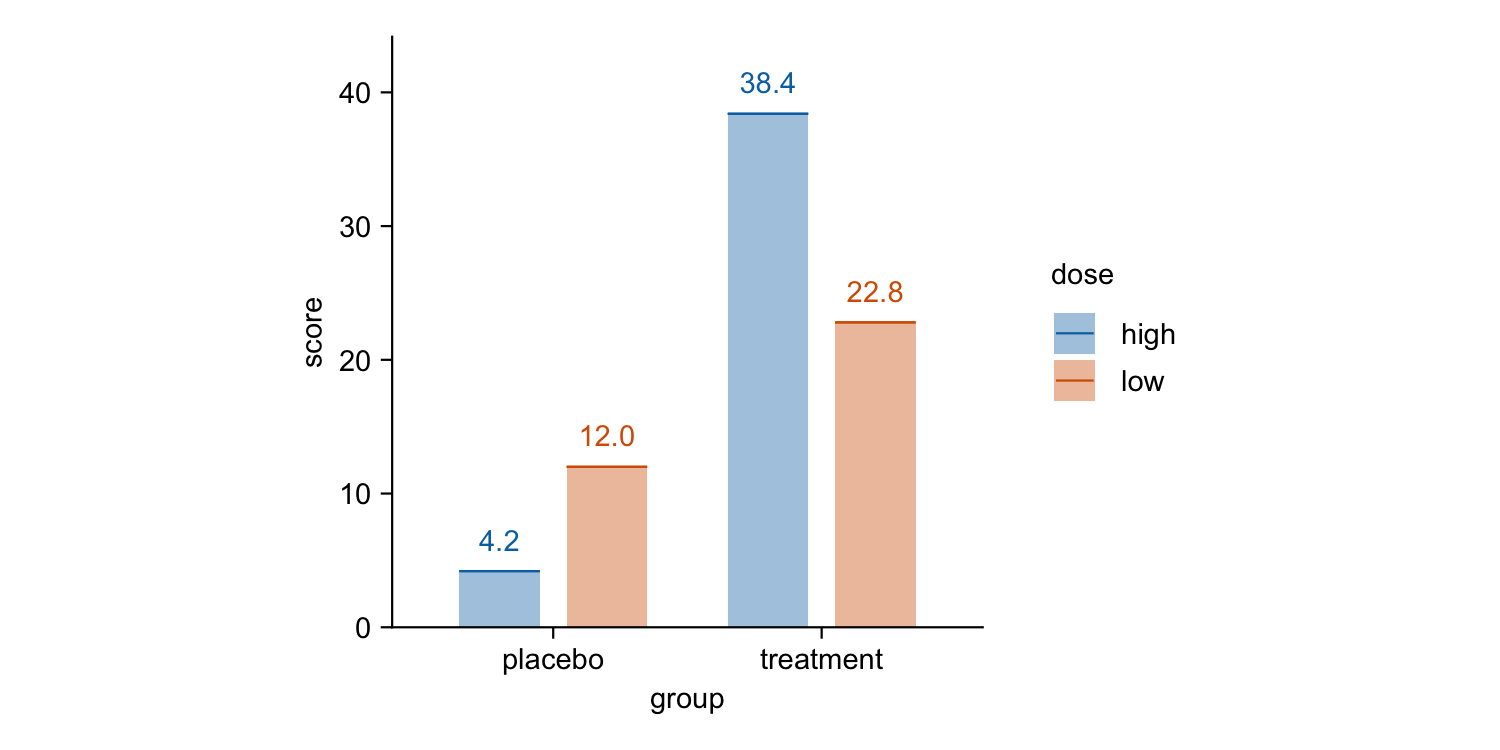
study |>
  tidyplot(x = group, y = score, color = dose) |>
  add_mean_bar(alpha = 0.4) |>
  add_mean_dash() |>
  add_mean_value()
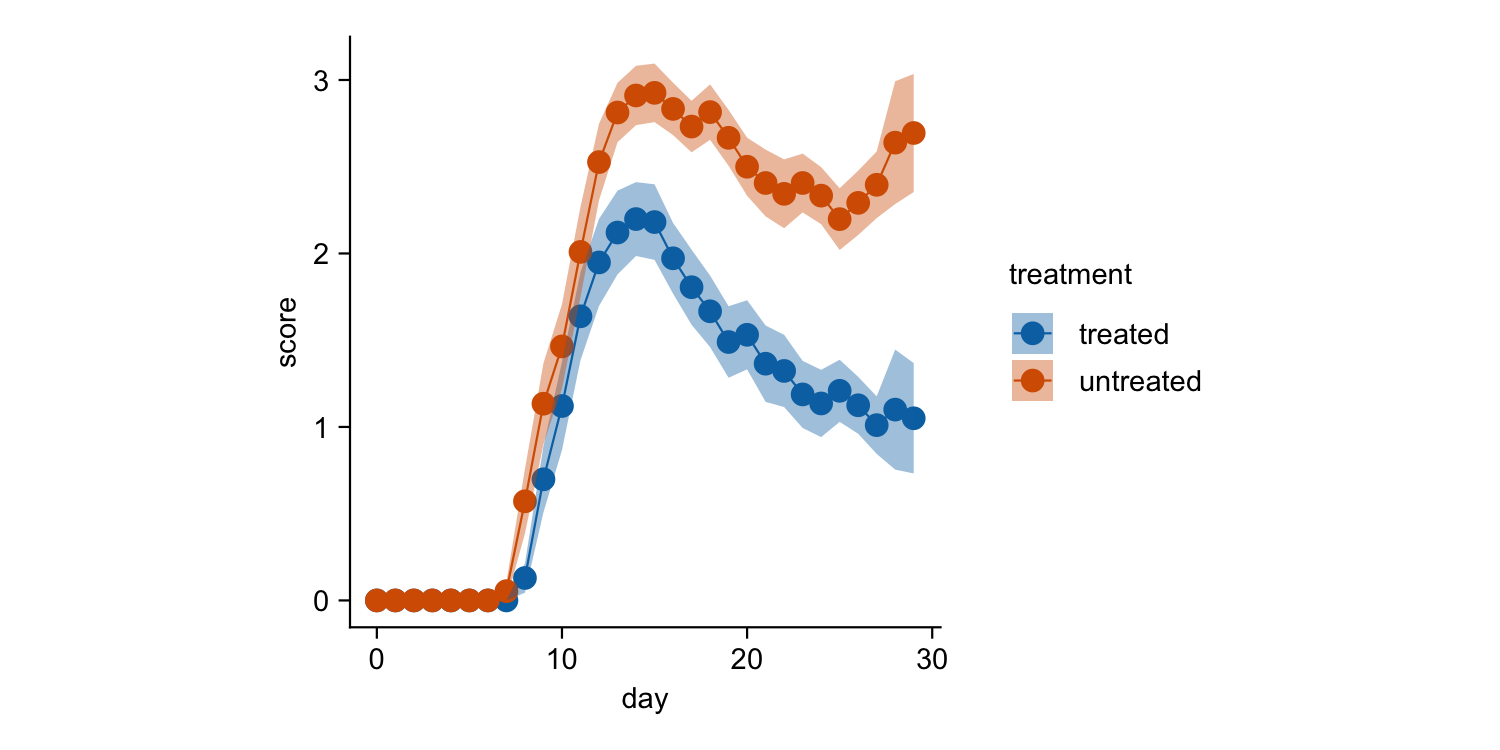
time_course |>
  tidyplot(x = day, y = score, color = treatment) |>
  add_mean_line() |>
  add_mean_dot() |>
  add_sem_ribbon()
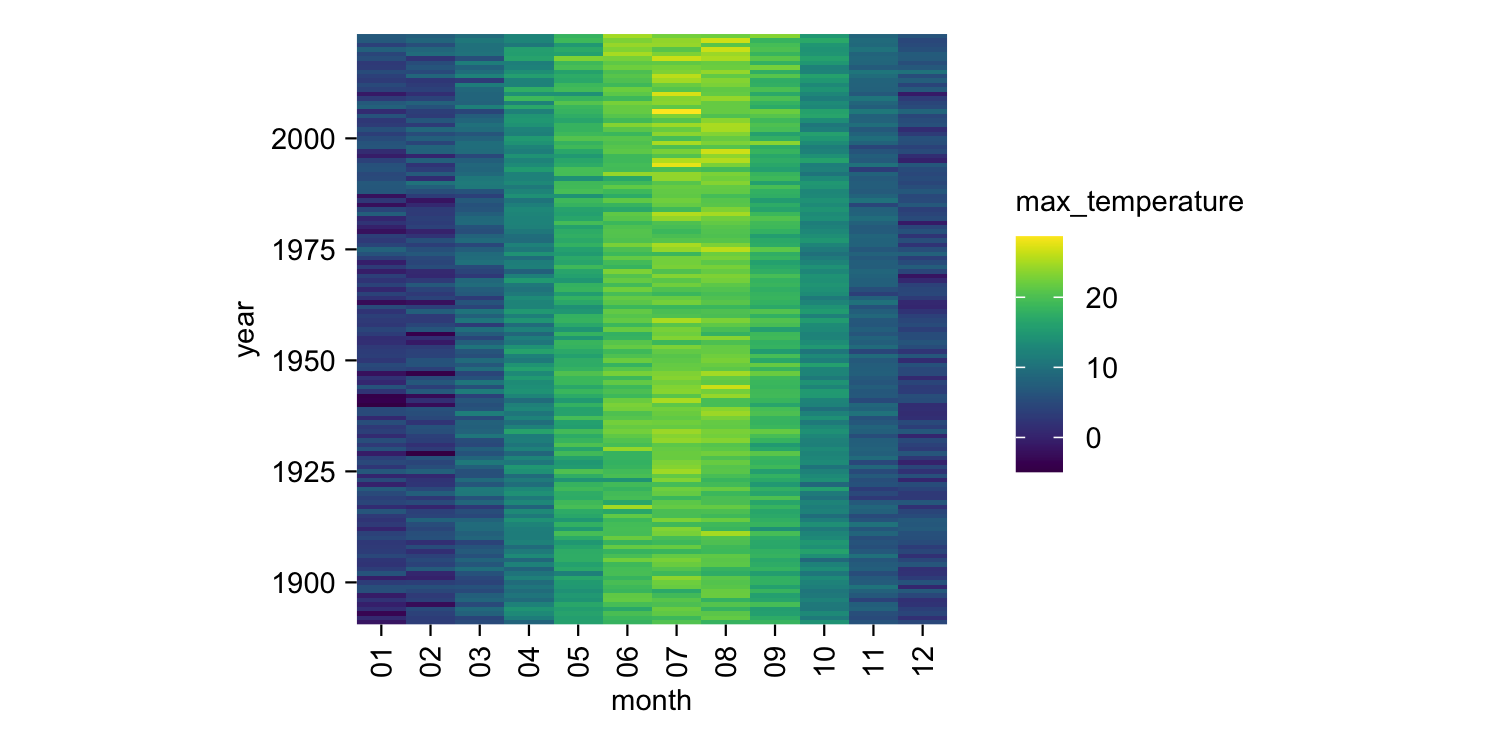
climate |>
  tidyplot(x = month, y = year, color = max_temperature) |>
  add_heatmap()
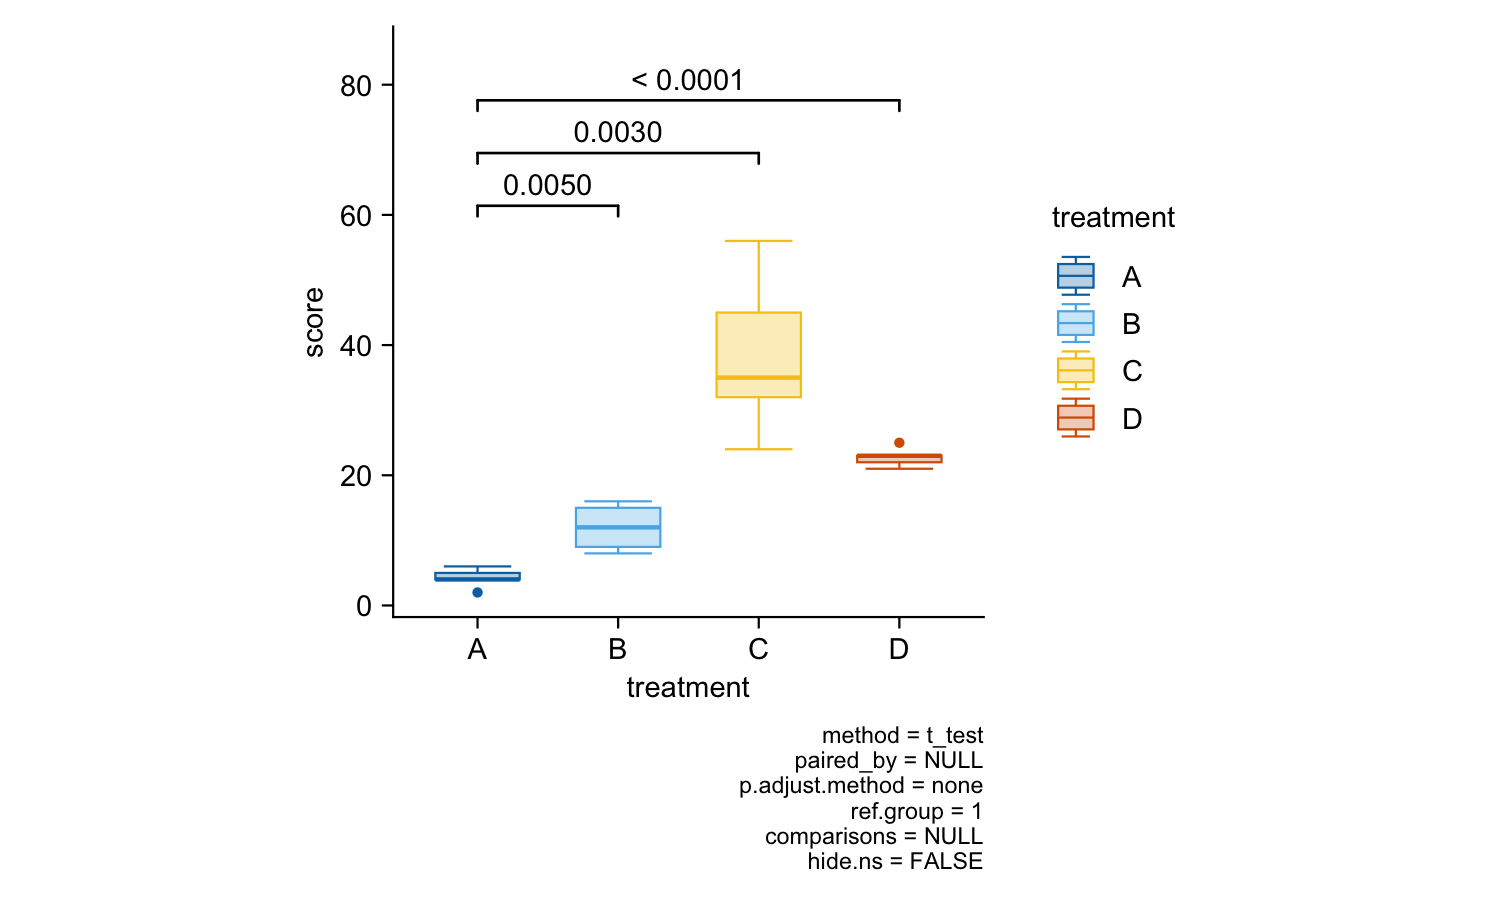
study |>
  tidyplot(x = treatment, y = score, color = treatment) |>
  add_boxplot() |>
  add_test_pvalue(ref.group = 1)
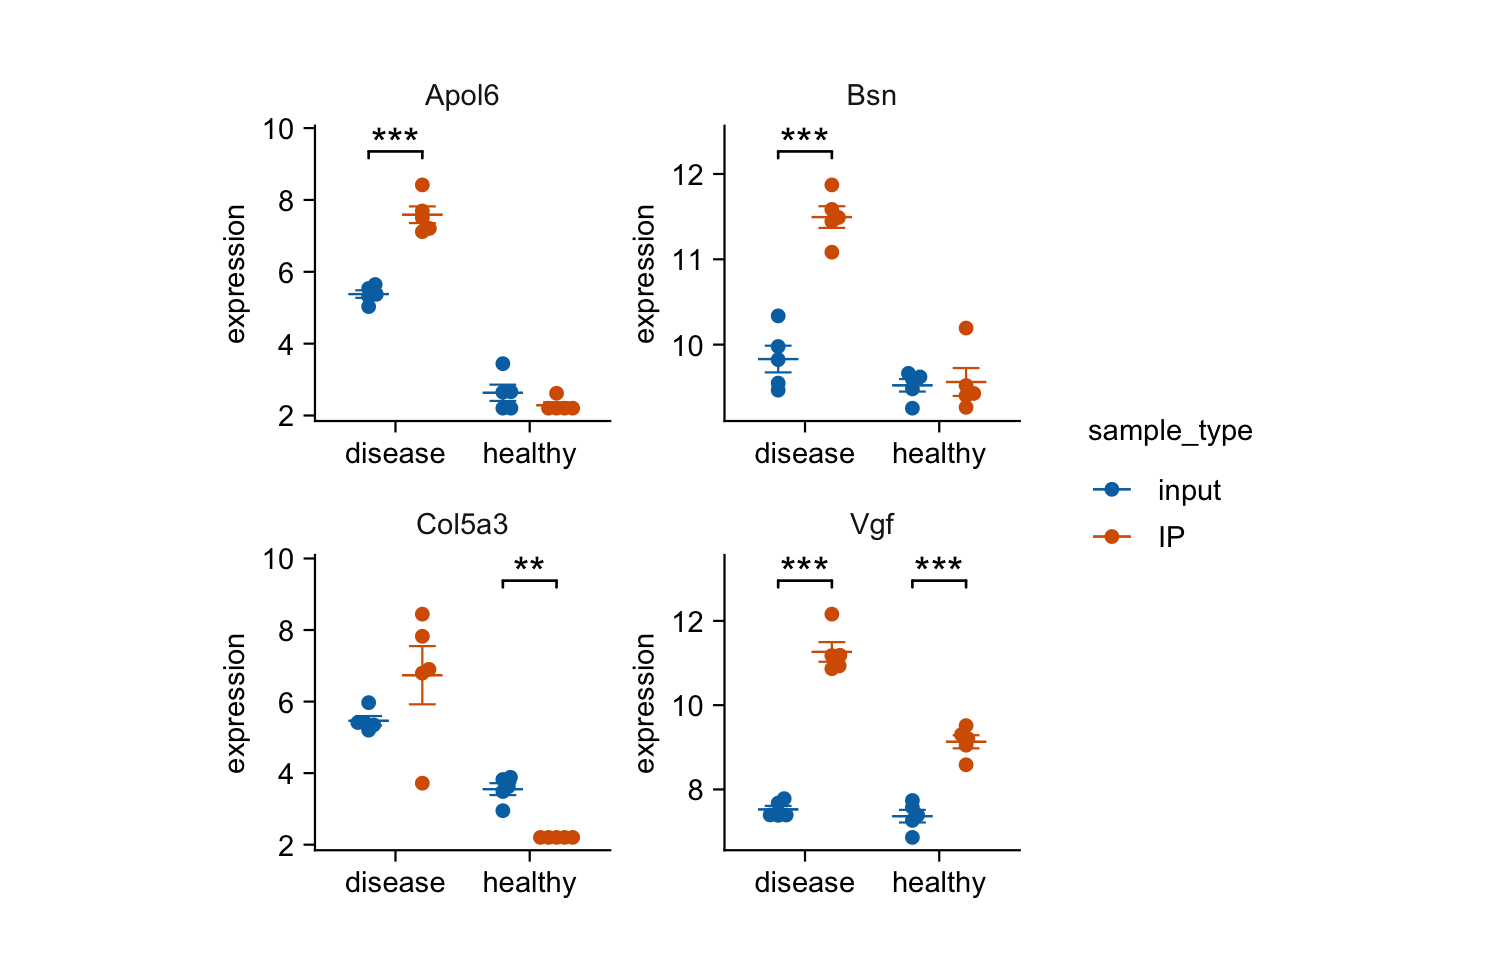
gene_expression |>
  dplyr::filter(external_gene_name %in% c("Apol6", "Col5a3", "Vgf", "Bsn")) |>
  tidyplot(x = condition, y = expression, color = sample_type) |>
  add_mean_dash() |>
  add_sem_errorbar() |>
  add_data_points_beeswarm() |>
  add_test_asterisks(hide_info = TRUE) |>
  remove_x_axis_title() |>
  adjust_size(width = 25, height = 25) |>
  split_plot(by = external_gene_name)
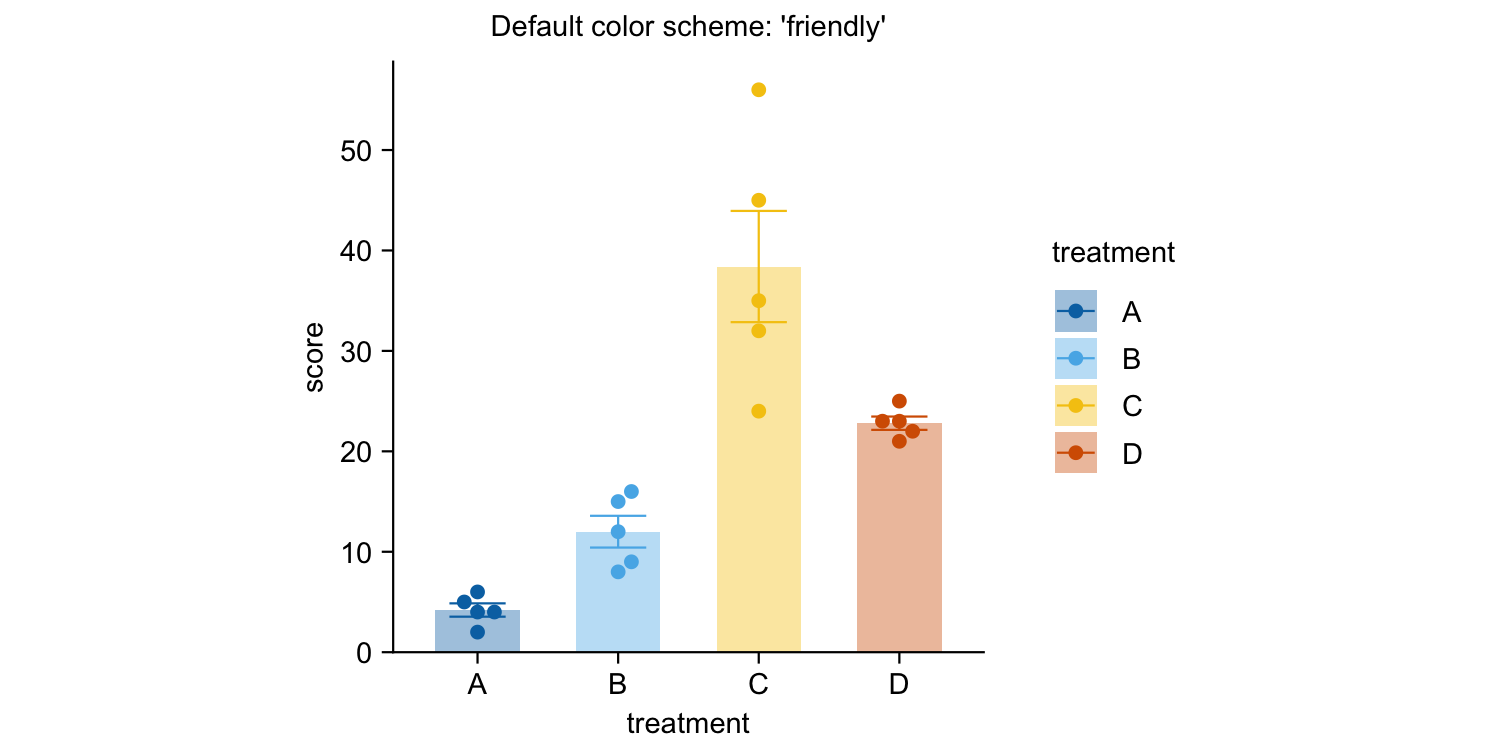
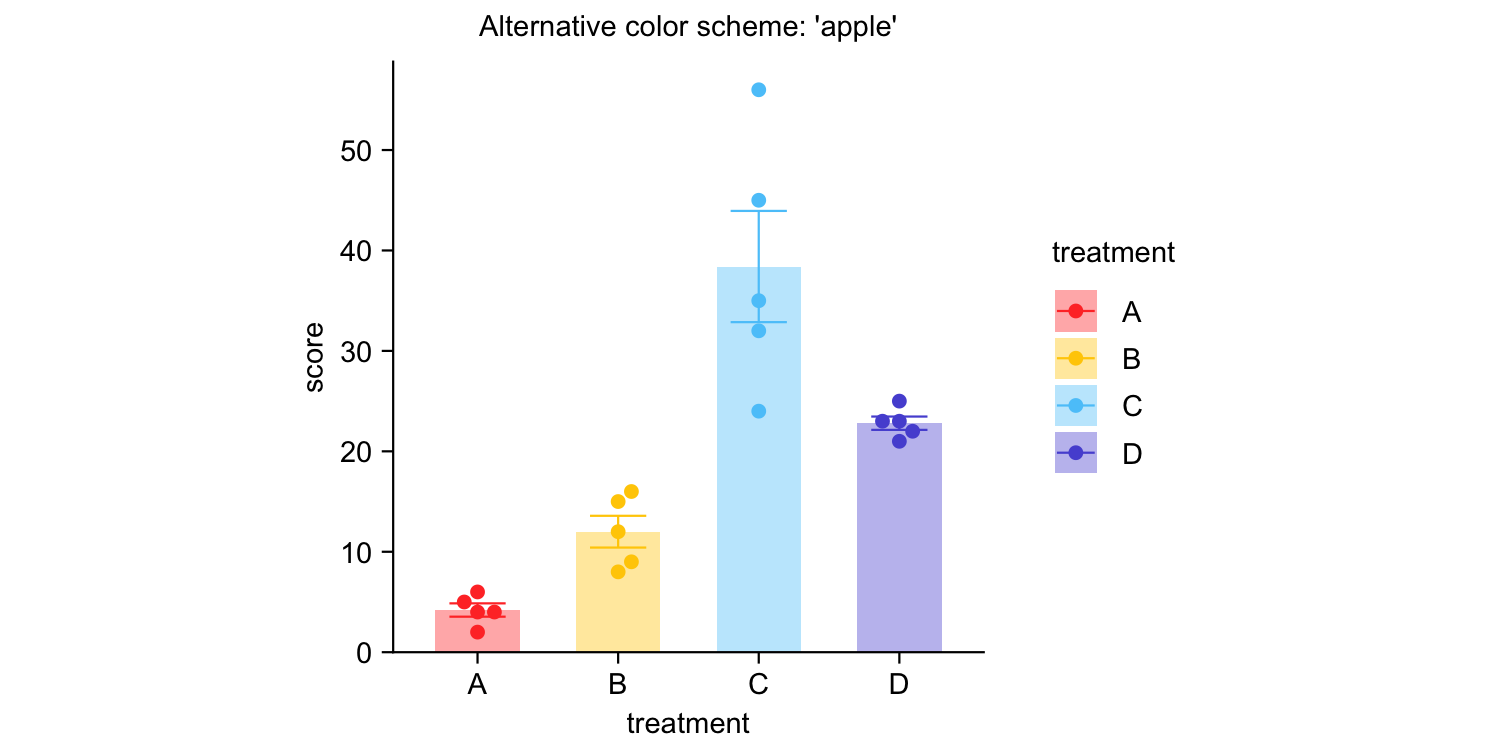
study |>
  tidyplot(x = treatment, y = score, color = treatment) |>
  add_mean_bar(alpha = 0.4) |>
  add_sem_errorbar() |>
  add_data_points_beeswarm() |>
  view_plot(title = "Default color scheme: 'friendly'") |>
  adjust_colors(colors_discrete_apple) |>
  view_plot(title = "Alternative color scheme: 'apple'")
Documentation
Package index
Overview of all tidyplots functionsGet started
Getting started guideVisualizing data
Article with examples for common data visualizationsAdvanced plotting
Article about advanced plotting techniques and workflowsColor schemes
Article about the use of color schemes
Acknowledgements
I would like to thank Lars Binkle-Ladisch for our insightful discussions and for consistently challenging my decisions regarding the naming of functions and their arguments.
Many thanks to the R and tidyverse communities. tidyplots is built upon their software and coding paradigms, and it would not have been possible without their contributions.
tidyplots relies on several fantastic packages that handle all the heavy lifting behind the scenes. These include cli, dplyr, forcats, ggbeeswarm, ggplot2, ggpubr, ggrastr, ggrepel, glue, Hmisc, htmltools, lifecycle, purrr, rlang, scales, stringr, tidyr, and tidyselect.