
jasonstrimpel/volatility-trading
jasonstrimpel/volatility-trading has 1,965 GitHub stars and 413 forks. GitHot measured 0 stars in 24 hours. Last checked 2026-11-07 00:53 UTC. Last push 2024-10-21.
A complete set of volatility estimators based on Euan Sinclair's Volatility Trading
Measured star growth
- in 24h
- 0
- in 7 days
- Collecting history
- in 15 days
- Collecting history
- in 1 month
- Collecting history
Net star changes over overlapping periods, not daily totals. Missing measurements are left blank. Stars measure attention, not software quality.
README.md
Originalvolest
Learn how to apply this code to your own options trading
Getting Started With Python for Quant Finance is the cohort-based course and community that will take you from complete beginner to up and running with Python for quant finance in 30 days.
A complete set of volatility estimators based on Euan Sinclair's Volatility Trading
The original version incorporated network data acquisition from Yahoo!Finance
from pandas_datareader. Yahoo! changed their API and broke pandas_datareader.
The changes allow you to specify your own data so you're not tied into equity
data from Yahoo! finance. If you're still using equity data, just download
a CSV from finance.yahoo.com and use the data.yahoo_data_helper method
to form the data properly.
Volatility estimators include:
- Garman Klass
- Hodges Tompkins
- Parkinson
- Rogers Satchell
- Yang Zhang
- Standard Deviation
Also includes
- Skew
- Kurtosis
- Correlation
For each of the estimators, plot:
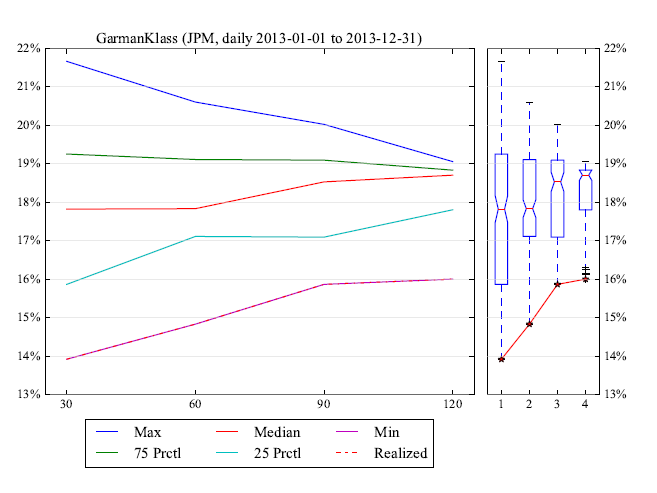
- Probability cones
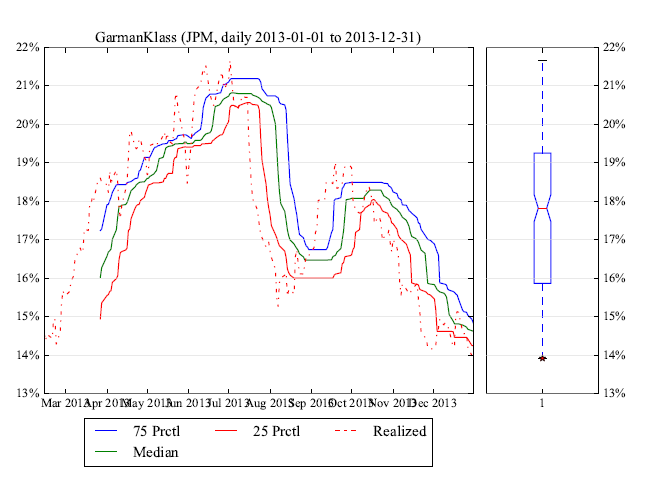
- Rolling quantiles
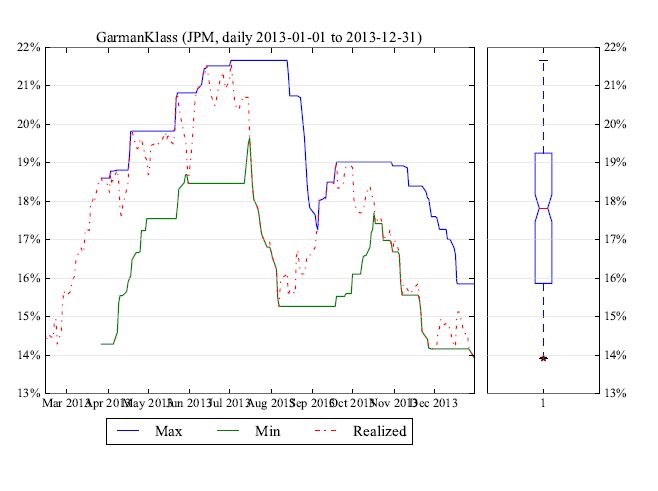
- Rolling extremes
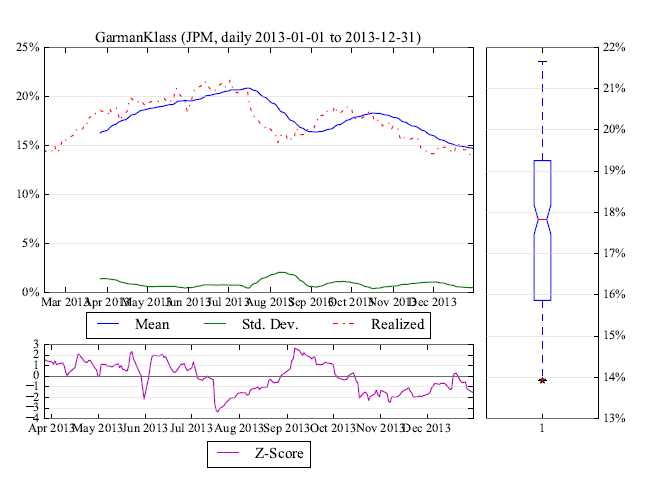
- Rolling descriptive statistics
- Histogram
- Comparison against arbirary comparable
- Correlation against arbirary comparable
- Regression against arbirary comparable
Create a term sheet with all the metrics printed to a PDF.
Page 1 - Volatility cones
Page 2 - Volatility rolling percentiles
Page 3 - Volatility rolling min and max
Page 4 - Volatility rolling mean, standard deviation and zscore
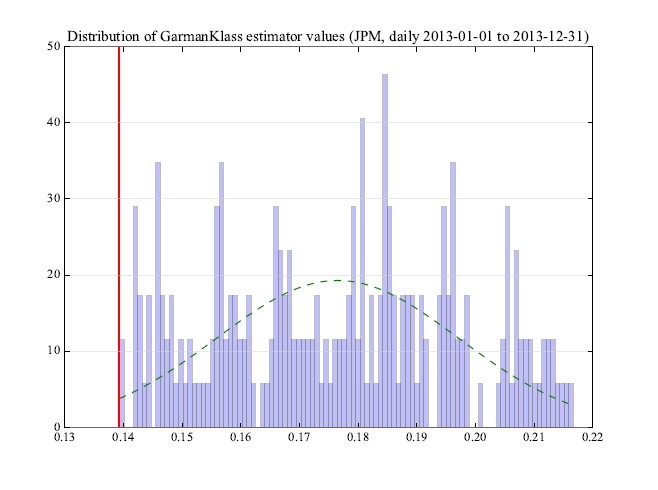
Page 5 - Volatility distribution
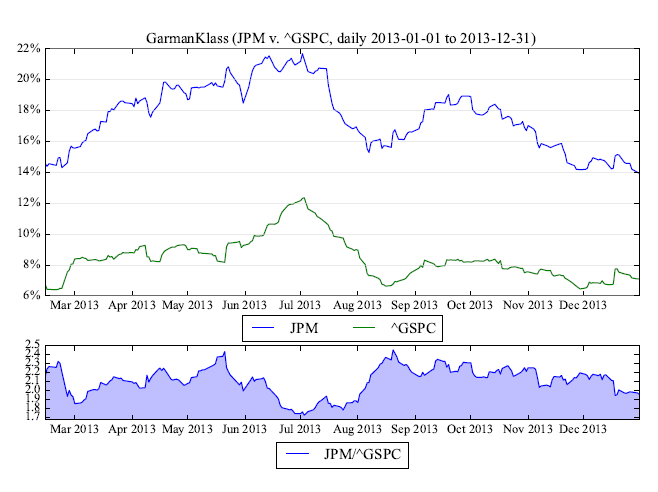
Page 6 - Volatility, benchmark volatility and ratio###
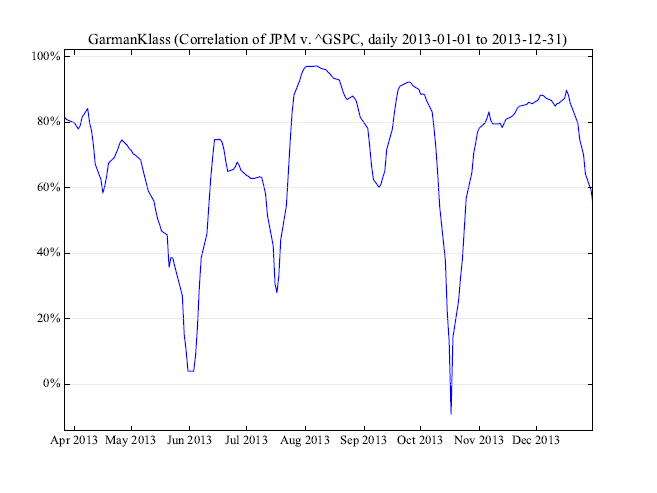
Page 7 - Volatility rolling correlation with benchmark
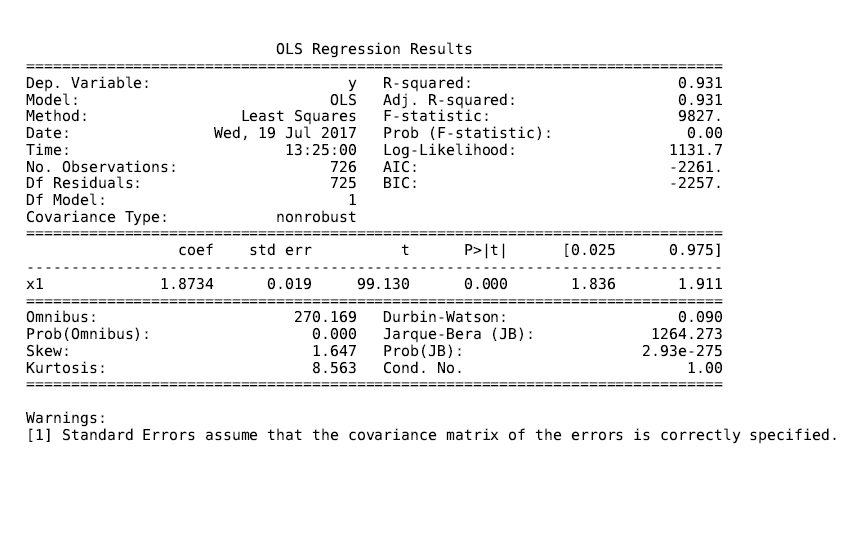
Page 3 - Volatility OLS results
Example usage:
from volatility import volest
import yfinance as yf

# data
symbol = 'JPM'
bench = 'SPY'
estimator = 'GarmanKlass'

# estimator windows
window = 30
windows = [30, 60, 90, 120]
quantiles = [0.25, 0.75]
bins = 100
normed = True

# use the yahoo helper to correctly format data from finance.yahoo.com
jpm_price_data = yf.Ticker(symbol).history(period="5y")
jpm_price_data.symbol = symbol
spx_price_data = yf.Ticker(bench).history(period="5y")
spx_price_data.symbol = bench

# initialize class
vol = volest.VolatilityEstimator(
    price_data=jpm_price_data,
    estimator=estimator,
    bench_data=spx_price_data
)

# call plt.show() on any of the below...
_, plt = vol.cones(windows=windows, quantiles=quantiles)
_, plt = vol.rolling_quantiles(window=window, quantiles=quantiles)
_, plt = vol.rolling_extremes(window=window)
_, plt = vol.rolling_descriptives(window=window)
_, plt = vol.histogram(window=window, bins=bins, normed=normed)

_, plt = vol.benchmark_compare(window=window)
_, plt = vol.benchmark_correlation(window=window)

# ... or create a pdf term sheet with all metrics in term-sheets/
vol.term_sheet(
    window,
    windows,
    quantiles,
    bins,
    normed
)
Hit me on twitter with comments, questions, issues @jasonstrimpel
Explore related projects
codecrafters-io/build-your-own-x
Master programming by recreating your favorite technologies from scratch.
560,552 starspublic-apis/public-apis
A collective list of free APIs
496,829 starsmorluto/rea
Reverse engineer anything with agents, from app behavior down to native binaries.
439,055 starsopenclaw/openclaw
The AI that really does things. Any OS. Any Platform. The lobster way. 🦞
394,097 stars