
hugalafutro/model-hotel
hugalafutro/model-hotel has 58 GitHub stars and 3 forks. GitHot measured 0 in 7 days. Last checked 2026-11-15 16:45 UTC. Last push 2026-11-05.
Measured star growth
- in 24h
- Update delayed
- in 7 days
- 0
- in 15 days
- Update delayed
- in 1 month
- Update delayed
Net star changes over overlapping periods, not daily totals. Missing measurements are left blank. Stars measure attention, not software quality.
About
Multi-Provider AI Gateway, "Because we have LiteLLM at home" No personal logs by design. Model autodiscovery, Failover groups, High availability, Android companion app, and more!
AIREADME.md
Original

"Because we have LiteLLM at home"
Multi-Provider AI Gateway




[!IMPORTANT] AI-Assisted Project Disclaimer:
Human judgment applied at every stage, particularly around architectural decisions, UX flows, and quality control.
Localised by AI - expect mistakes - translation fixes welcome as PRs against web/src/i18n/locales/!
Made with OpenCode + oh-my-opencode-slim & Claude Code

Poke around a real instance at mh.site19.ddns.net - rebuilds fresh every 30 minutes
A single OpenAI-compatible endpoint in front of all your LLM providers, cloud or self-hosted. Add the same model from any number of providers and a failover group forms around it automatically: requests go to the providers in the order you set, and when one runs out of quota or goes down, the next one answers, with no change on the client side. A provider whose quota is spent is skipped until it resets, then rejoins on its own. Models are auto-discovered the moment you add a provider and, if you want, on a schedule. No prompt data is ever stored.
 · Quick Start
- Deploy with Git: clone, build, and log in for the first time; stop, update, or remove the stack
- Deploy without Git: run the published image from two files, no clone, no build
- Development: the dev stack with the
compose.dev.ymloverlay
 · One Endpoint, Many Providers
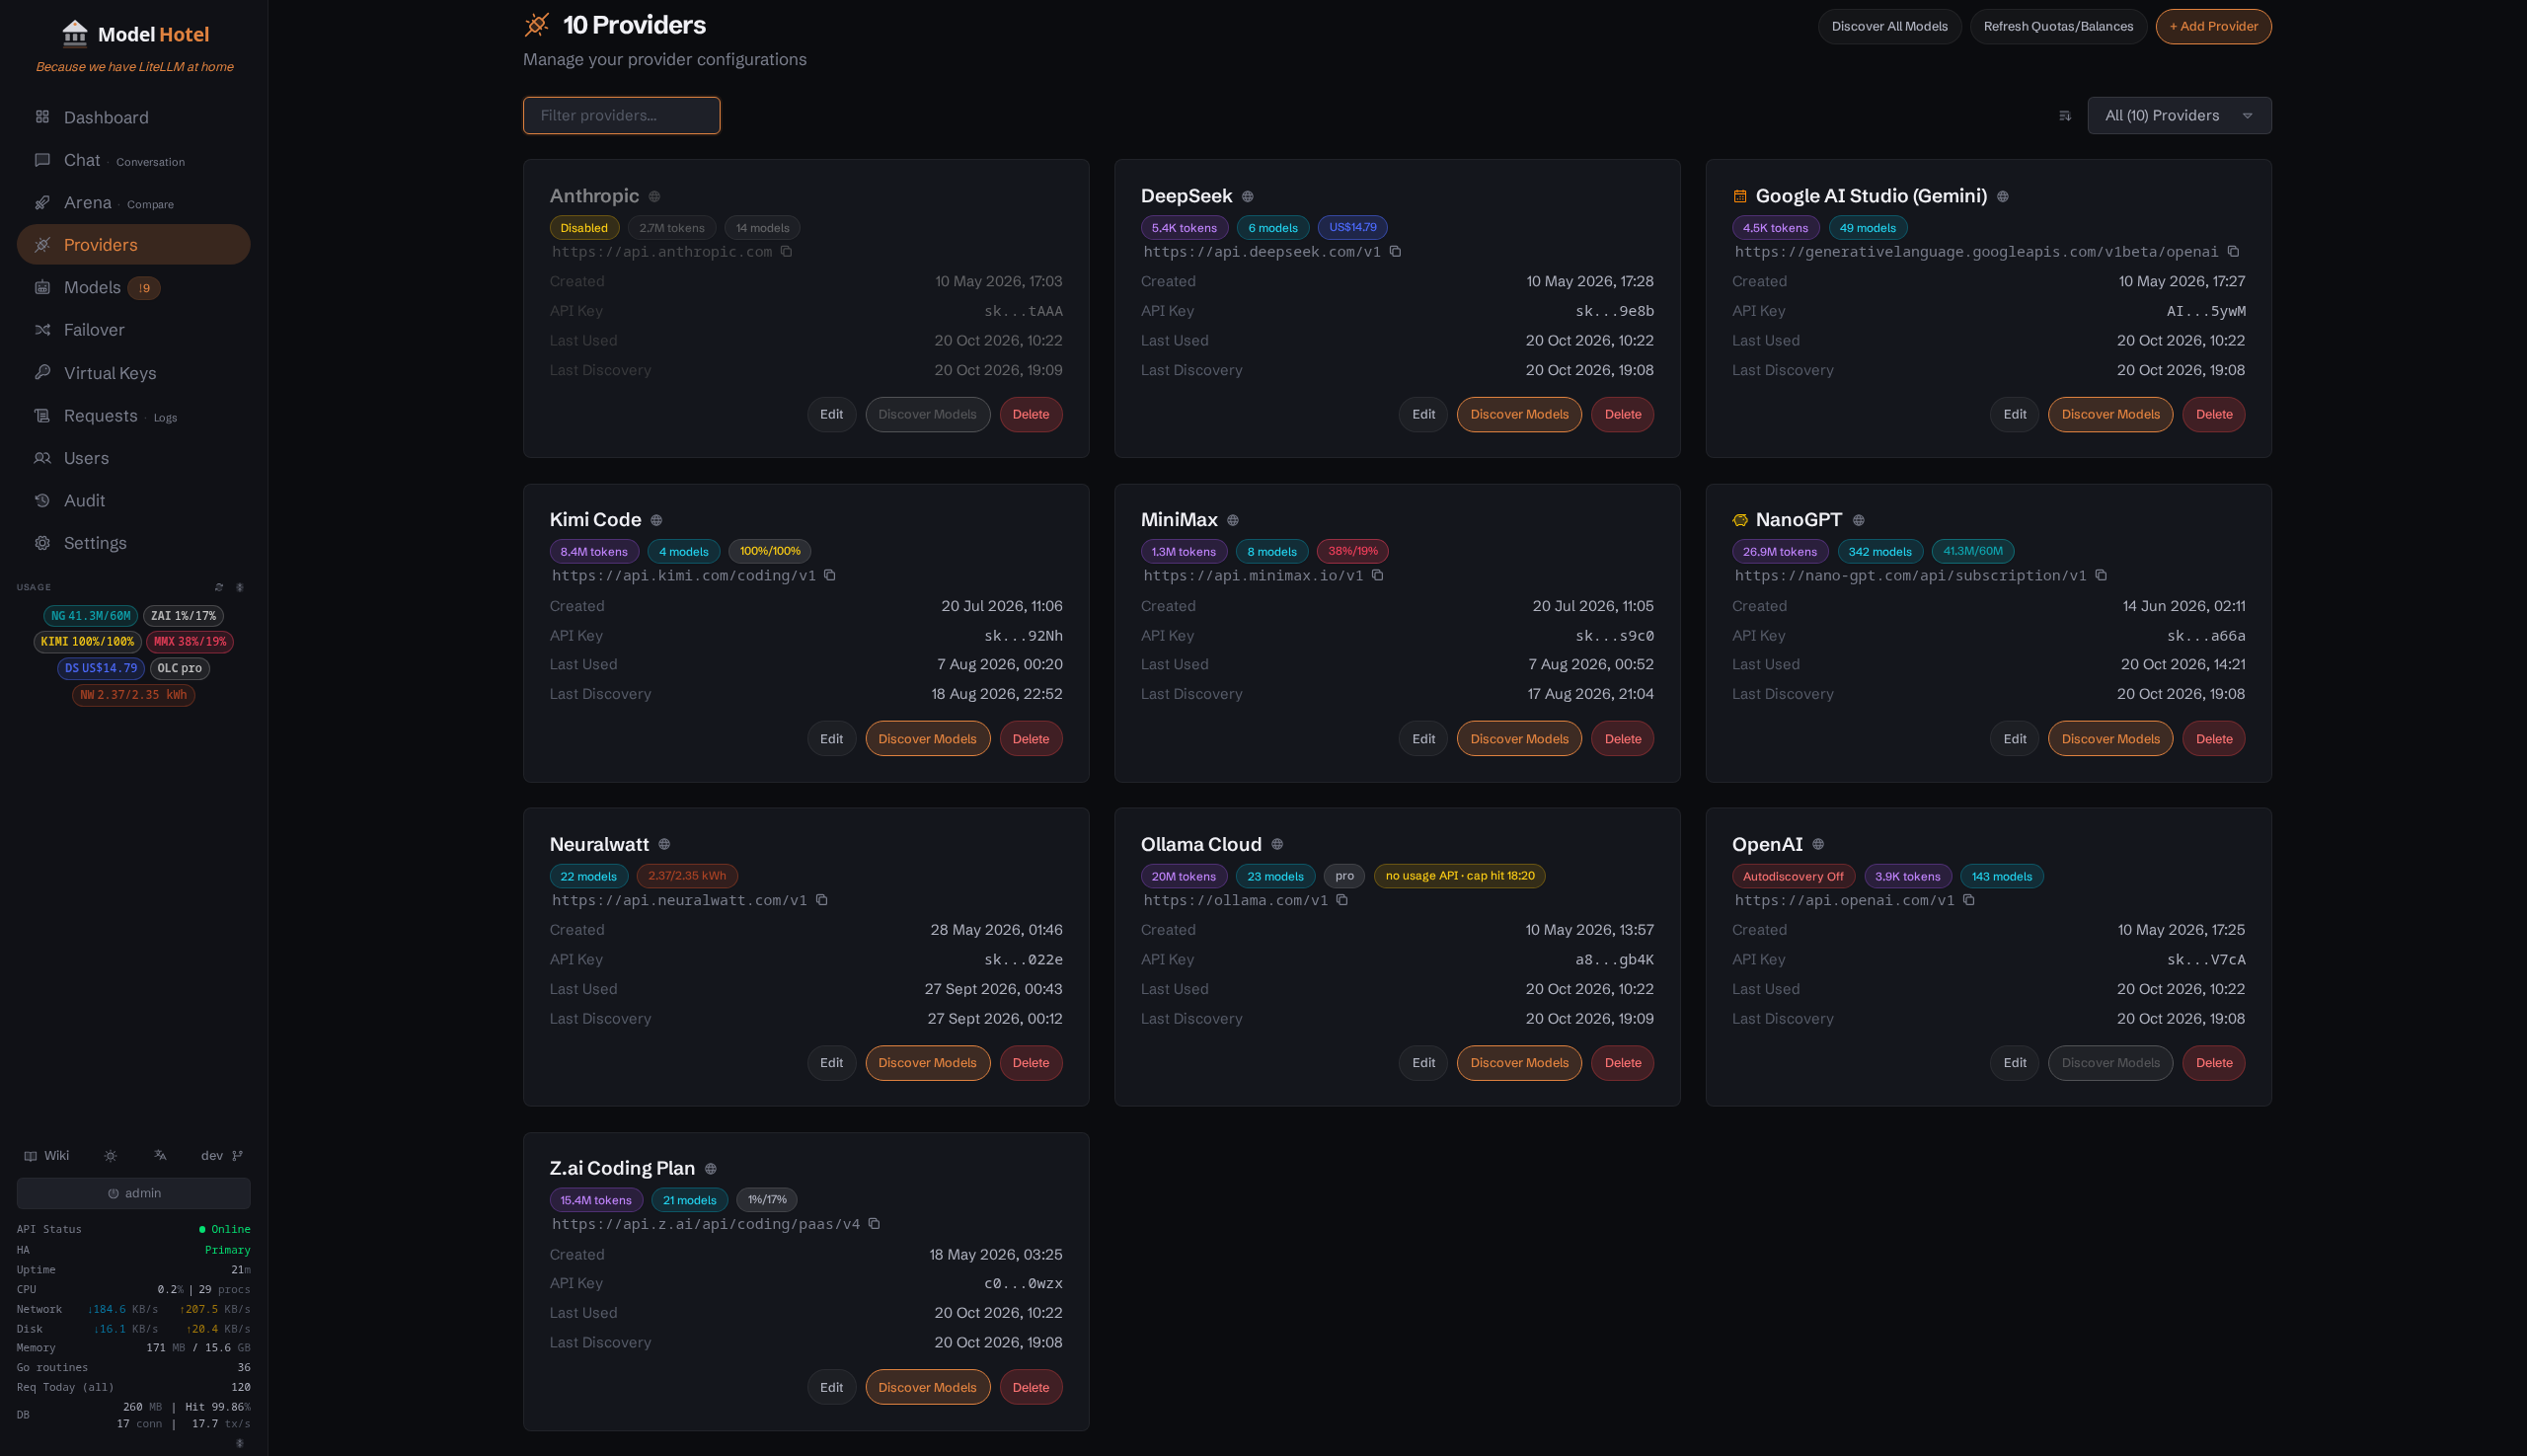
Hosted: Anthropic, AWS Bedrock, Azure AI Foundry, Cohere, DeepSeek, Google AI Studio, Kimi Code, MiniMax, NanoGPT, NeuralWatt, Ollama Cloud, OpenAI, OpenCode Go, OpenCode Zen, OpenRouter, Vertex AI (express keys), xAI, Z.AI. All but Anthropic and AWS Bedrock speak the OpenAI API; those two are native families, and a hand-entered endpoint that speaks Anthropic's native /v1/messages has its own type (anthropic-messages). Any other OpenAI-compatible API, hosted or local, can be added as a custom endpoint.
Self-hosted: Ollama, LM Studio, KoboldCPP, LocalAI, SGLang and TabbyAPI each have their own provider type: pick it, enter the address and port, done. Some providers need no API key at all (a local Ollama, or OpenCode Zen free models).
All of them are called through the same /v1/chat/completions endpoint; the proxy handles model ID mapping and failover transparently. Provider API keys are encrypted with AES-256-GCM at rest using your MASTER_KEY; only the proxy ever sees the decrypted credentials.
 · Transparent Failover
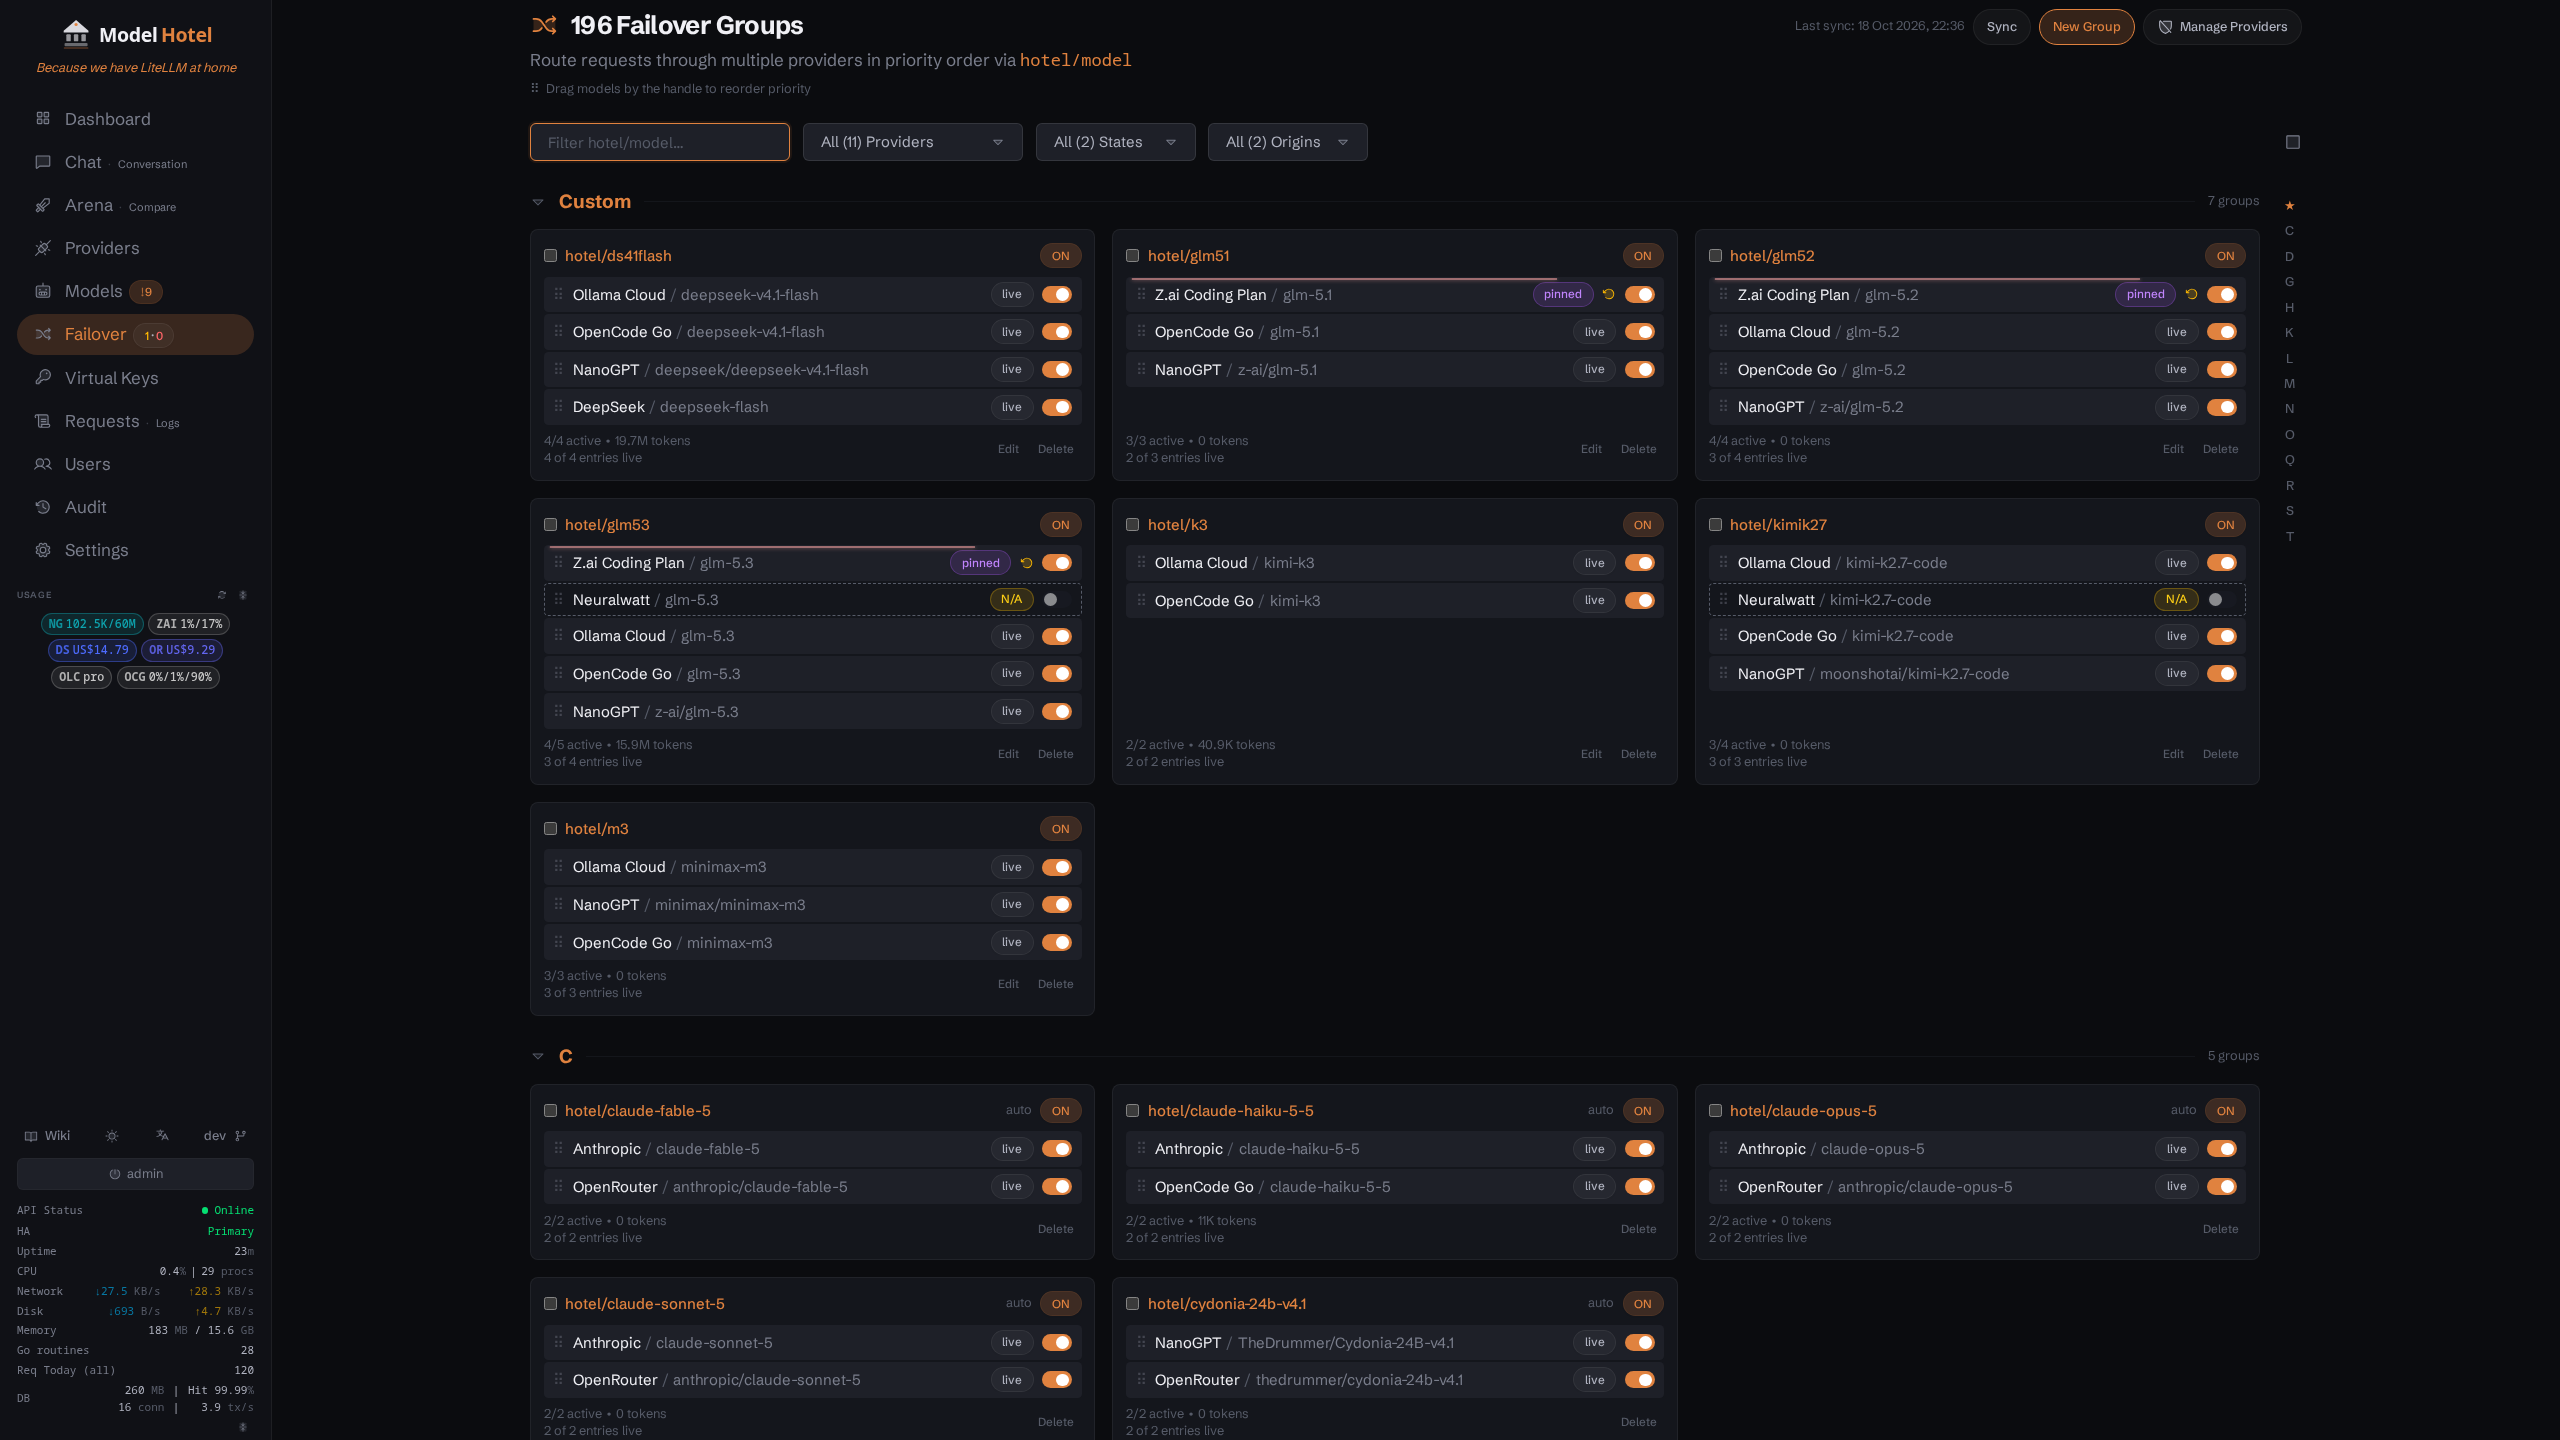
Requests that fail (server errors, rate limits, auth issues, request timeouts) are automatically retried on the next available provider, with exponential backoff and jitter between attempts so a failing provider is not hammered. Streaming requests get three extra guards: a TTFT probe waits for the first token before committing the stream to your client, so a provider that never answers fails over instead of leaving the client hanging; a stall watchdog terminates a stream that goes silent mid-answer and counts it as a failure; and optional hedging (off by default) launches the next provider in parallel when the first one is slow to its first token, at the cost of duplicate upstream load. Both timeouts are set in Settings → Proxy and hedging under Settings → Circuit Breaker & Failover; the Failover and Hotel Routing wiki has the full detail.
 · Hotel Routing
Prefix any model name with hotel/ and you get the whole fleet behind it. hotel/glm-4.6 reaches every provider that offers glm-4.6, in the order you set: a failover group forms on its own the moment two providers share a model name, follows discovery as models and providers come and go, and the request lands on the first healthy provider with no change on the client side. Behind it a per-model circuit breaker keeps track of who is failing: a provider that keeps erroring on one model is skipped for that model only, probed again after a cooldown that grows while it stays broken, and a provider that has run out of quota is parked until its window resets and rejoins by itself. You set priorities and switch entries on or off from the dashboard; everything else is automatic. How groups are built, synced and ranked is in the Failover and Hotel Routing wiki.
 · No Prompts Logged
[!NOTE] User prompts and request content are never captured, logged, or inspected. The proxy forwards requests to the provider exactly as received, without reading or modifying message contents.
The only information recorded is what is strictly necessary to route and meter the request: timestamp, duration, latency, time-to-first-token (TTFT, measured during the streaming probe), token counts (including cache-hit/miss breakdown), tokens per second, HTTP status code, error messages (upstream provider failures only, never user content), proxy overhead breakdown (parse, model lookup, provider lookup, key decryption), streaming flag, failover attempt count, resolved model ID (the actual upstream model used, which may differ from the requested hotel/ name), request state, virtual key identifier, and target provider/model identifiers.
The optional Arena History feature (disabled by default, toggled under Settings → Data Storage and Logging → Arena History) can persist completed arena and compare session results in your browser's local storage. When enabled:
- Model-generated responses (output text, thinking blocks, metrics) are stored locally so you can review past results.
- Preset prompts and personas are saved by reference (e.g. "Dilemma preset", "Merlin persona"): only their built-in IDs are stored, never their text.
- Custom user-entered text is never logged. If you type your own prompt or persona system prompt, it is intentionally excluded from history records. Only the fact that a custom prompt was used is recorded (shown as "Custom prompt" in the history UI), with no content retained.
History data never leaves your browser. It can be cleared at any time from the Settings page.
 · Per-Client Virtual Keys
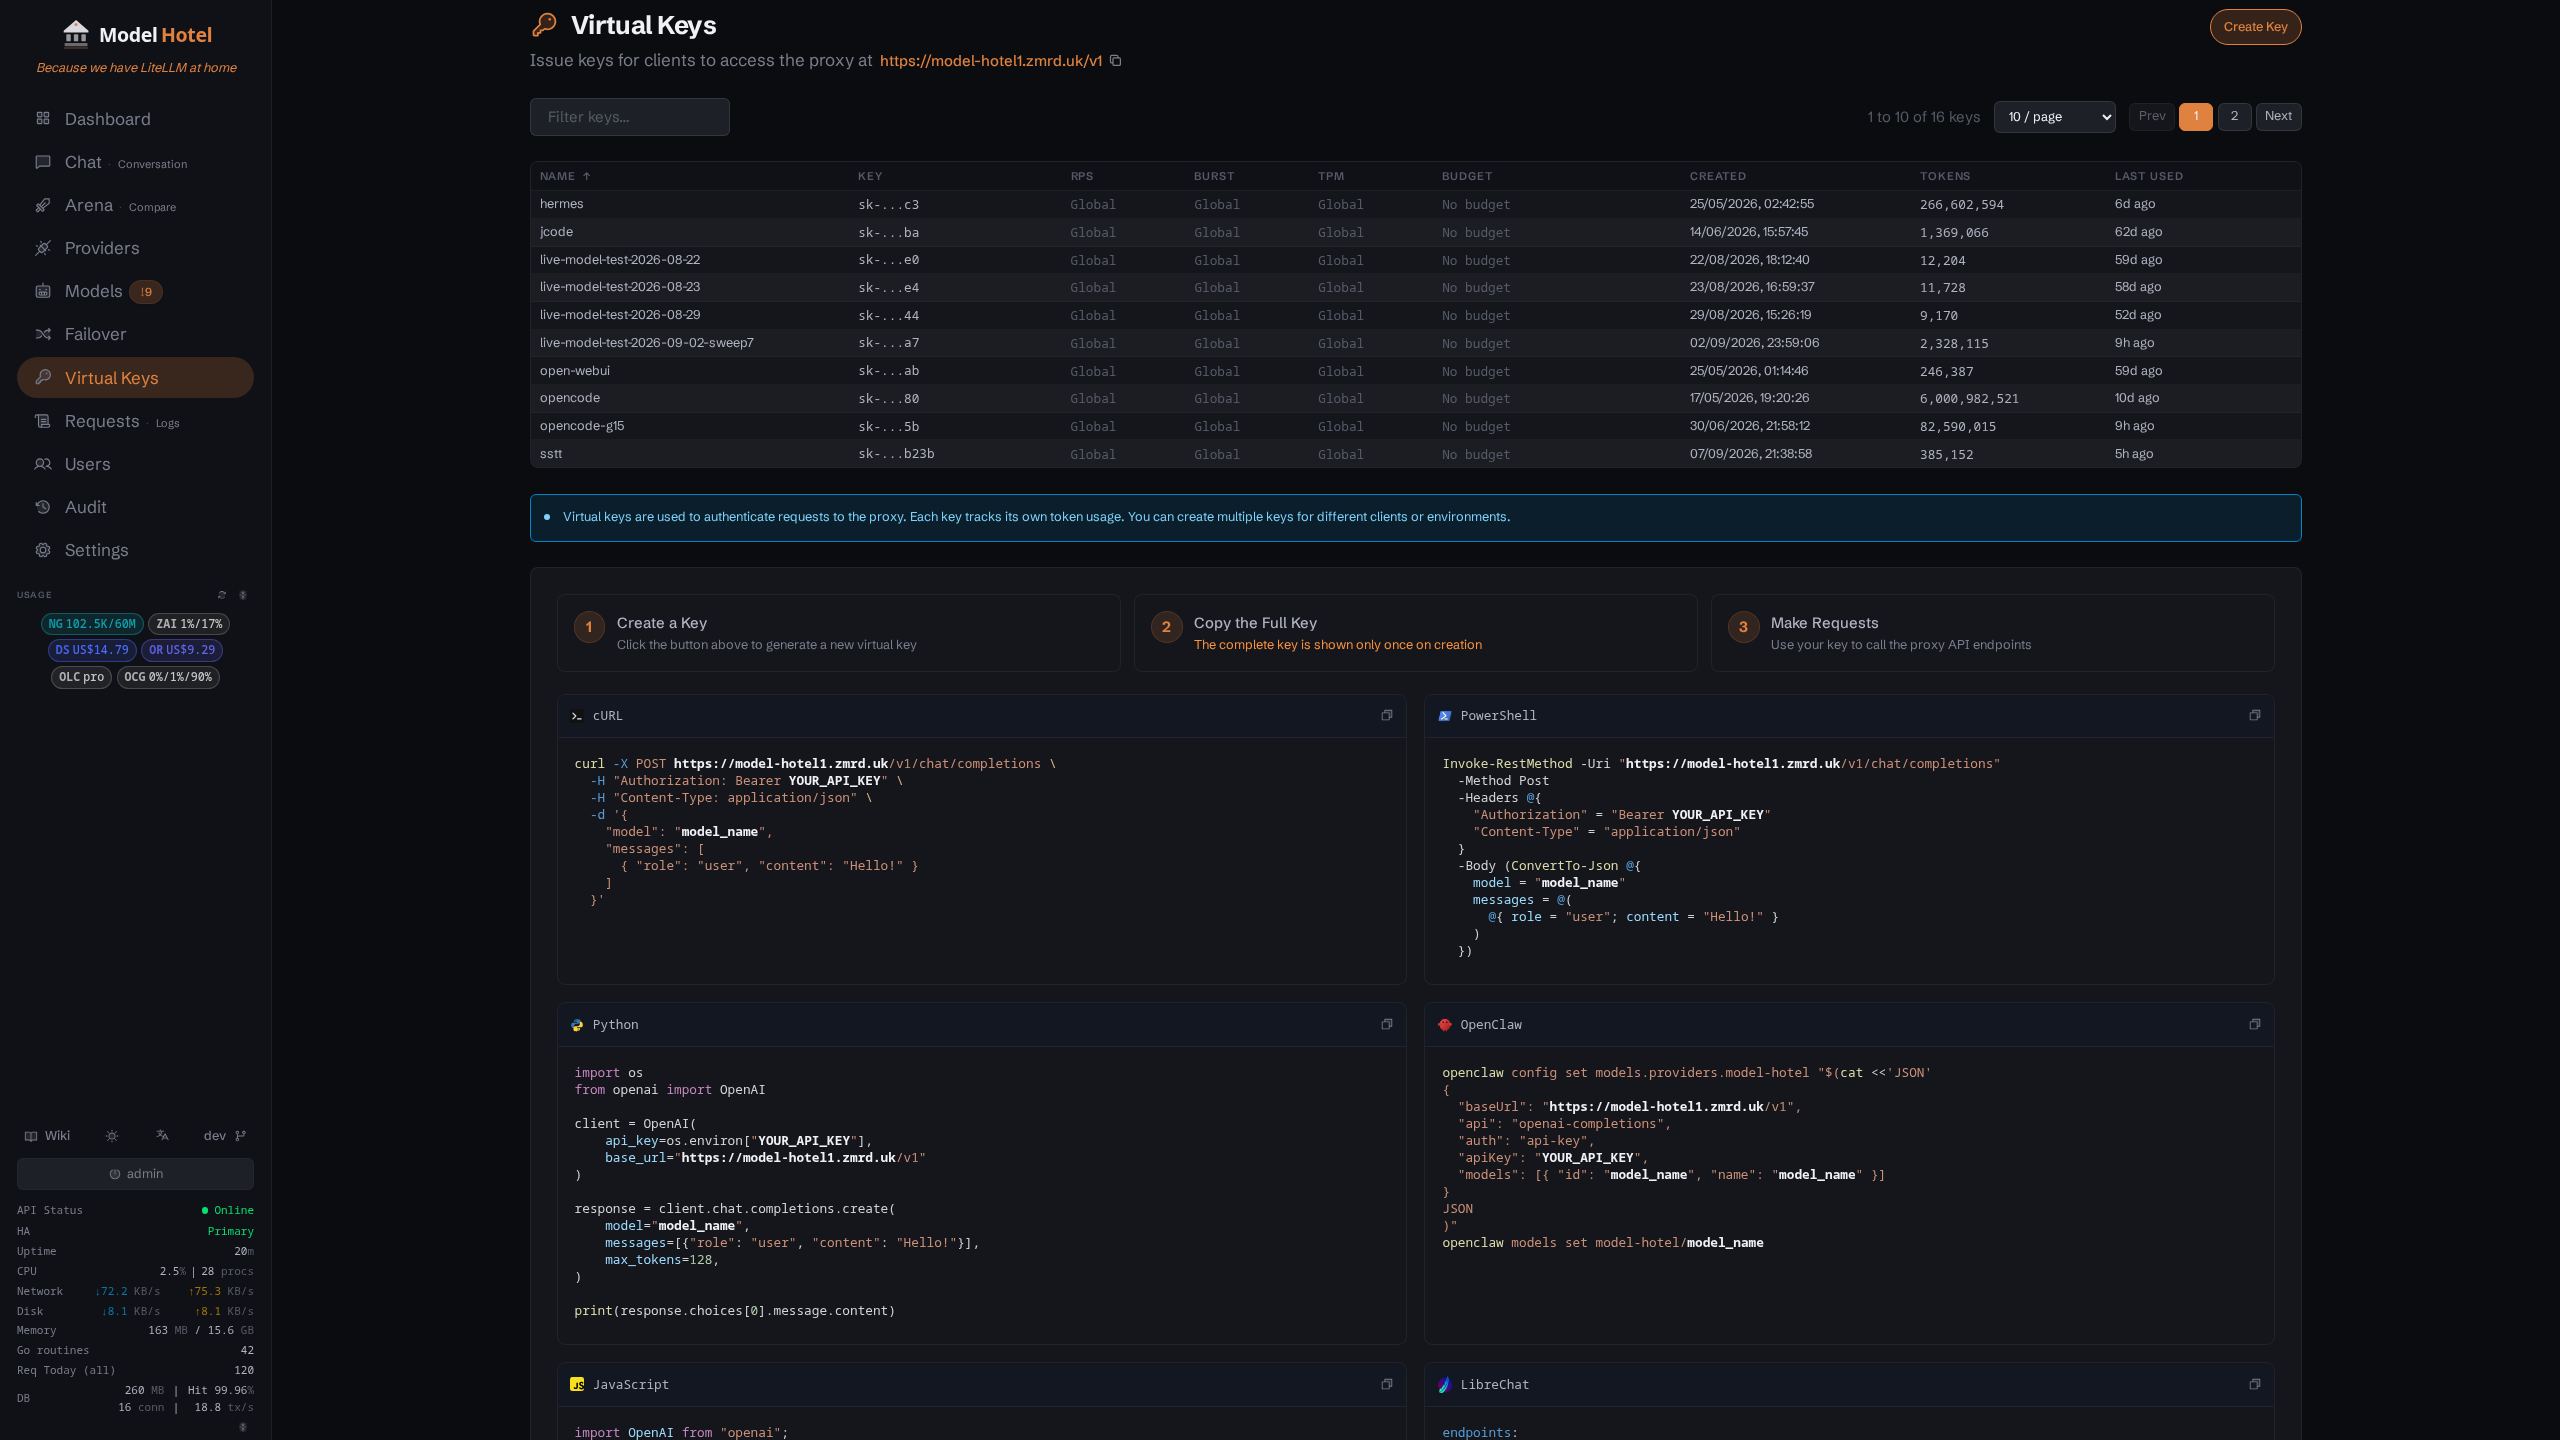
Issue separate API keys for different users or services. Each key is SHA-256 hashed before storage, so raw keys are never persisted. Track token usage per key, set per-key rate limits (requests/sec and burst) plus an optional tokens-per-minute (TPM) cap, give a key a dollar budget per day, week or month (requests are refused with 429 once the period's spend reaches it, and the key shows how much of it is used), restrict which providers a key may reach, delete a key to immediately cut off access, and never expose your real provider credentials. Keys can be created and deleted from the dashboard or the admin API.
 · Request Logging with Overhead Breakdown
Every request is logged with full latency decomposition:
- TTFT (time to first token, measured by the streaming probe)
- Total duration (end-to-end wall time)
- Proxy overhead split into request parsing, model/failover lookup, provider lookup, and key decryption
- Tokens per second, prompt / completion counts
- Cost in dollars, priced from the serving model's per-token prices (cache-hit tokens at the cache-hit price where the model has one)
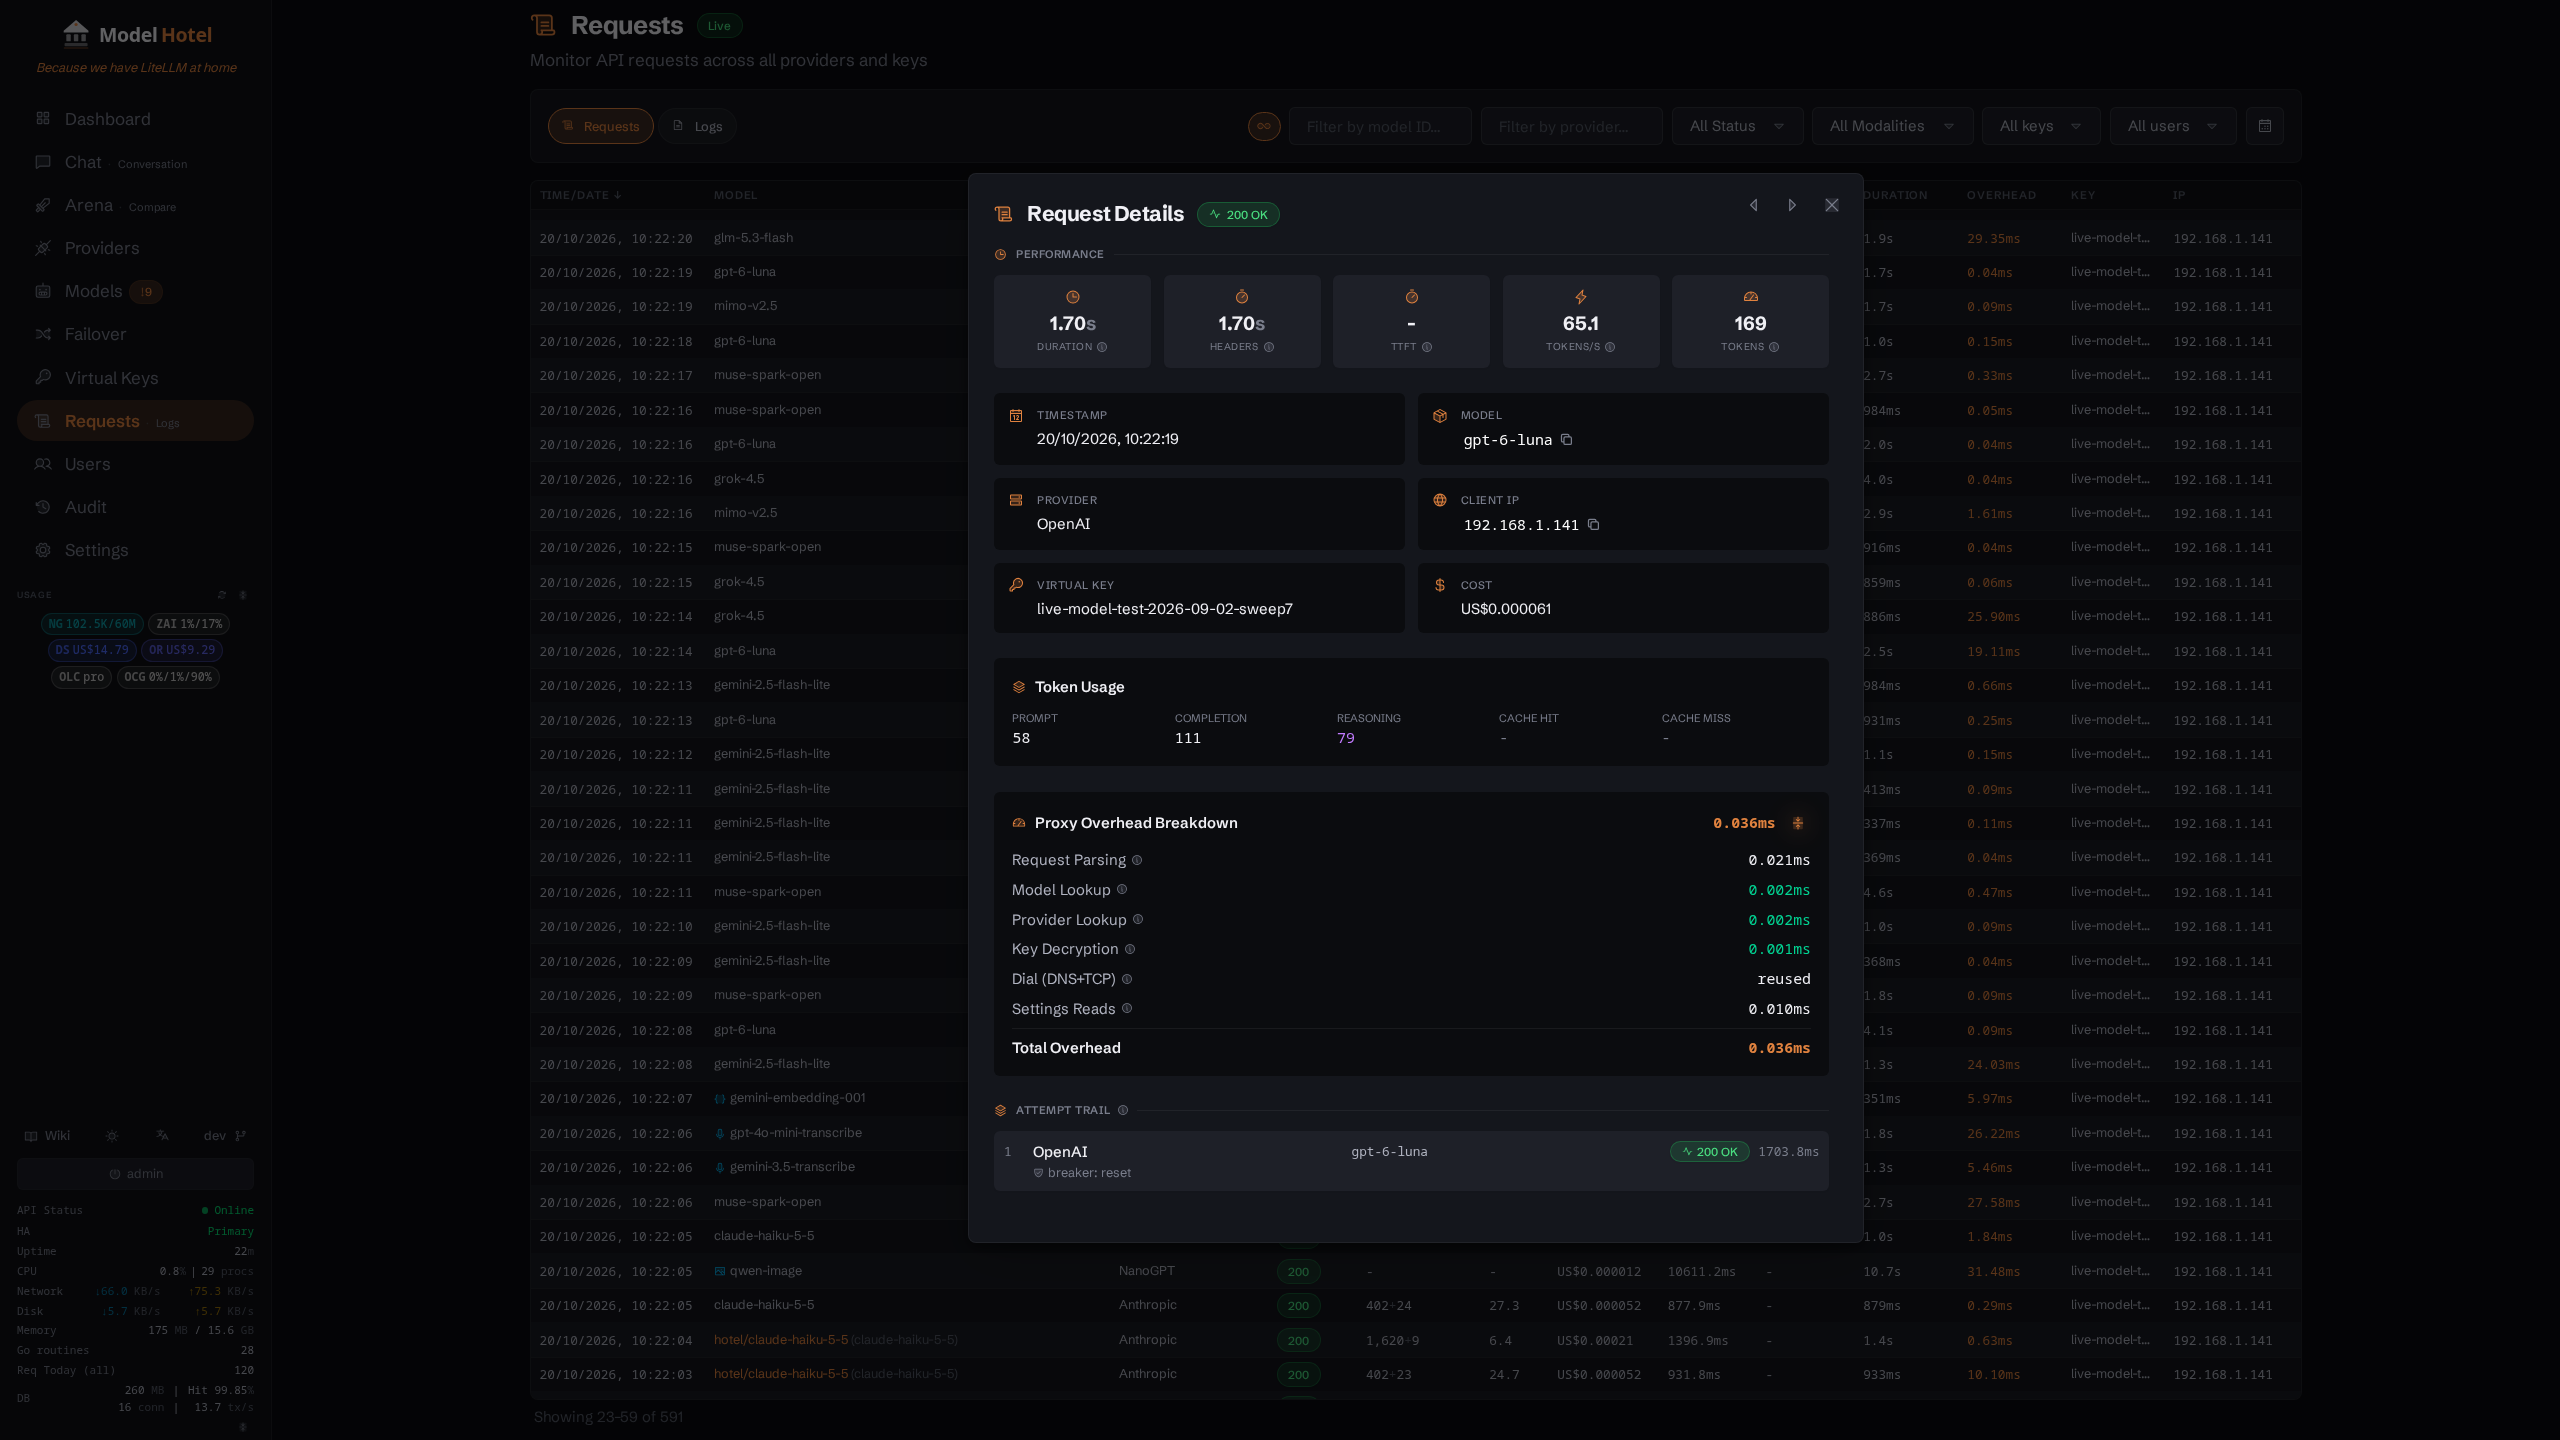
Streaming requests are captured as they start and updated as they finish, so you can see in-flight requests in the Logs view. The overhead breakdown helps you determine whether latency is coming from your provider or from the proxy itself.
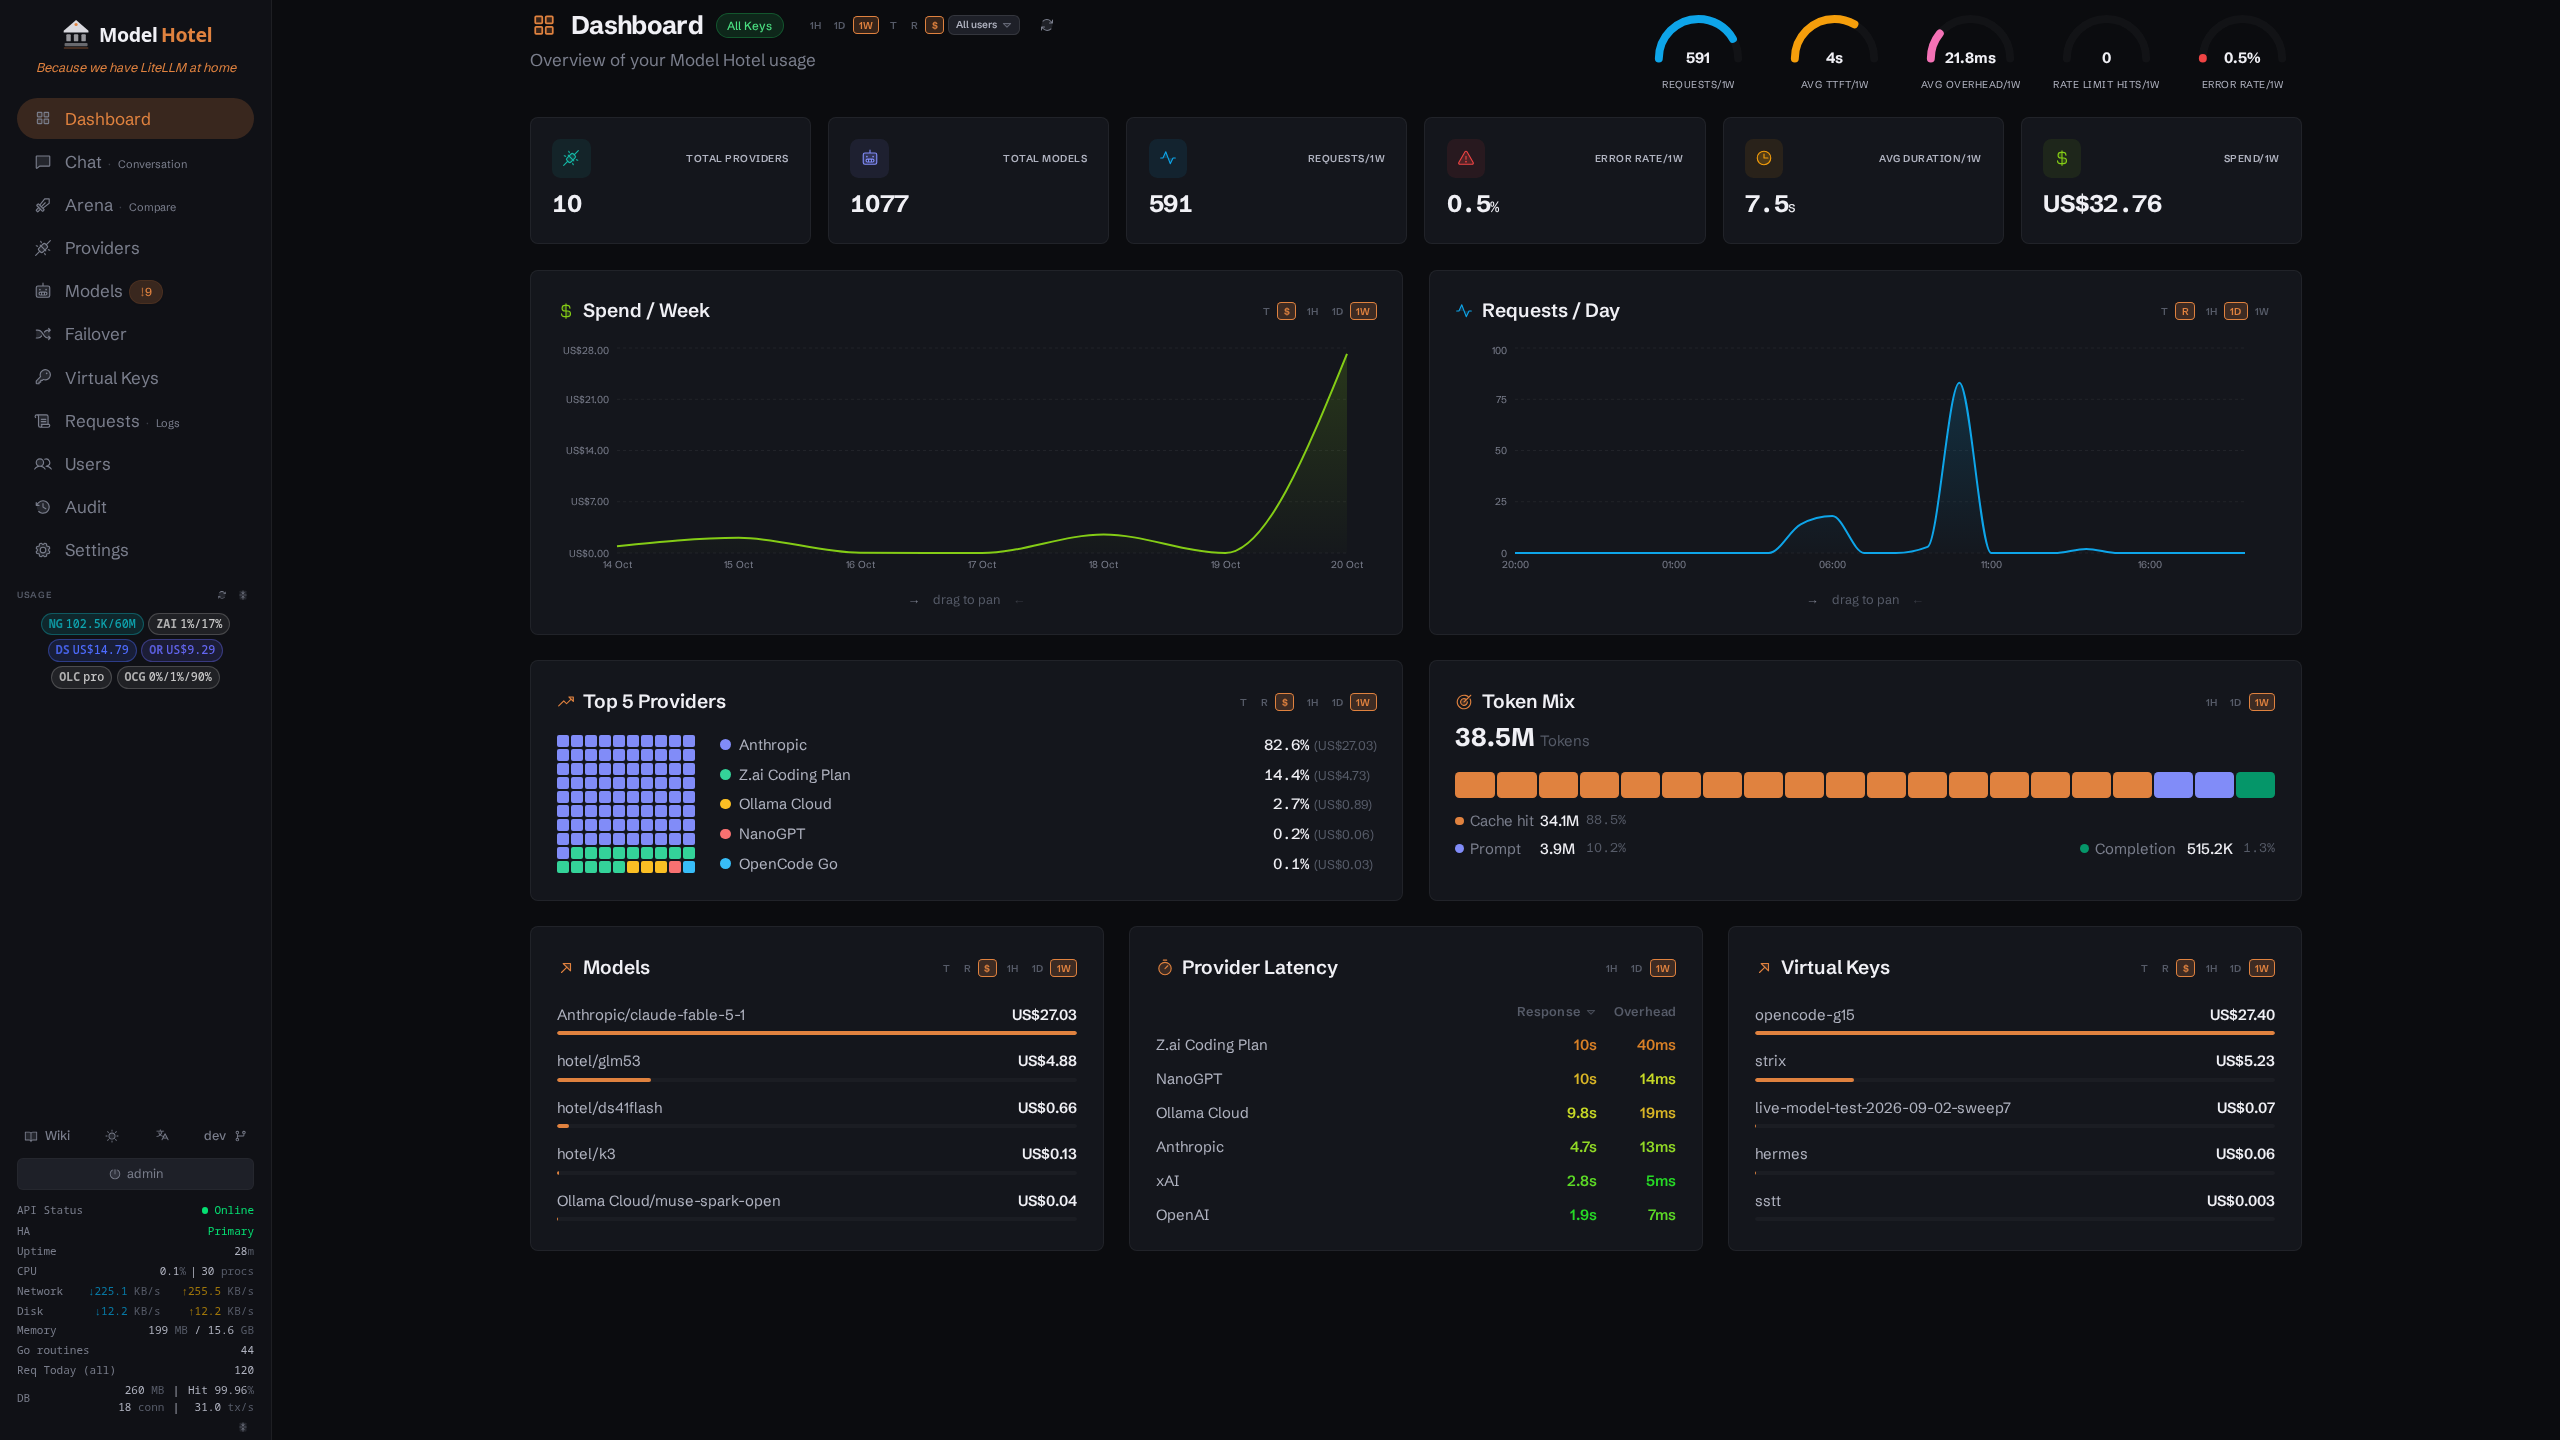
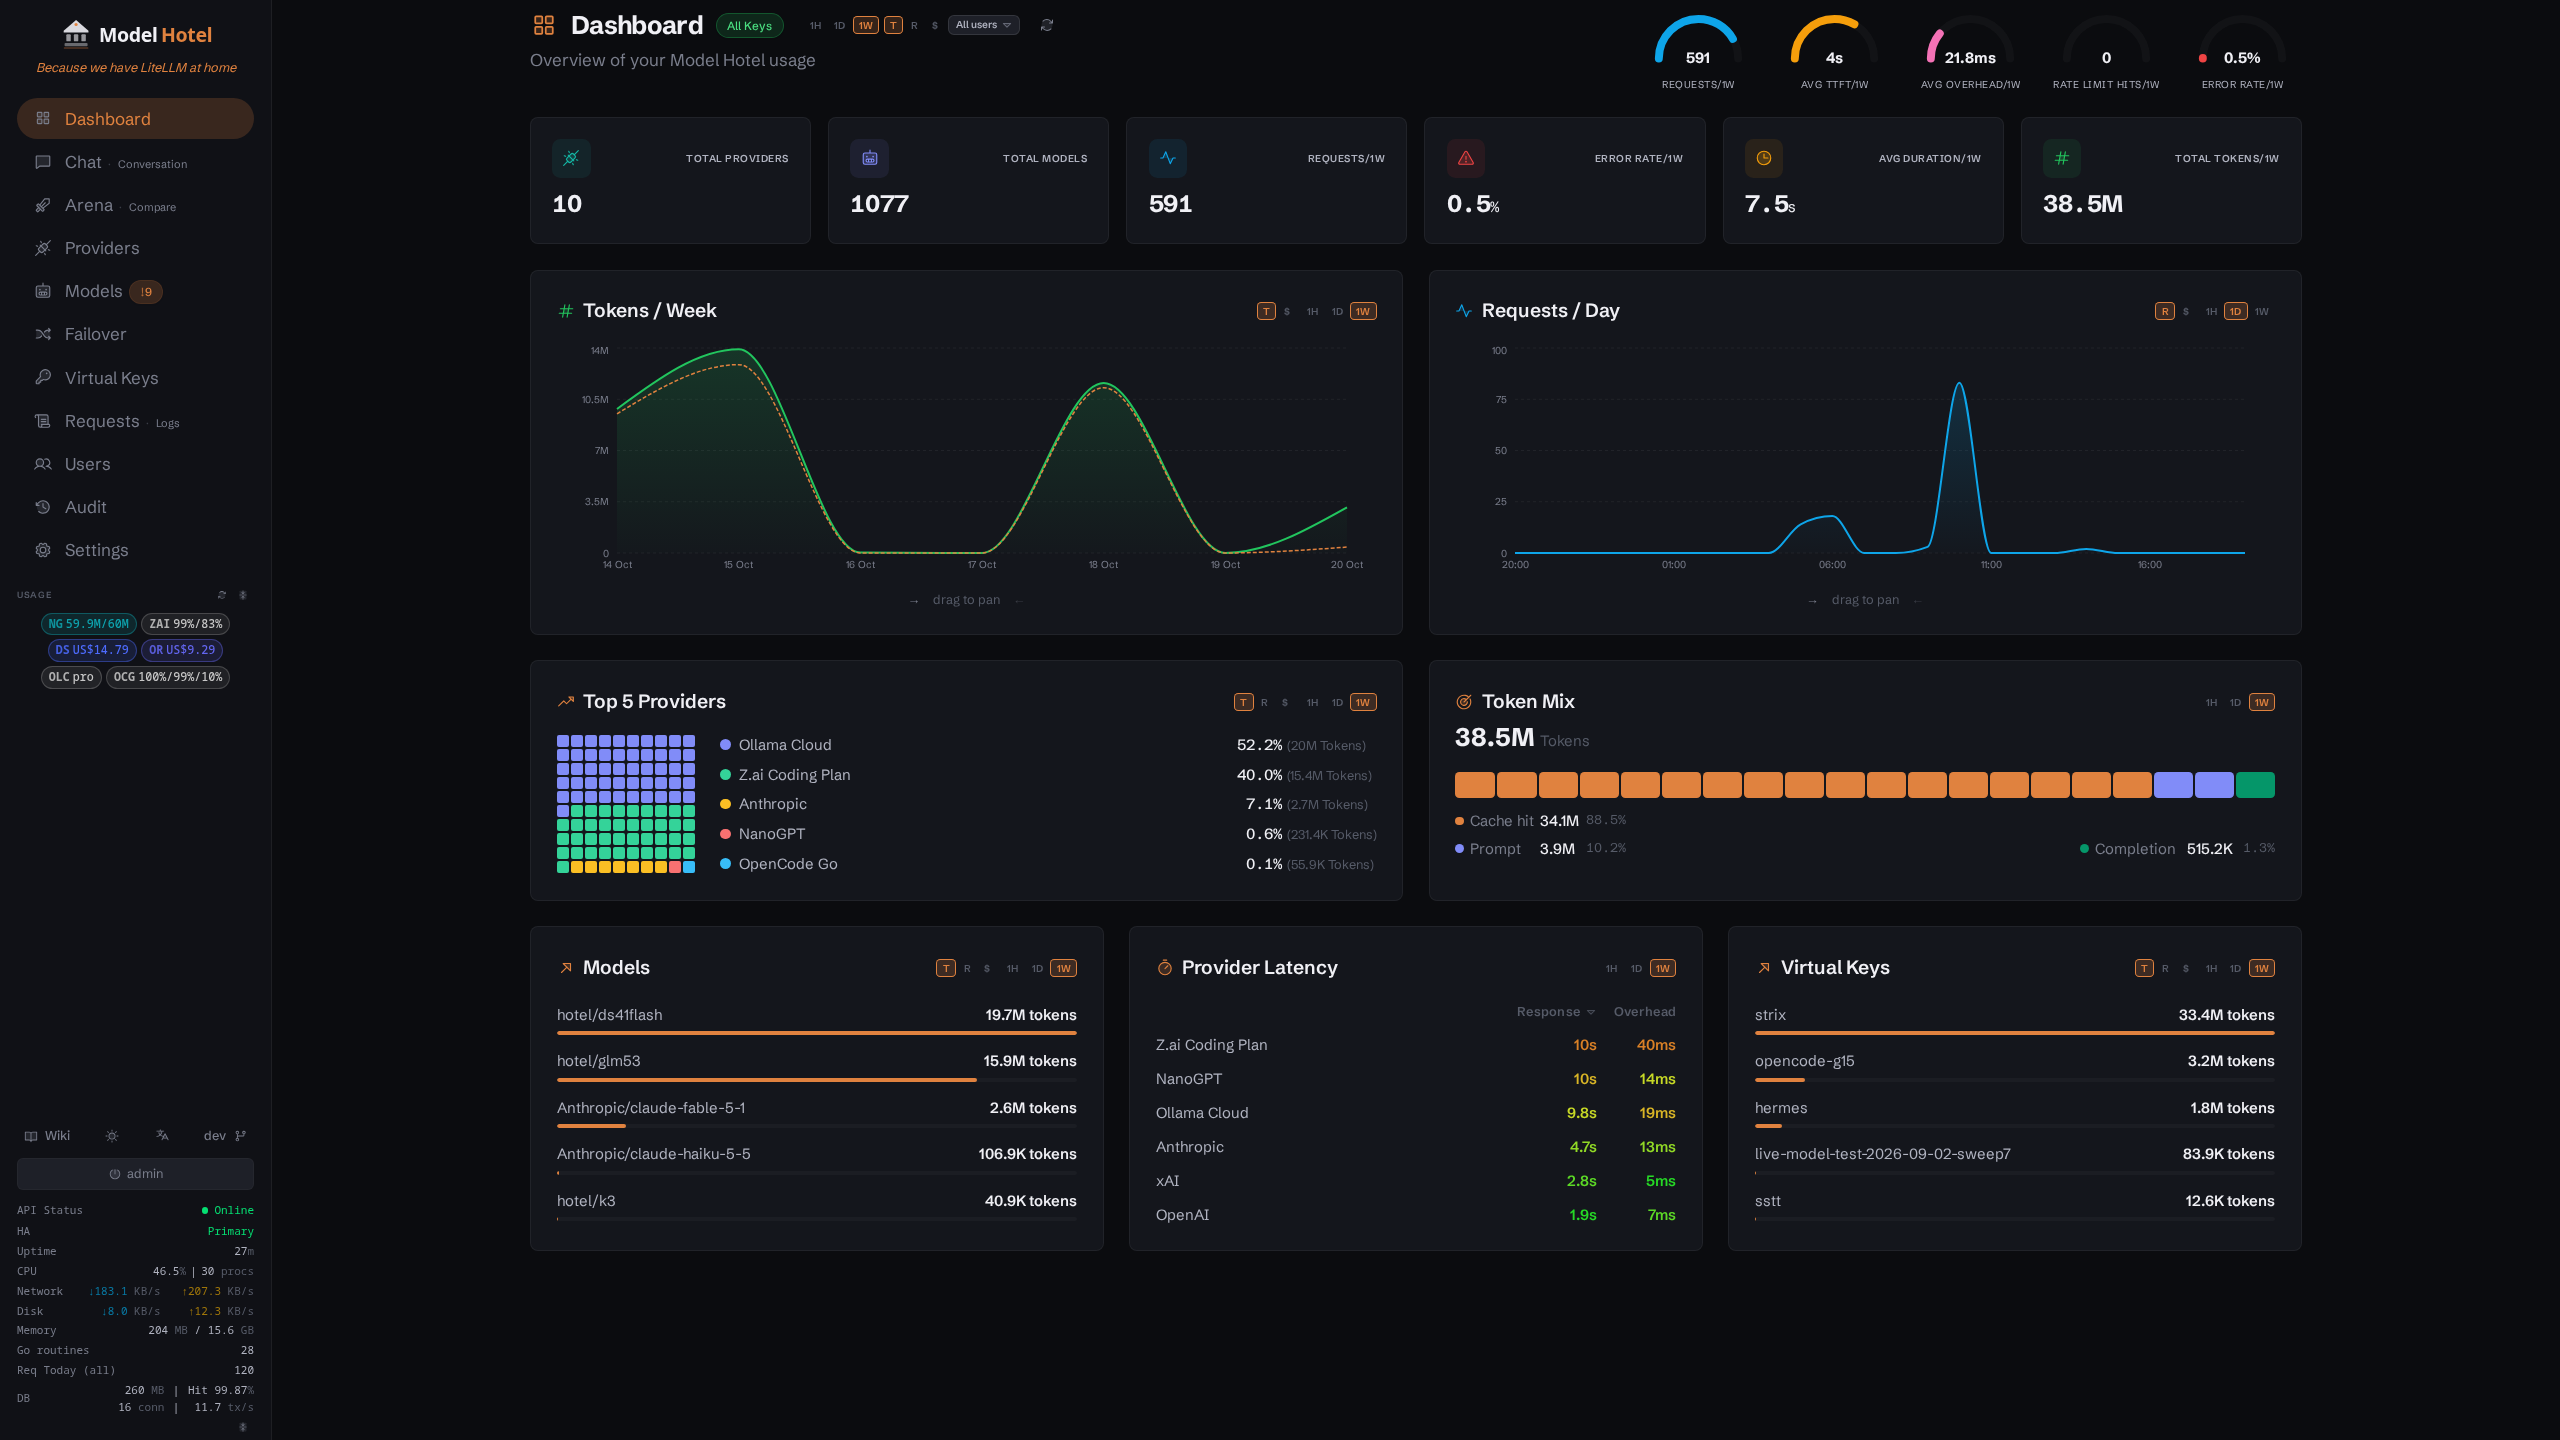
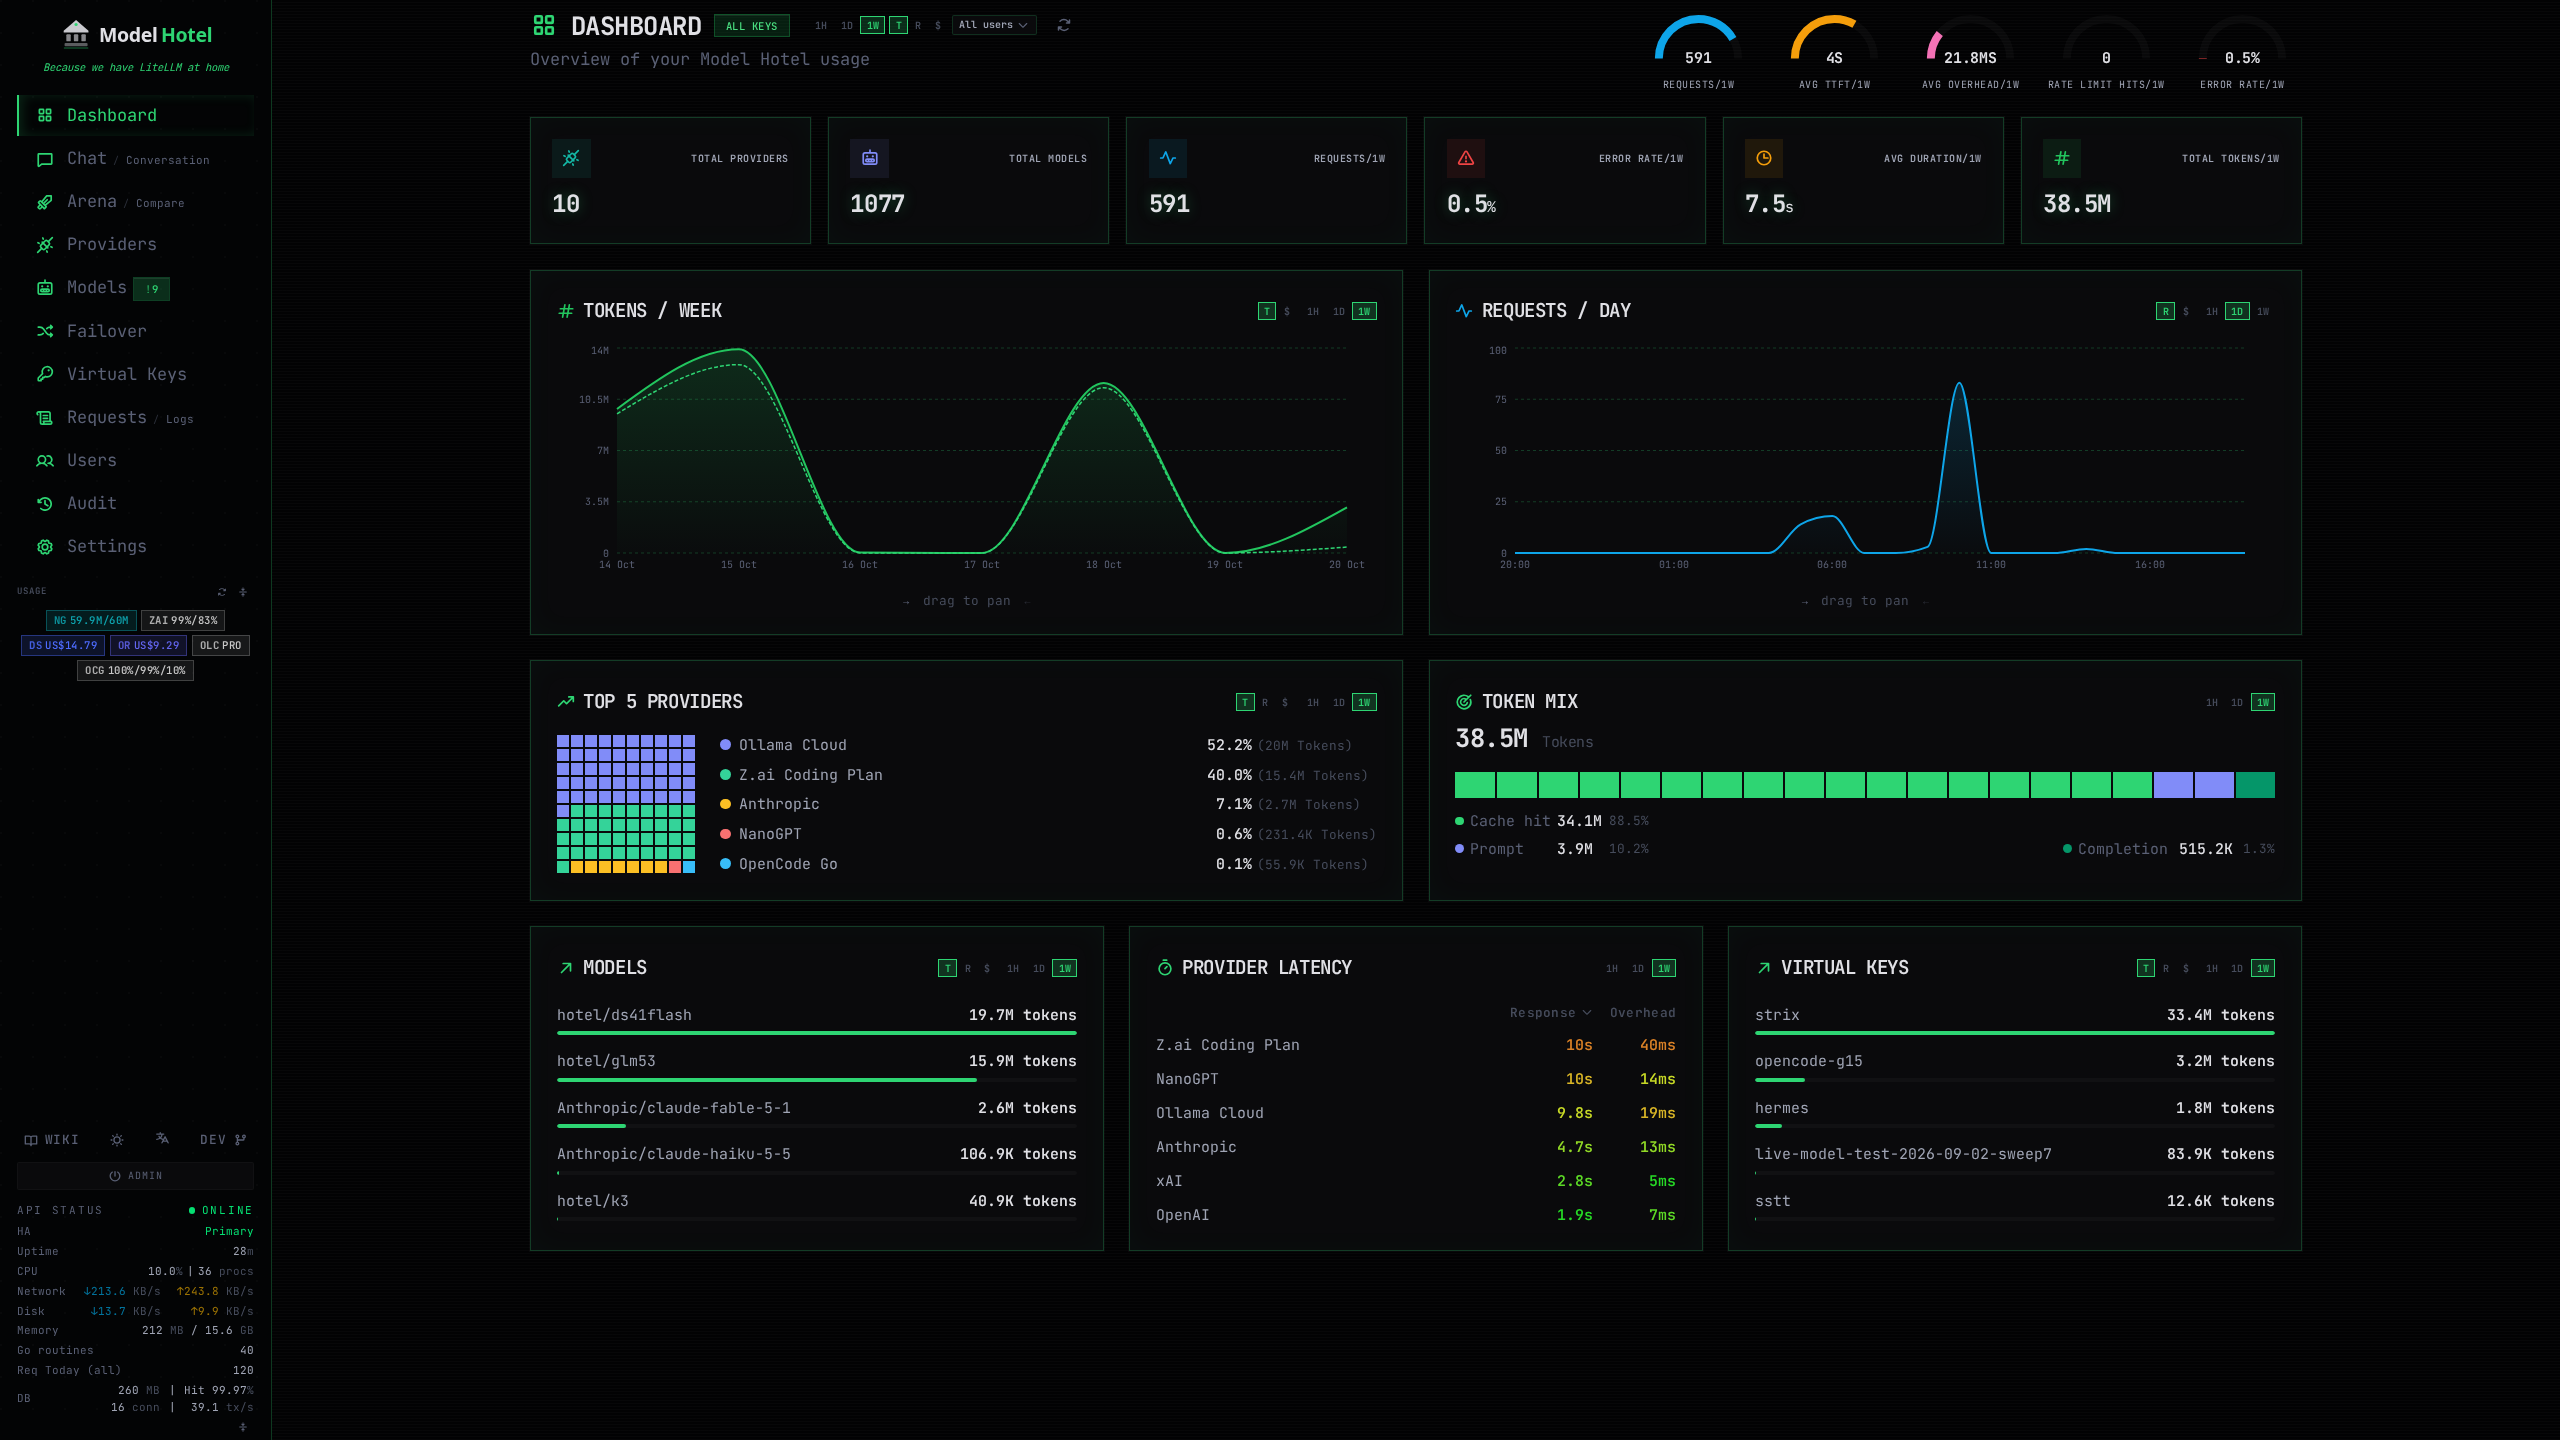
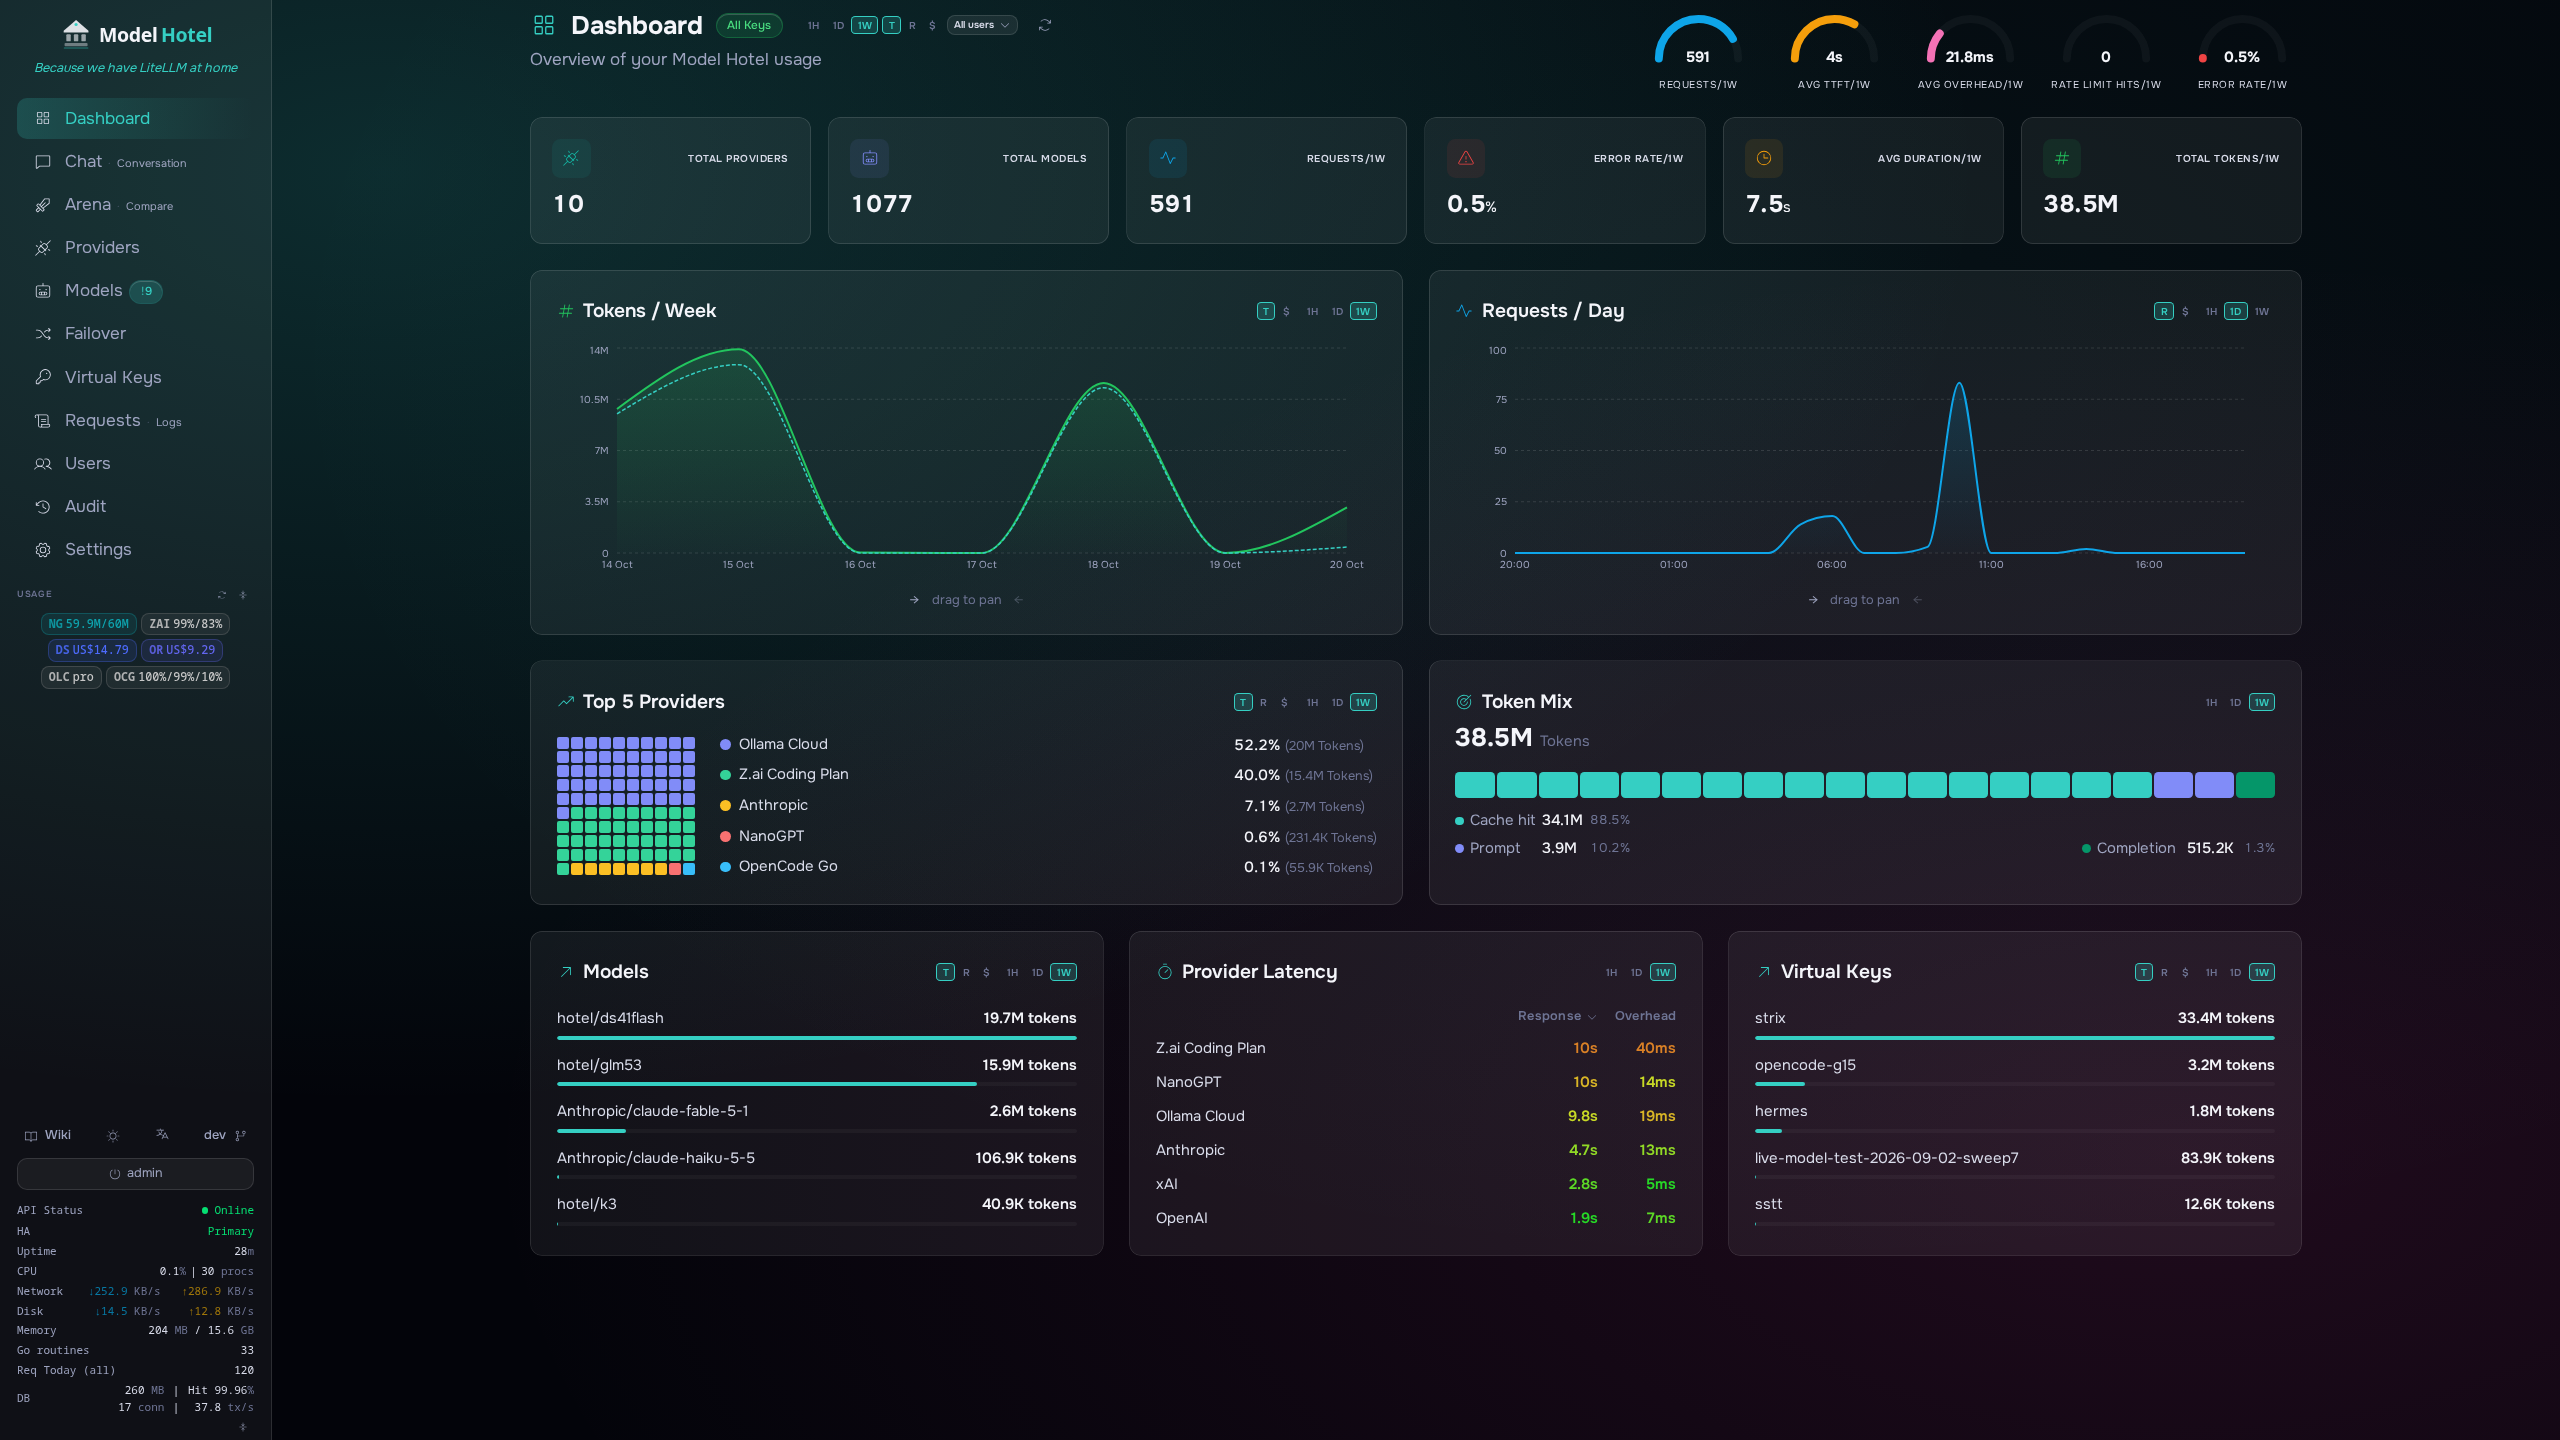
The Dashboard reads the same per-token prices as the Cost column: its header toggles between tokens, requests and dollars (T / R / $), and in the $ state the spend tile, the spend chart and the per-provider, per-model and per-key panels all show what the period cost. A model with no known prices meters at zero; hovering the spend tile shows how many served requests went unpriced.
 · Built-In Model Discovery
Add a provider and the service pulls the model list automatically via the provider's own API. Models are kept in sync on a schedule you control (default every 6 hours, configurable). Models that disappear from a provider's listing are disabled (never deleted) and come back automatically if the provider lists them again; manual disables are always respected. After a manual scan, a summary modal shows exactly what changed: models added, re-enabled, or disabled, any live pricing or context-length changes on existing models, plus any failover groups that were updated or deleted as a result. Changes detected by scheduled/startup background discovery instead surface as a count badge on the Models nav item; clicking the badge opens a summary of those changes and clears it. Discovery-disabled models carry a "not listed by the provider since…" tooltip on the Models page so they're easy to tell apart from manual disables. The following providers get enriched metadata beyond what the generic OpenAI-compatible endpoint returns:
| Provider | Context Length | Pricing | Reasoning Flags | Input/Output Modalities | Source |
|---|---|---|---|---|---|
| DeepSeek | ✅ | ✅ | ✅ | ✅ | API (/models) + Catalog |
| NanoGPT | ✅ | ✅ | ✅ | ✅ | API (/models?detailed=true) |
| Z.AI | ✅ | ✅ | ✅ | ✅ | API (/models) + Catalog |
| OpenCode Go | ✅ | ✅ | ✅ | ✅ | API (/models) |
| OpenCode Zen | ✅ | ✅ | ✅ | ✅ | API (/models) + Catalog |
| OpenAI | ✅ | ✅ | ✅ | ✅ | API (/models) + Catalog |
| OpenRouter | ✅ | ✅ | ✅ | ✅ | API (/models) |
| Anthropic | ✅ | ✅ | ✅ | ✅ | API + models.dev |
| xAI | ✅ | ✅ | ✅ | ✅ | API (/language-models) + Catalog |
| Kimi Code | ✅ | models.dev | ✅ | ✅ | API (/models) + models.dev |
| Google AI Studio | ✅ | ✅ | ✅ | ✅ | API (/v1beta/models) + models.dev |
| Cohere | ✅ | ✅ | ✅ | ✅ | API (/v1/models) + Catalog |
| Ollama Cloud | ✅ | models.dev | ✅ | ✅ | API (/api/show) |
| As of writing, and for hosted providers only. A checkmark means discovery fills that field, from the provider's API where the API offers it and from the built-in catalog or models.dev otherwise; a model none of the three knows yet keeps empty values until one catches up, and a value you edit by hand stays yours across rescans. Self-hosted servers (Ollama, LM Studio, KoboldCPP, LocalAI, SGLang, TabbyAPI) are left out: what they serve, and at what price, is yours to decide. |
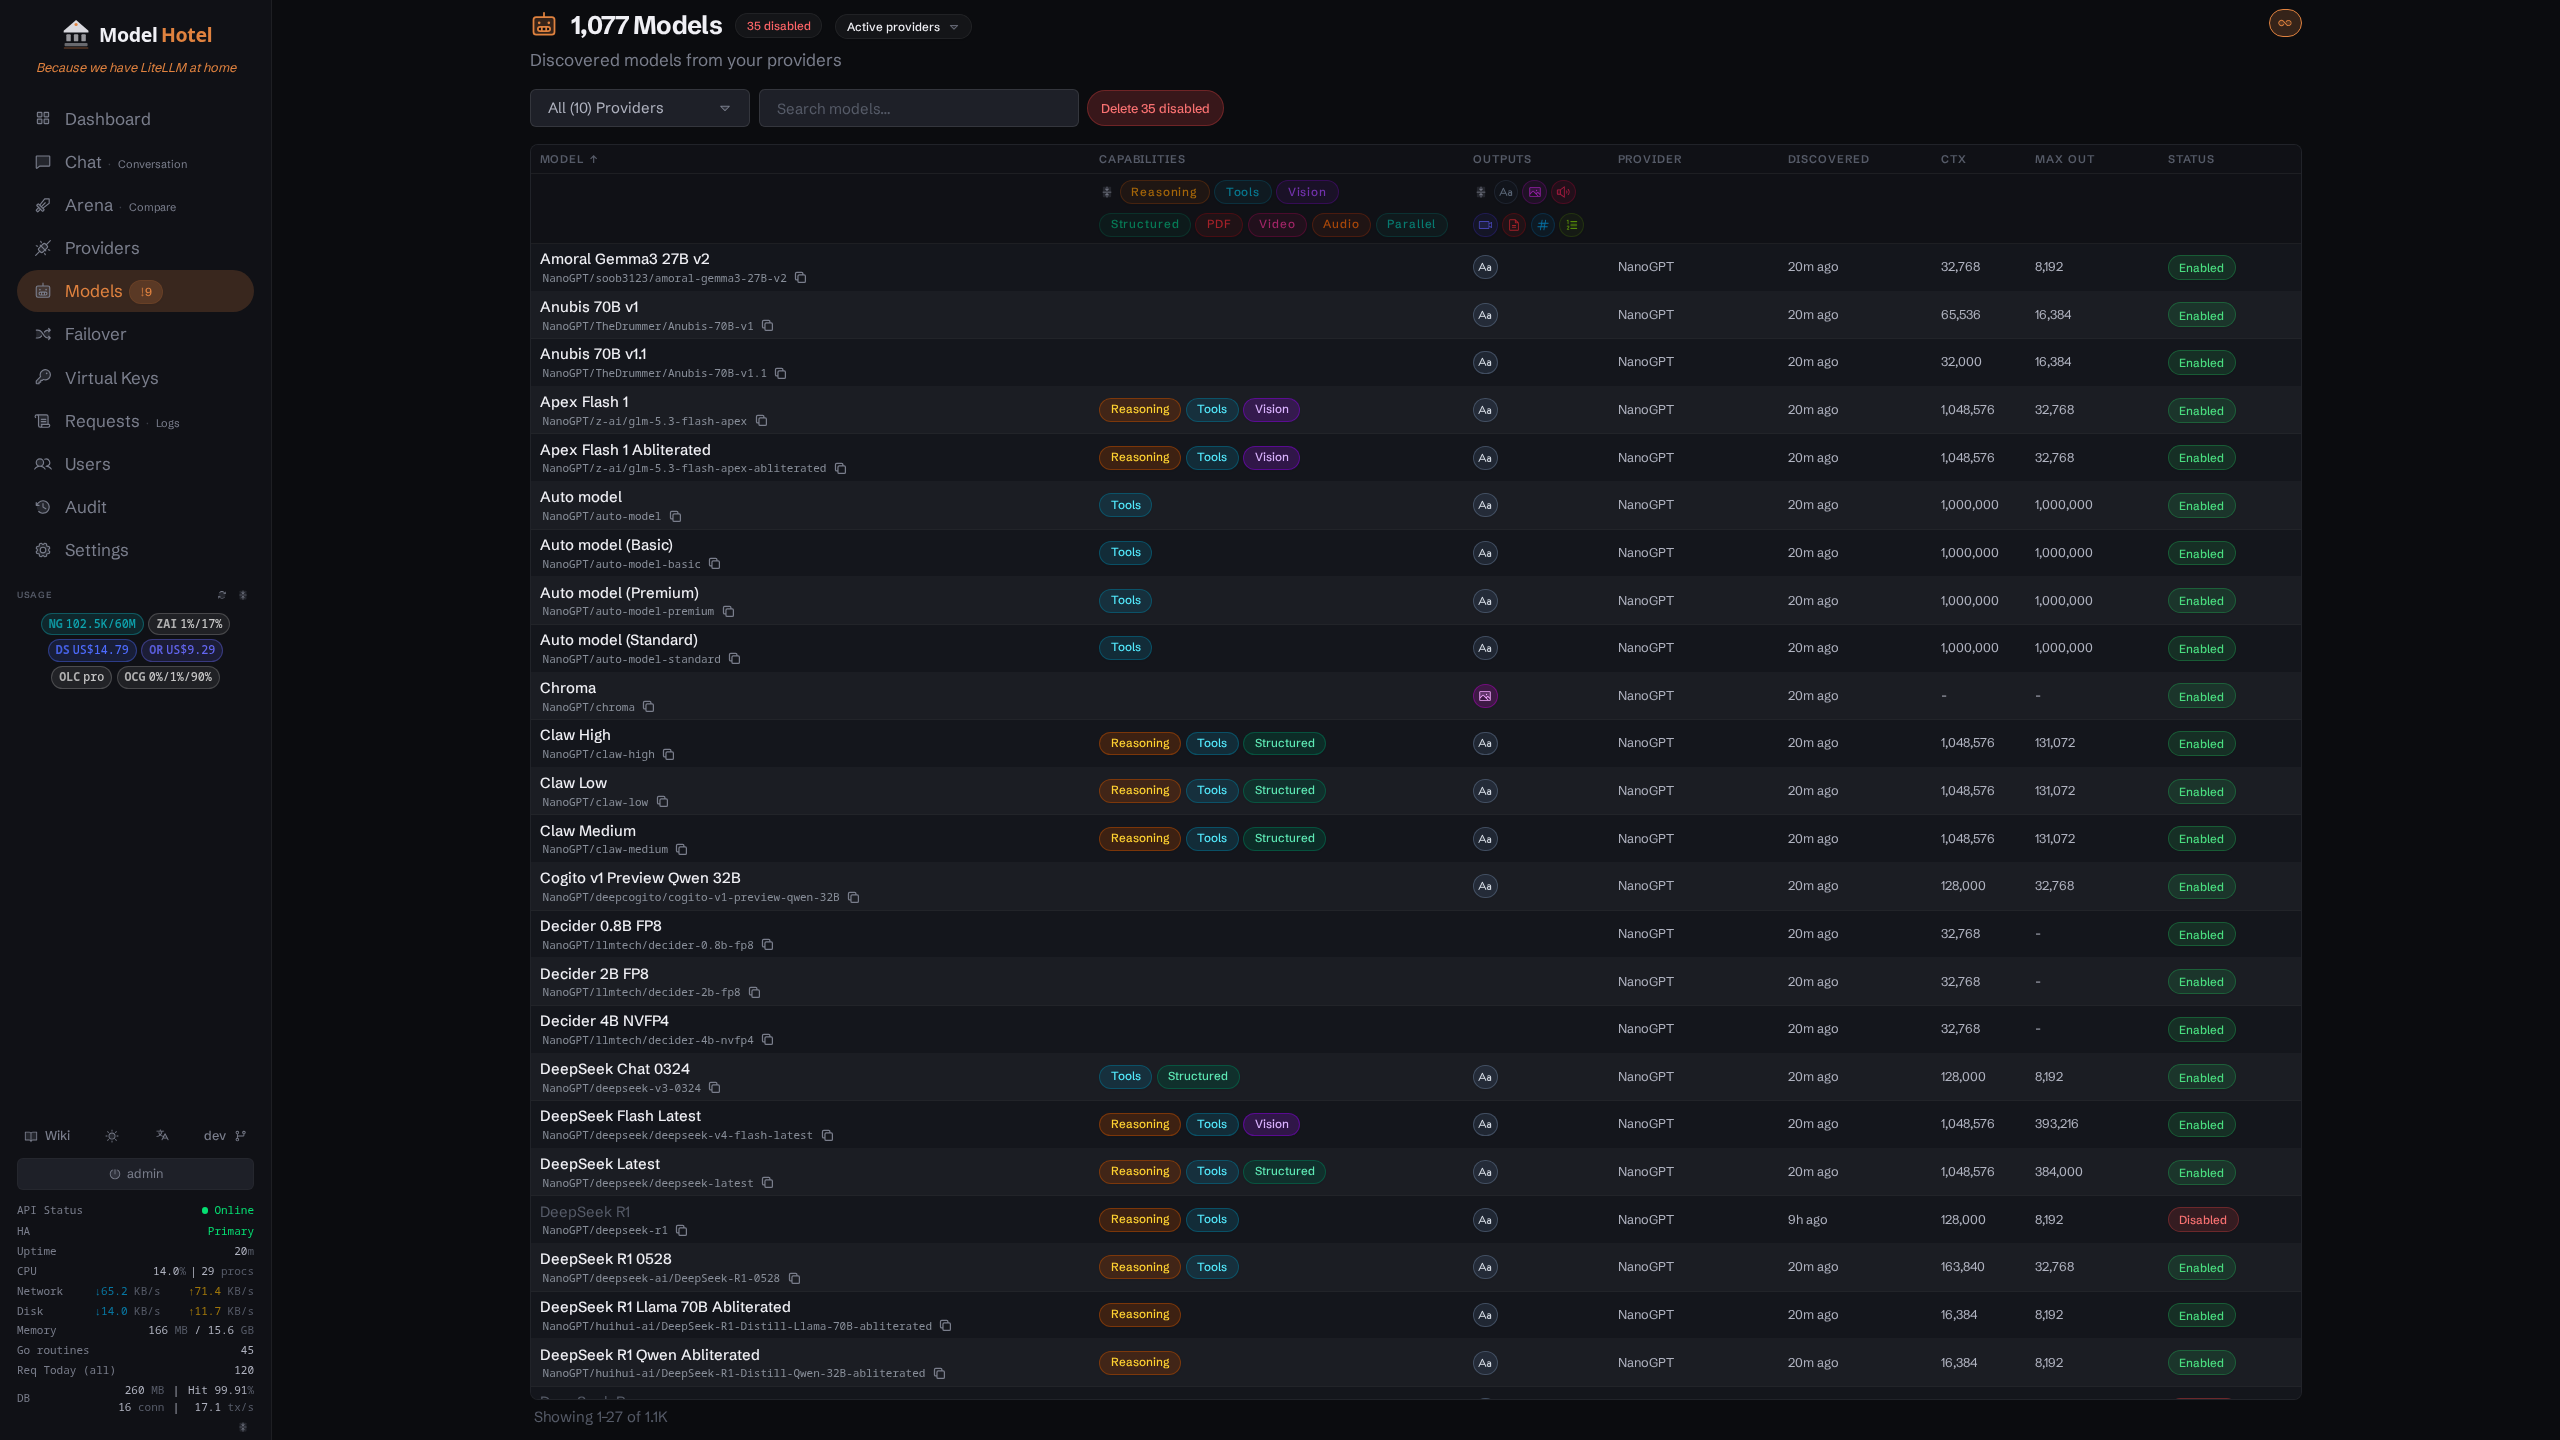
Every hosted model is then enriched from models.dev, an open-source model catalog that provides pricing, context limits, capabilities, and modality data for 200+ providers. The enrichment is non-destructive: it only fills fields that are empty or missing, never overwriting data that was already populated. This makes the full precedence per field live provider data → built-in catalog → models.dev → empty: you get the freshest values the provider reports, the catalog and models.dev only fill what's missing, and a stale catalog can never mask fresh live data. Custom endpoints and self-hosted servers are left out of both the catalog and models.dev steps: they serve whatever their operator loaded, and a local model named like a hosted one is not that model. If models.dev is unreachable, discovery proceeds normally using whatever data the provider returned and the download is retried in the background, so your existing catalog is never at risk.
 · Model Health at a Glance
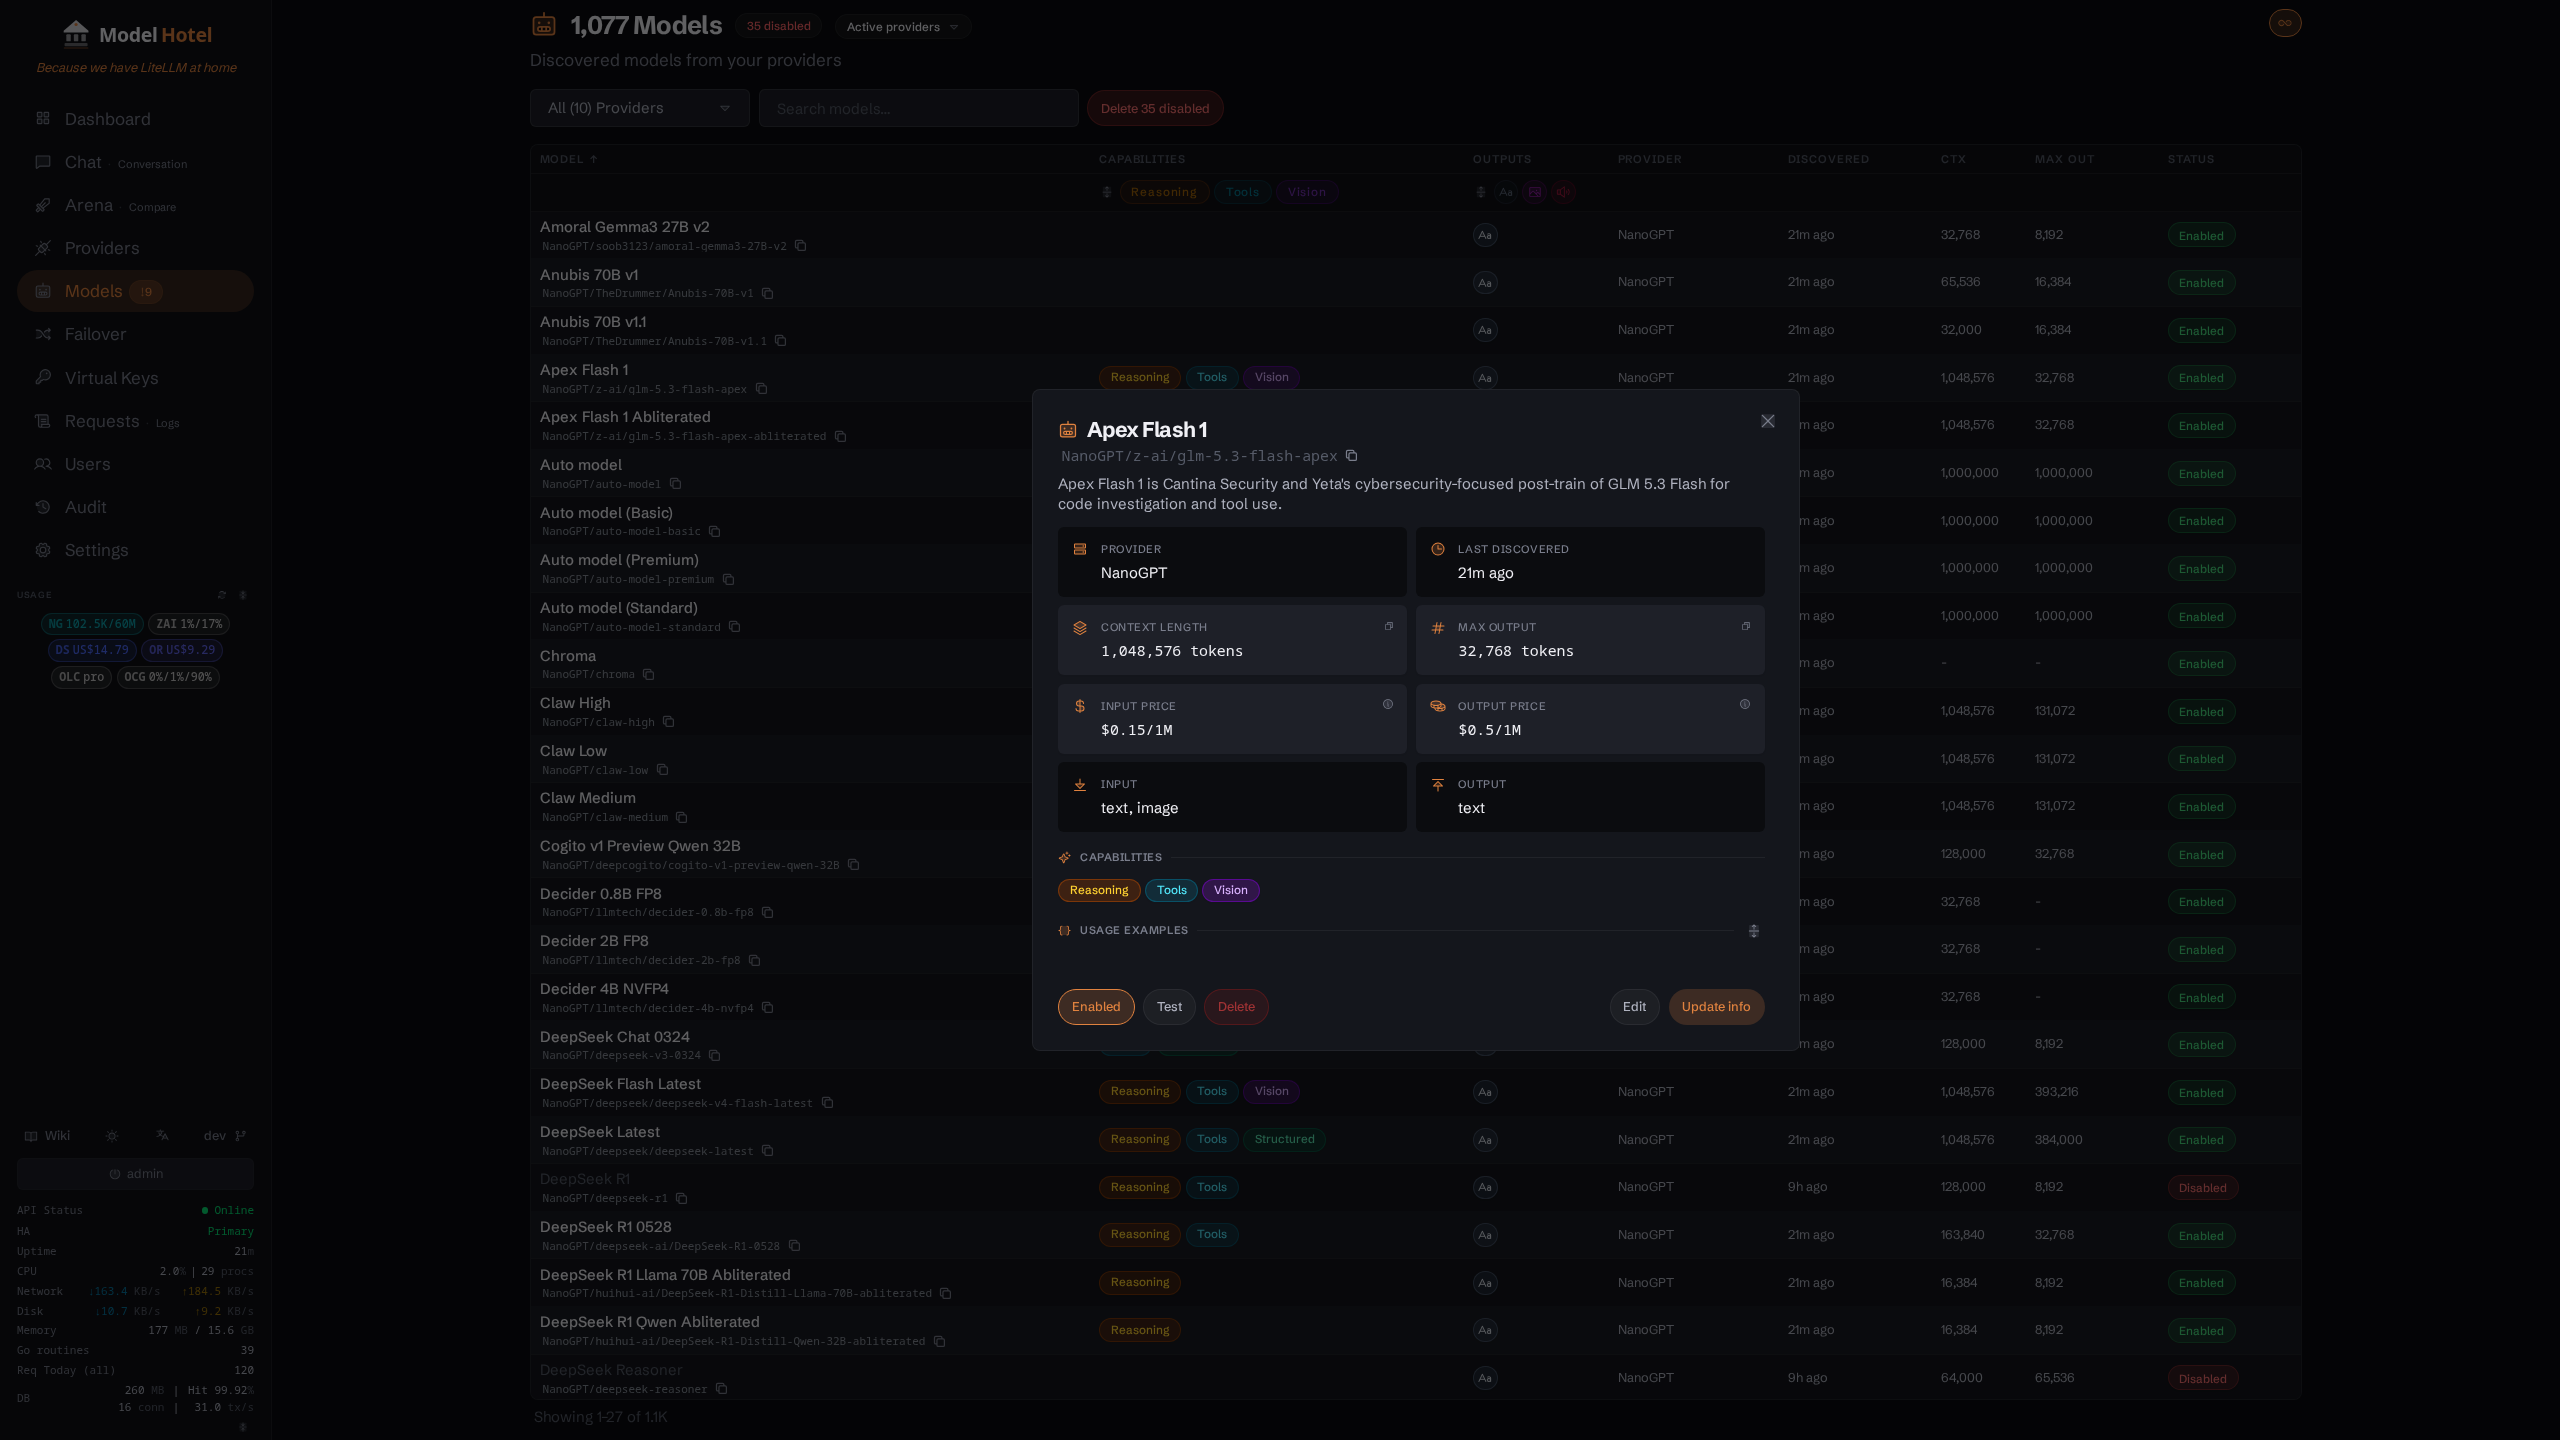
Test any model from the Models page with a single click. The test sends a minimal chat completion directly to the provider and reports total duration and the actual model response, so you know the provider is alive and responsive. DeepSeek providers show live account balance and OpenRouter providers show credit balance; Ollama Cloud providers show plan status; NanoGPT, Z.AI, Kimi Code, MiniMax and OpenCode Go providers show quota and usage data; NeuralWatt providers show energy quota and credit balance (Standard plan or higher). All of these are fetched from their respective APIs and shown on both the provider cards and the sidebar quota panel.
· Provider Quotas & Usage
For providers that expose it, click a provider's quota badge (on its card or in the sidebar panel) to open a live usage breakdown - no need to leave the dashboard for the provider's billing page. OpenRouter shows credit balance and per-key spend; Z.ai Coding Plan shows its 5-hour, weekly, and MCP token quotas; Kimi Code shows its 5-hour and weekly quotas plus parallel-request limit and membership tier; MiniMax shows its 5-hour and weekly Token Plan quotas by model class; NanoGPT shows weekly token and daily image quotas with subscription details; OpenCode Go shows its rolling 5-hour, weekly and monthly plan quotas with their reset times; NeuralWatt shows energy-based quota with subscription and lifetime usage. Each modal toggles between quota used and quota remaining, and refreshes on demand. Some providers surface usage without a dedicated modal - DeepSeek shows account balance and Ollama Cloud shows plan status on their cards and sidebar badges.


 · Themeable UI
Make the dashboard your own from the Appearance settings. Pick one of three UI styles: Clean SaaS (refined and minimal, the default), Cyber Terminal (high-contrast, developer-centric), or Glassmorphism (slick translucent surfaces). Then toggle dark / light mode, and choose an accent color (each style ships a tasteful default, or pick your own). Everything persists locally in the browser.
 · Interactive Chat & Arena
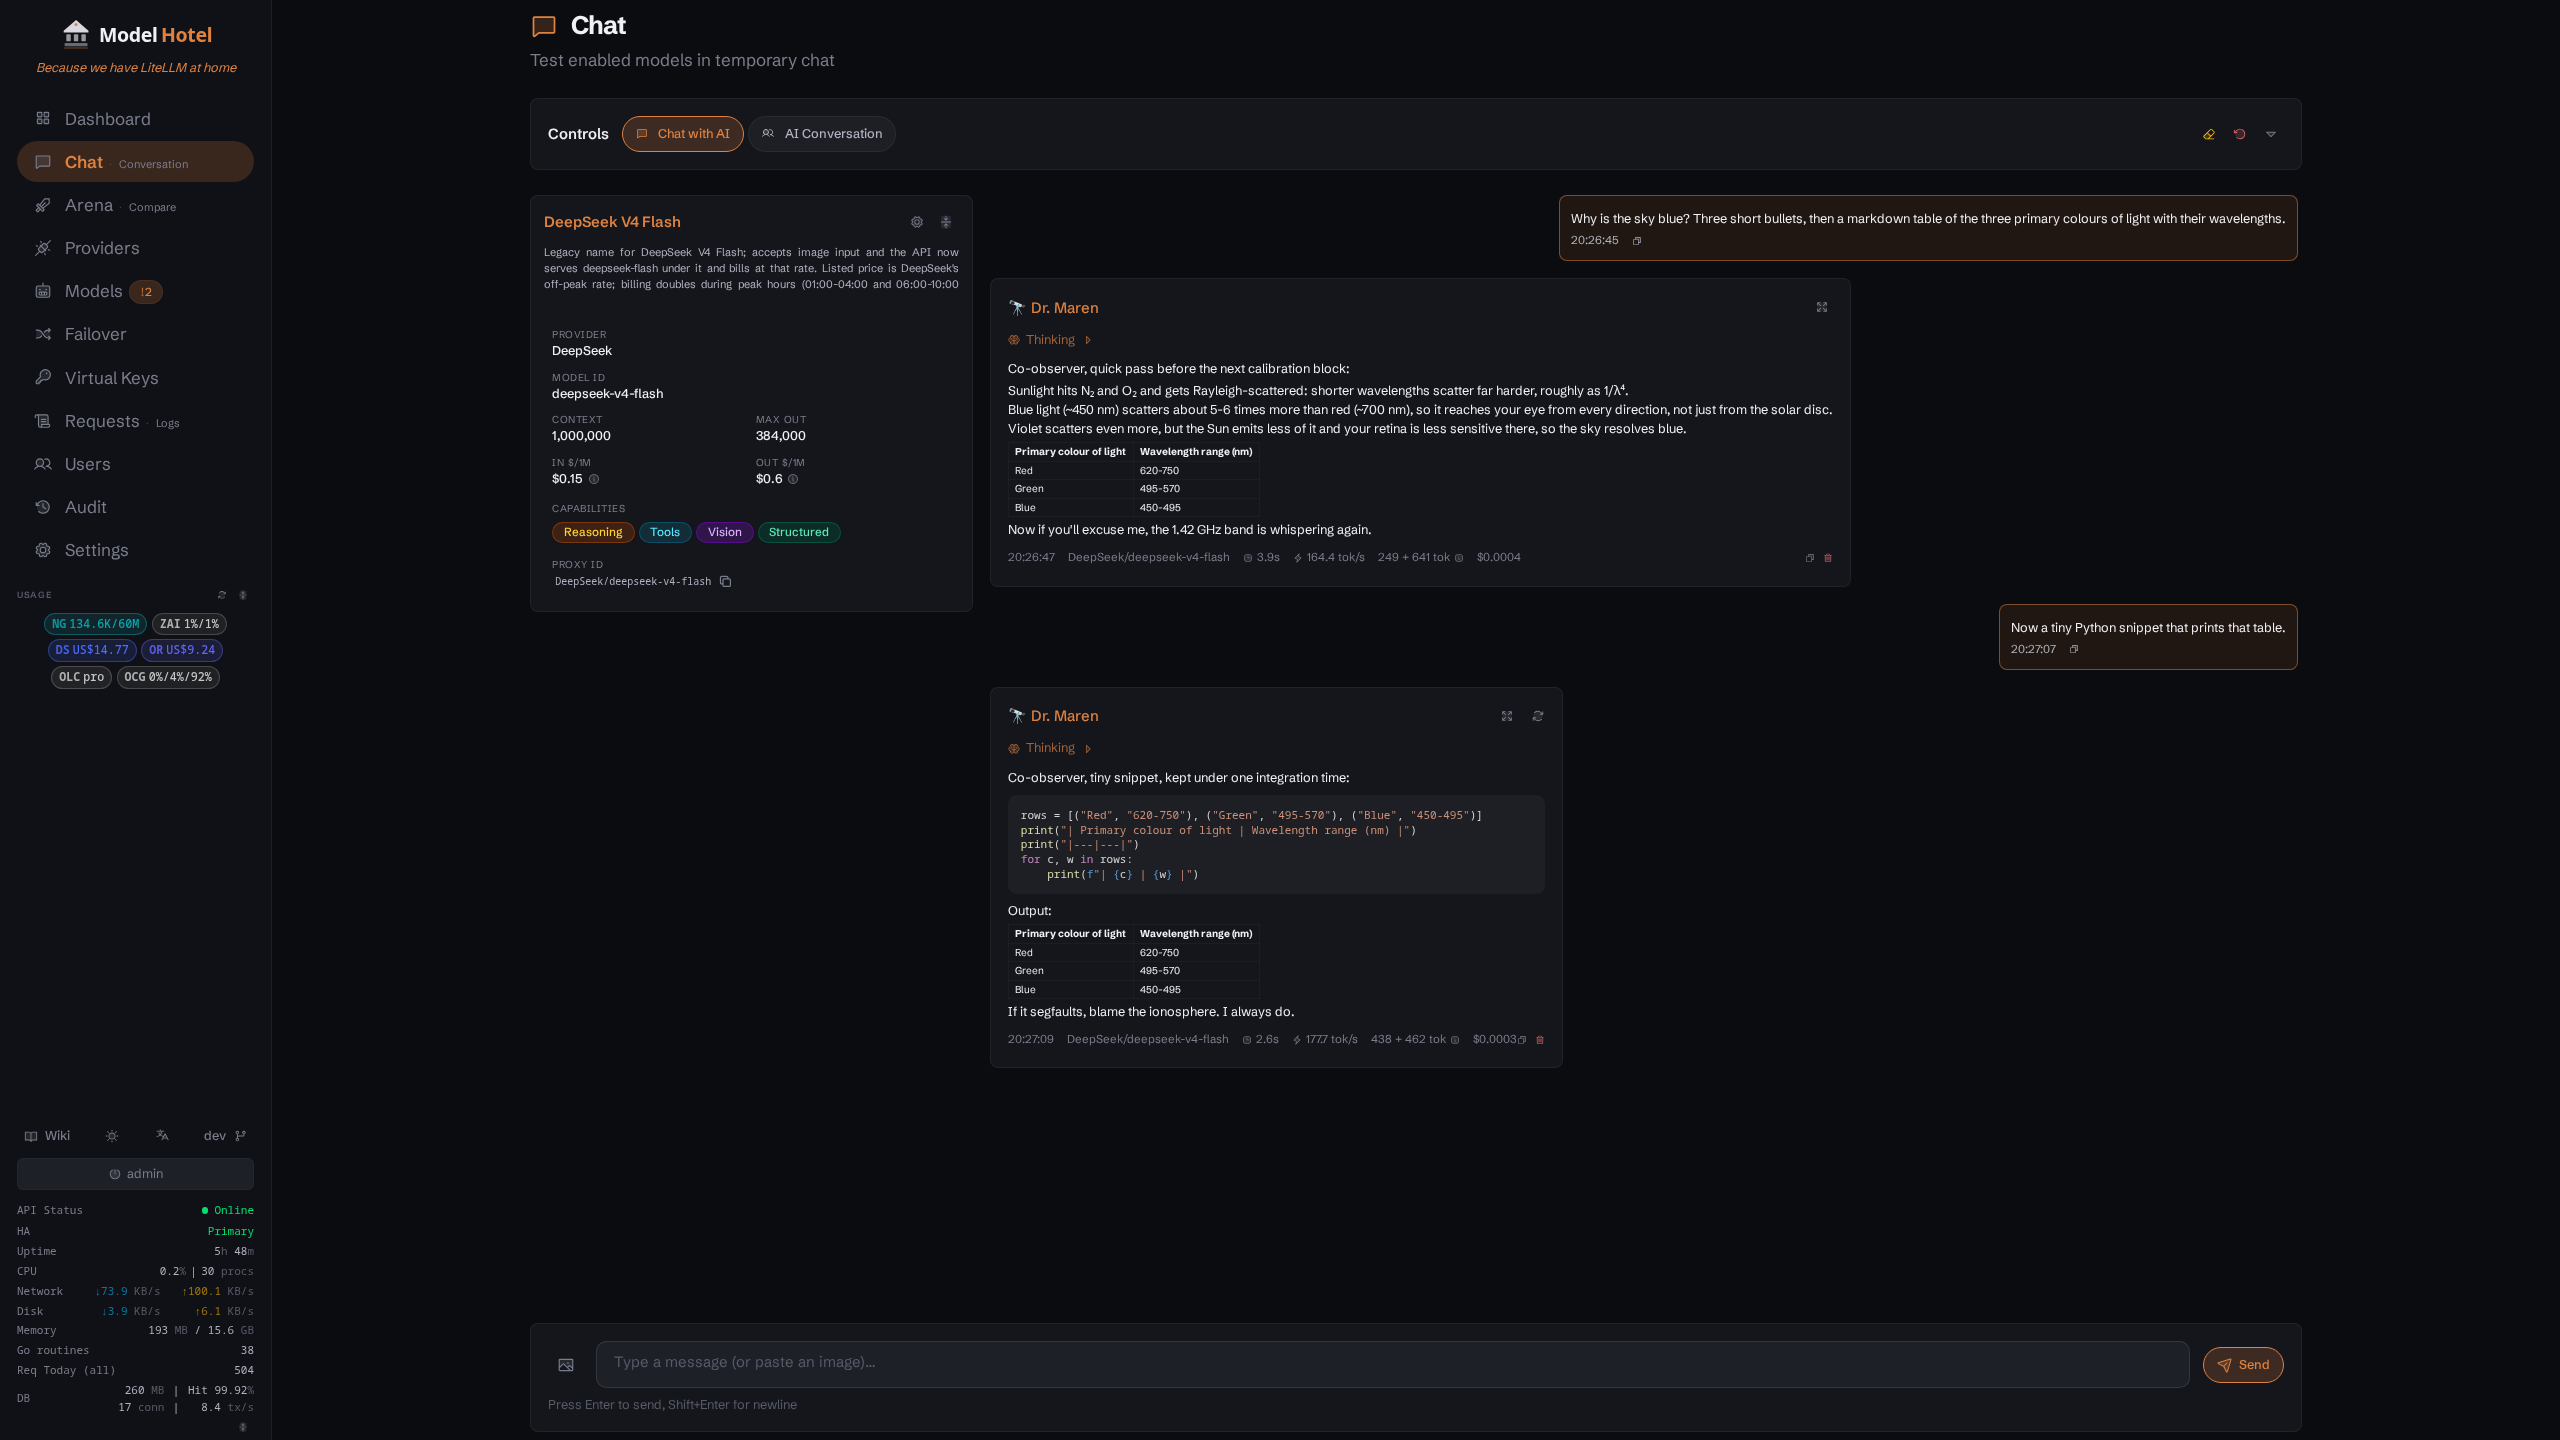
The dashboard includes a built-in Chat interface for testing models interactively, with support for system personas (presets or custom prompts), generation parameters (temperature, top_p, max_tokens, min_p, top_k, frequency/presence penalties), and streaming responses with collapsible thinking-block rendering. Vision-capable models show an image upload button: attach a photo for the model to describe or analyze. Audio-capable models show an audio upload button for sending audio input. Attachments are sent as OpenAI-compatible multimodal content parts (image_url, input_audio). Switch to Conversation mode to watch two models talk to each other: enter a starter prompt, set the number of rounds and optional delay between turns, and observe the back-and-forth with per-message metrics (duration, tokens, chars/sec).
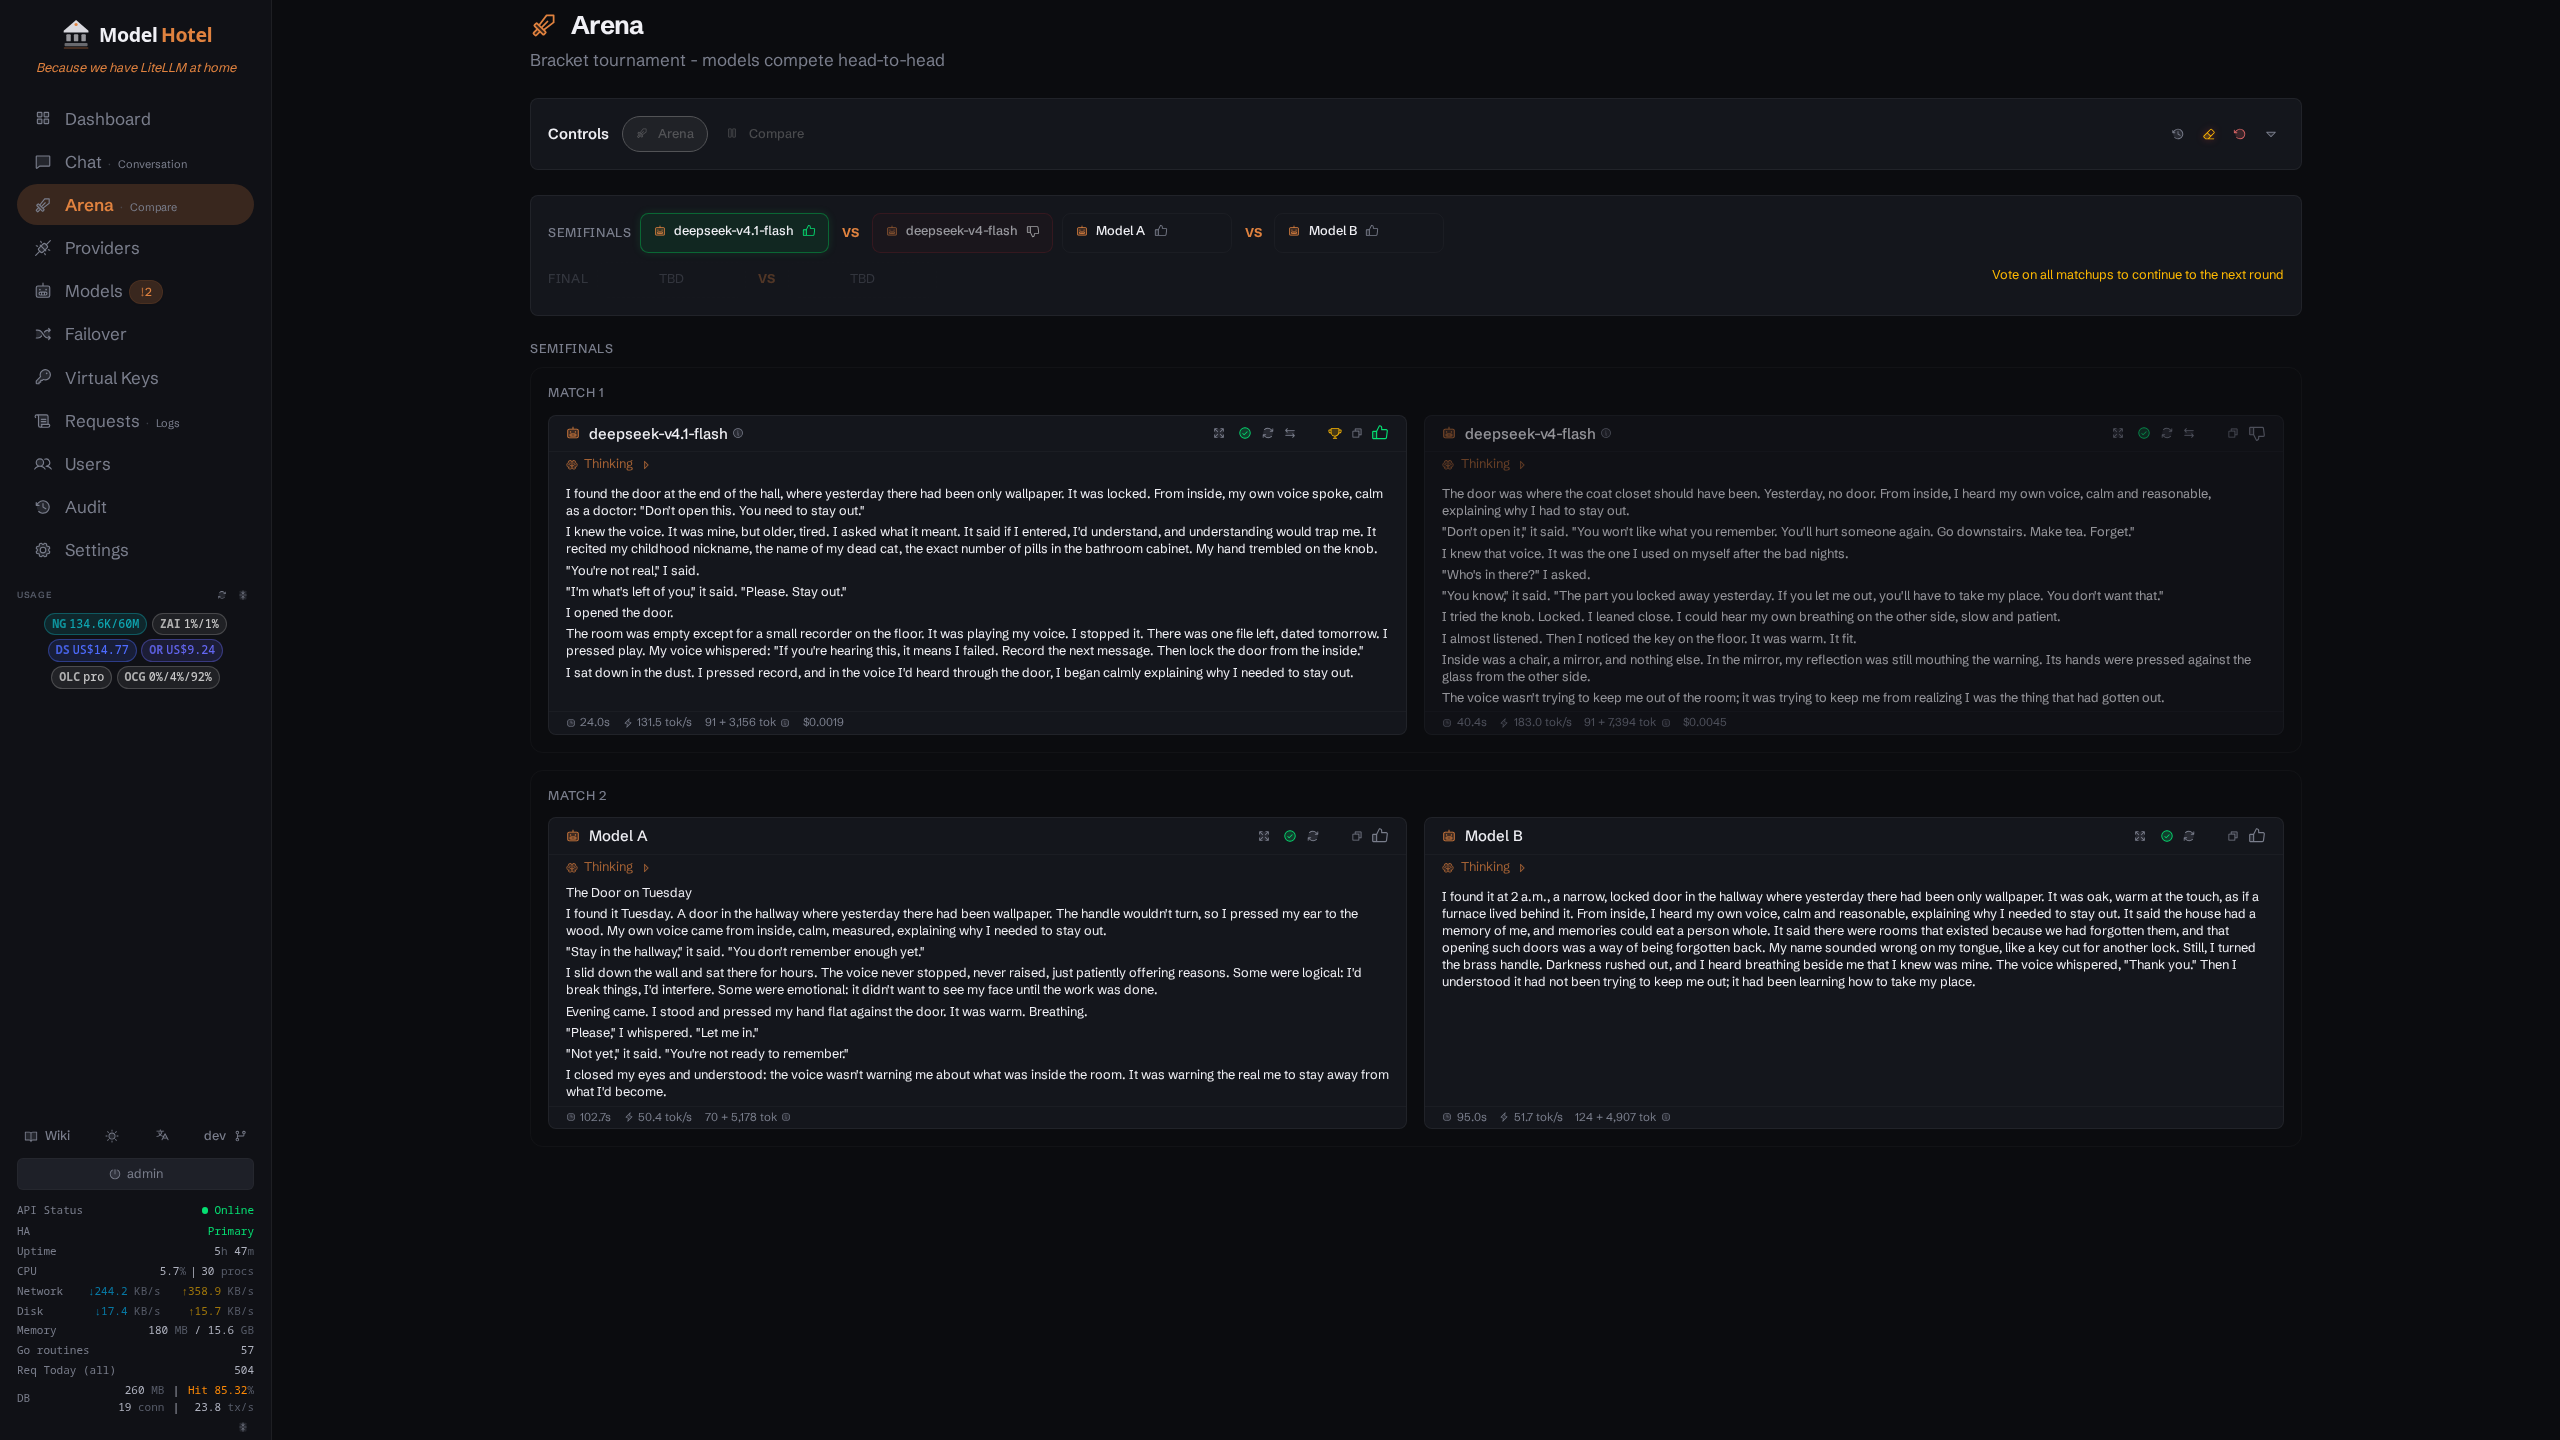
Arena mode offers two sub-modes: Competition runs bracket tournaments where models face off in pairwise matchups. Voting is blind: each matchup shows its two replies as Model A and Model B in a random order and reveals the names only once you have voted, and the bracket auto-advances to the next round until a champion emerges. Compare places two or more models in a grid with the same prompt for parallel evaluation, with a shared persona and no voting. Both modes support per-model generation parameters, streaming with thinking-block rendering, and per-response metrics (duration, tokens per second, prompt and completion tokens, and an estimated price from the model's listed rates). With Arena History enabled (see No Prompts Logged), past sessions are saved to an arena history modal for review and restoration.
· Real-Time Events & System Status
A live SSE event bus delivers toast notifications for discovery outcomes, model disabling events, token counting errors, circuit breaker state transitions, and stale-request alerts straight to the dashboard. Failover retries during proxying are logged but not pushed as SSE events. The sidebar polls system stats every 10 seconds, showing CPU, memory, disk I/O, and network throughput with color-coded warnings (orange at 75%, red at 90%). When running under Docker Compose, stats are aggregated across containers; otherwise, cgroup metrics are used. Goroutine count, database health (size, connections, cache hit ratio), API uptime, and process count are also displayed.
 · Security & Privacy
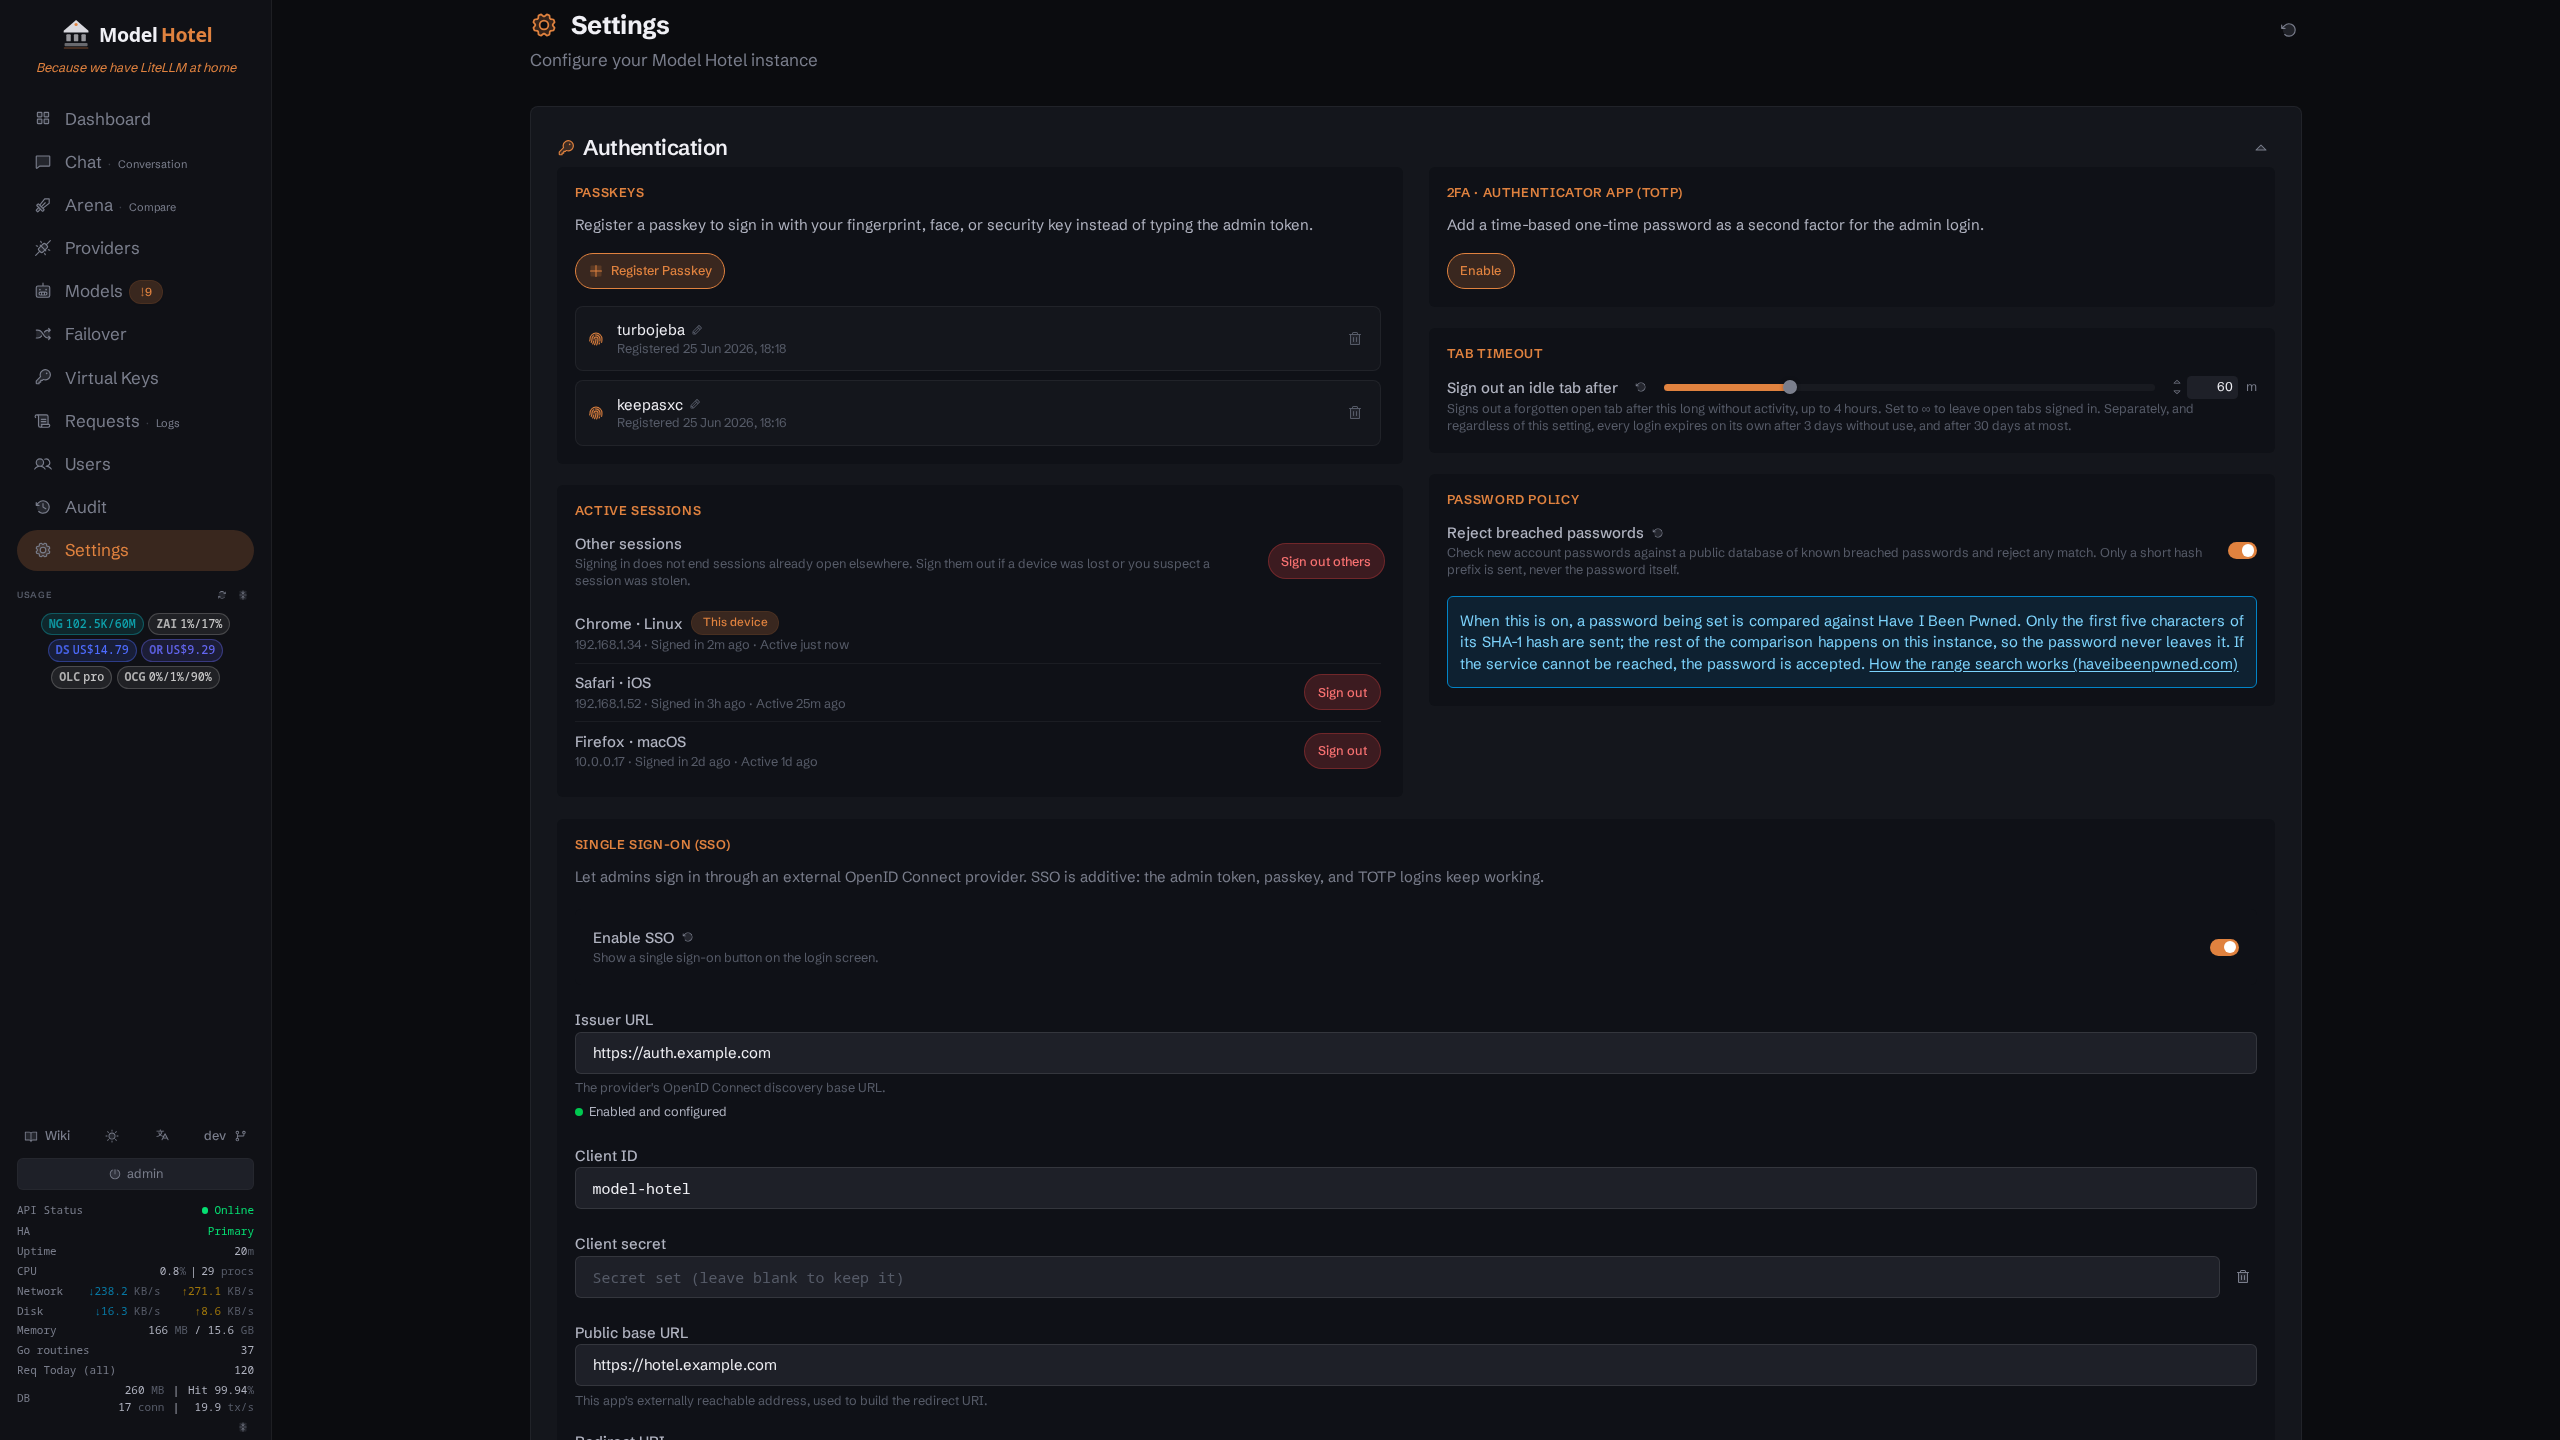
Secrets never sit in the clear: provider keys and SSO client secrets are encrypted at rest with AES-256-GCM under a MASTER_KEY strengthened by Argon2id, and virtual keys, the admin token and every session token are stored only as SHA-256 hashes. Outbound calls to providers go through SSRF protection that resolves each hostname, refuses private and cloud-metadata addresses and dials by IP, and every response carries the usual security headers. For the dashboard you pick how to log in: the admin token, a passkey (Touch ID, Windows Hello, YubiKey), the token plus an authenticator app as a second factor, single sign-on through any OpenID Connect provider, or GitHub. All of them mint the same short-lived session, SSO and GitHub are gated by an email allowlist, and local login always keeps working, so a misconfigured provider cannot lock you out. Repeated login failures and rate-limit abuse can be handed to CrowdSec at the edge. Everything from key derivation to session lifetimes is in the Security wiki.

 · Multi-User Access
Beyond the shared admin token, you can provision named dashboard accounts that sign in with a username and password (plus their own optional TOTP second factor) on the same login screen. Two roles: admin sees and does everything, while user accounts are scoped by granular grants (Chat/Arena, Usage dashboards, Request Logs, Models, Virtual Keys) so a teammate gets exactly the access they need and nothing more. Virtual keys belong to a user, and per-account rate limits (RPS/burst/TPM) and a per-account dollar budget aggregate across the keys that user owns.
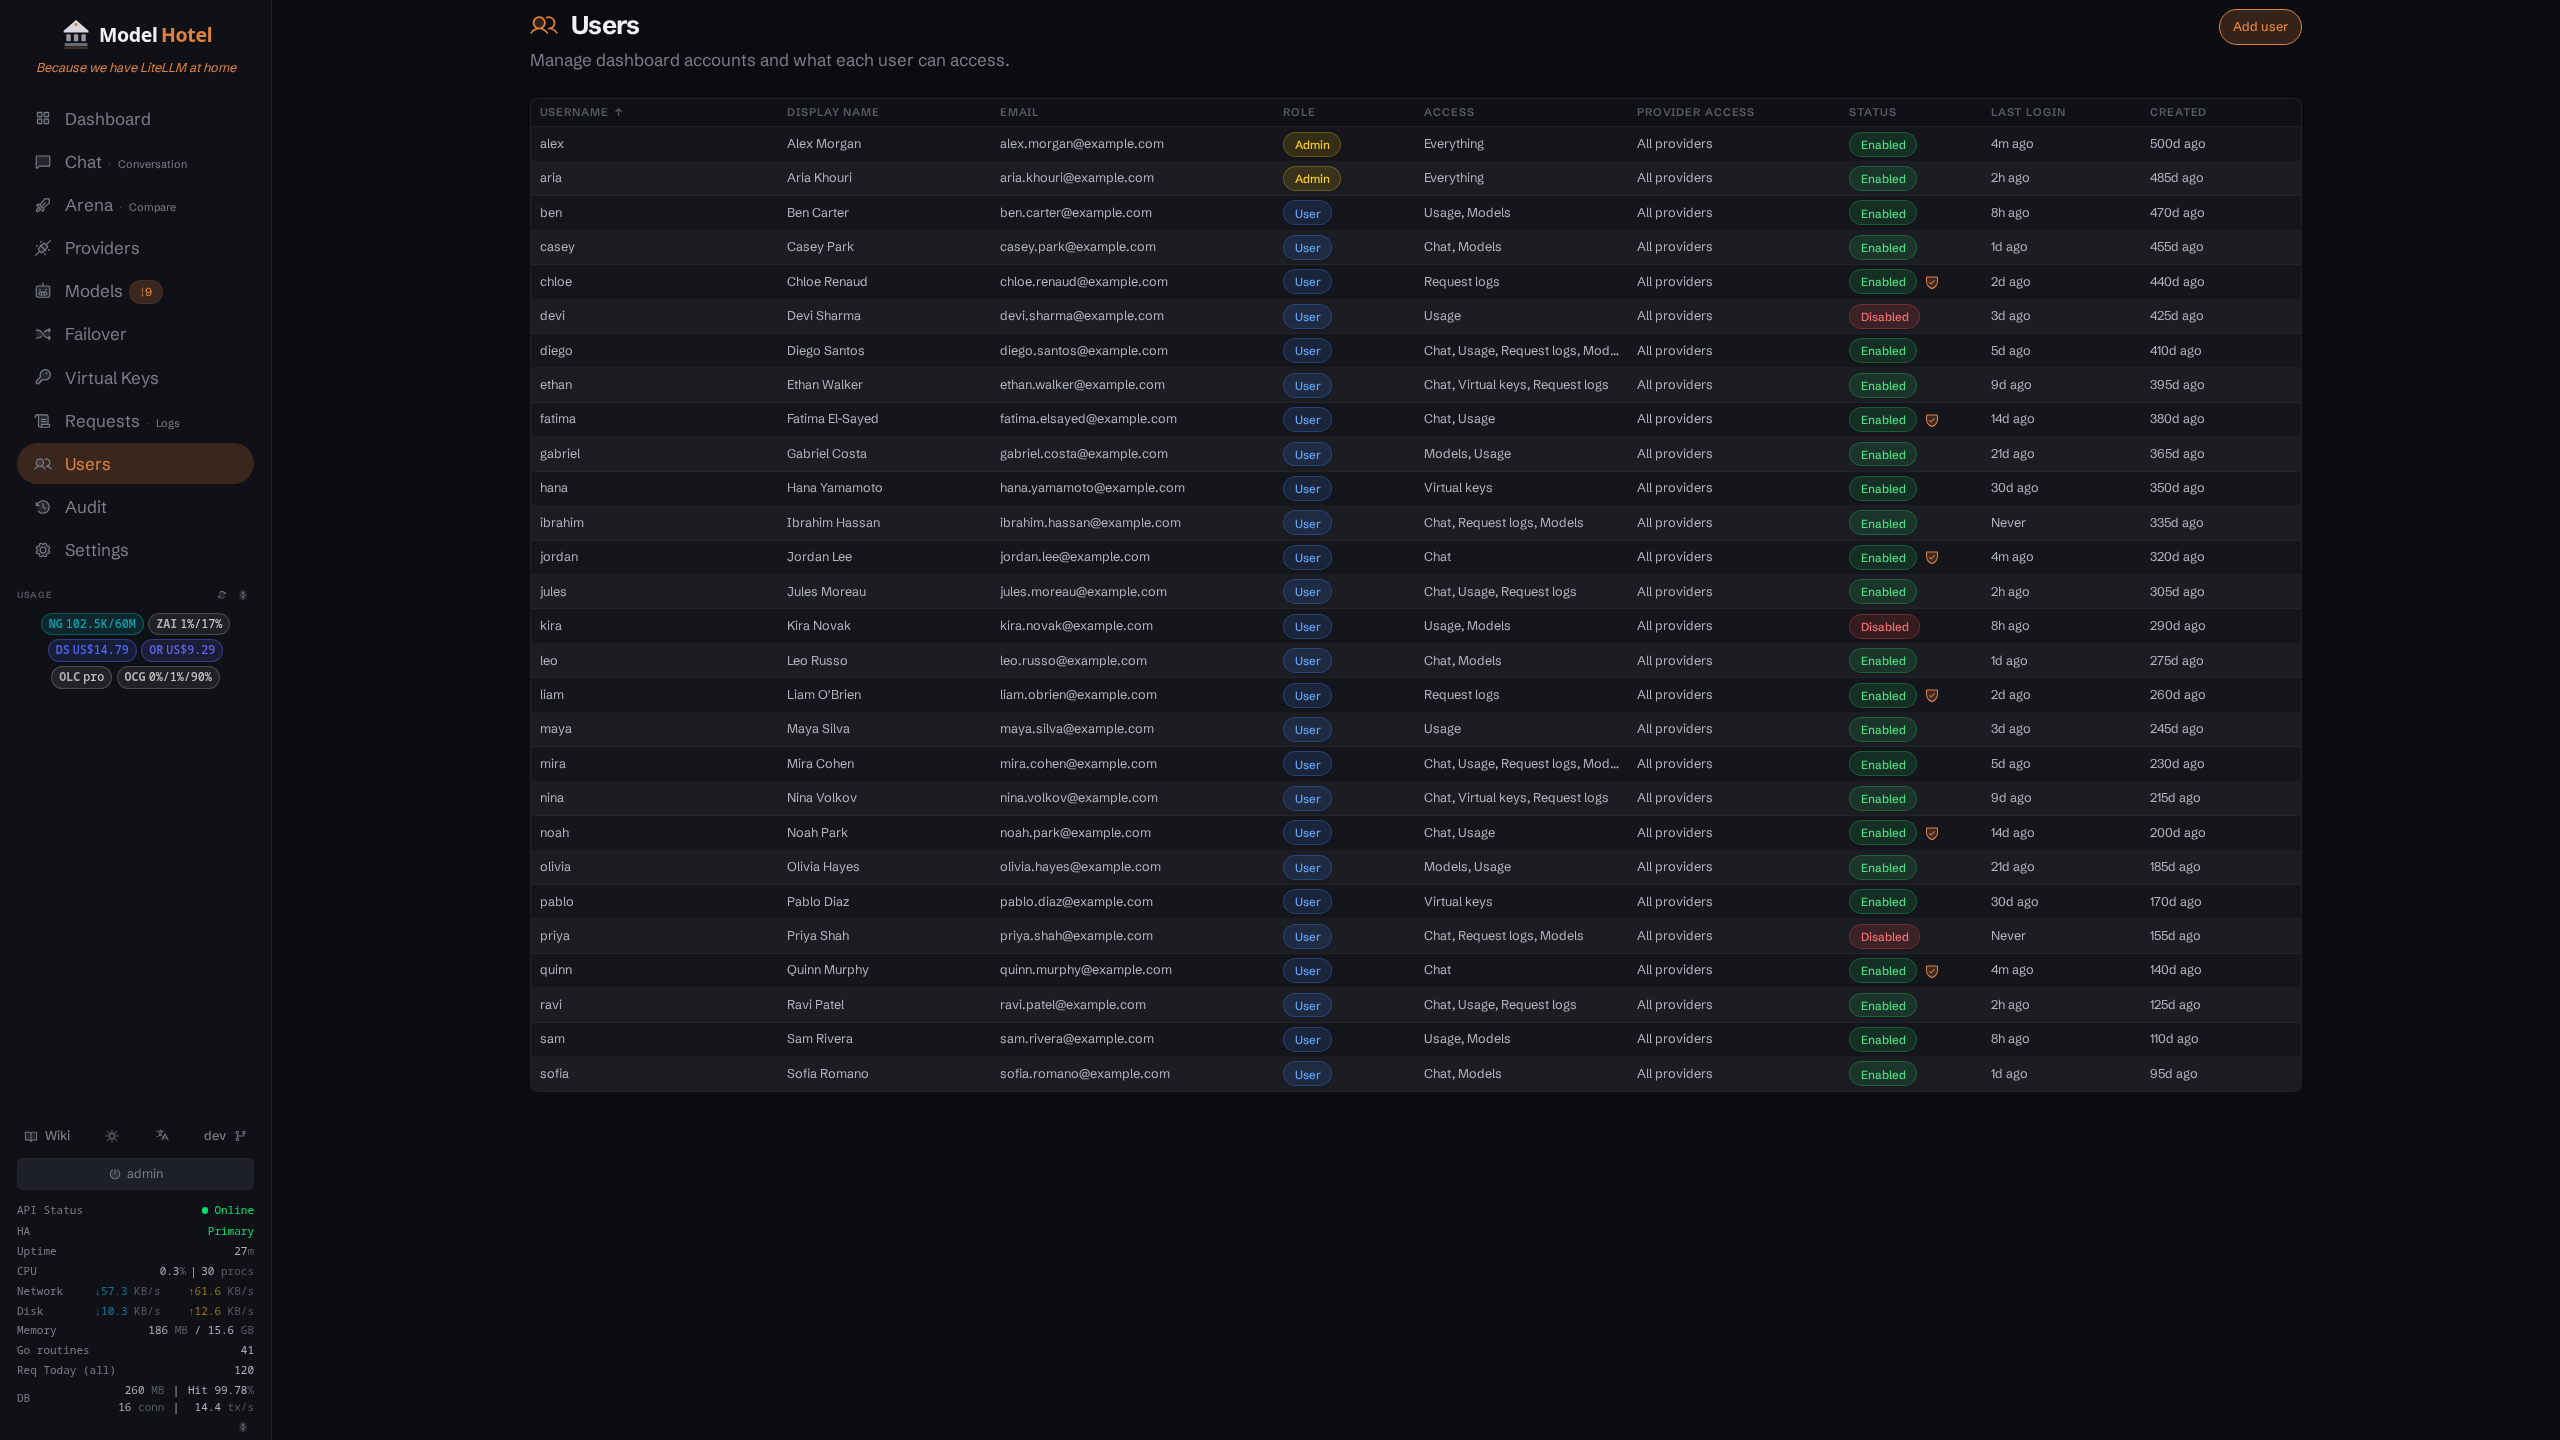
Manage accounts from the Users page (admin only): create a user, assign grants, set an initial password, reset a password or second factor, enable or disable, and read last-login and TOTP status at a glance. The username/password form appears on the login screen only once at least one user exists, so a fresh install keeps the single admin-token flow, and local token login is never removed so you cannot lock yourself out. See the Multi-User wiki page for roles, grants, and the per-user rate-limit model.
· High Availability & Companion App
Optionally run several instances behind one client endpoint, with no client-side change. A small Front Desk control plane manages the fleet and replicates config to every member, while Traefik load-balances them with health checks and automatic failover.

Bellhop, the Android companion app for Front Desk, puts fleet health, traffic and provider quota badges on your phone and home screen, with drain, activate and config-sync controls on operator-paired devices. It talks only to Front Desk and holds no provider credentials.
[!NOTE] Setup and screenshots in the High Availability and Bellhop wiki pages; app source under
android/.
APK download:(signed; Obtainium-compatible).
· API Endpoints
One base URL, one virtual key, every endpoint. The core is the OpenAI-compatible /v1/chat/completions and /v1/models, and the same routing (hotel/<model> for failover, <provider>/<model> for a direct hit) carries embeddings, rerank, image generation and edits, text-to-speech, speech-to-text and music generation as transparent pass-through. Two more client dialects are translated on the way in and out: the Anthropic Messages API, so Claude Code and the Anthropic SDKs fail over across every provider in a group and are forwarded natively when the candidate is Anthropic itself, and the OpenAI Responses API, so Codex CLI and other Responses-only clients do the same and are forwarded verbatim when the candidate is OpenAI. Models that OpenAI serves only over Responses are re-routed there on the fly while the client keeps speaking Chat Completions. Request and response bodies are never logged. Parameters, streaming formats and curl examples for every endpoint are in the API Reference.
· Metrics & Log Shipping
A Prometheus endpoint is exposed at /metrics (request rates by provider/model/status,
latency and TTFT histograms, token counters, a dollar spend counter per provider and model, failover attempts per provider, upstream 429s by
class, circuit-breaker opens by cause and state, failover exhaustion by reason, plus Go runtime
metrics; see the Failover and Hotel Routing wiki for the failover series). It is authenticated - set a dedicated METRICS_TOKEN so your
scrape config need not carry the admin token (the admin token also works). No prompt content is
ever exposed. deploy/observability/ ships a Prometheus + Grafana compose stack with a provisioned
fleet dashboard (traffic, latency, tokens, spend, breakers); see the wiki's
Observability page.
# prometheus.yml
scrape_configs:
  - job_name: model-hotel
    authorization:
      credentials: "${METRICS_TOKEN}"
    static_configs:
      - targets: ["model-hotel:8080"]
        labels:
          member: mh1
For logs, set LOG_FORMAT=json to emit one structured JSON object per line on stdout for
Fluent Bit / Vector / Promtail / Datadog and friends - no extra endpoint, and (like everything
here) never any prompt content. To push those same structured logs to an OpenTelemetry
collector, set OTEL_EXPORTER_OTLP_ENDPOINT (standard OTEL_EXPORTER_OTLP_* vars apply;
http/protobuf by default, OTEL_EXPORTER_OTLP_PROTOCOL=grpc to switch) - logs only, no tracing.
Need verbose debug output without the flood? DEBUG_LOG=true
turns on Debug for everything; DEBUG_LOG_SCOPES=failover,resolve turns it on for just those
areas. The Settings → Observability & Log Export section shows which of the metrics, JSON-log and OTLP exporters are active
and how to enable the rest. See the Configuration wiki.
For push notifications rather than scraping, Settings → Alerts can POST short summaries of operational events (a provider going down, a circuit breaker tripping, a failover group failing to sync) to a stateless Apprise container, which fans them out to Telegram, email, Discord, Slack, Matrix, a raw webhook, and around 80 other destinations; only the event summary is sent, never request content. See the Alerting wiki.
 · Backup & Restore
Backups are created via the Settings page or the admin API (POST /api/backups) using an unfiltered pg_dump --format=custom with zstd compression (level 12 on request, level 19 for scheduled backups). The resulting .dump files therefore contain every database table, not just the configuration ones: providers (encrypted keys), models, virtual key hashes, failover groups, and settings, but also request logs, app logs, the audit log, discovery history, quota snapshots, dashboard user accounts, TOTP secrets and recovery-code hashes, and WebAuthn credentials and sessions. Treat a .dump as sensitive and store it accordingly.
Restoring a backup
The dumps are zstd-compressed, so restoring outside the app needs pg_restore 16 or later built with zstd (the postgres:16-alpine image qualifies).
# Direct
pg_restore --clean --if-exists -d YOUR_DB backup_file.dump

# Via Docker
docker exec -i postgres-container pg_restore --clean --if-exists -U user -d dbname < backup_file.dump
Critical requirements for a working restore
| Requirement | Details |
|---|---|
| MASTER_KEY must match | Provider API keys are AES-256-GCM encrypted using a key derived from MASTER_KEY via Argon2id. Restoring with a different MASTER_KEY will leave all provider keys unrecoverable. The app will start, but key decryption will fail. |
| Admin token is not in the backup | The admin token hash lives in DATA_DIR/admin-token on the filesystem, not in the database. If that file is lost, a new token is auto-generated on next boot. Check startup logs for the new token. |
| Virtual keys are irrecoverable | Virtual keys are stored as SHA-256 hashes only. Plaintext virtual keys are never persisted. If you lose the plaintext keys, they cannot be recovered from the backup (by design). |
What is and isn't in the backup
Included (in the database, captured by pg_dump): providers (encrypted keys, nonces, salts), models, virtual keys (hashes only), failover groups, settings, request and app logs, the audit log, discovery history, quota snapshots, user accounts, TOTP secrets and recovery-code hashes, WebAuthn credentials and sessions.
Not included (filesystem only): DATA_DIR/admin-token (admin token hash), DATA_DIR/backups/ (the backup files themselves), MASTER_KEY (environment variable).
 · License
MIT. See CONTRIBUTING.md for the contributor license agreement.
Full Documentation
- Configuration: Environment variables, runtime settings, Docker Compose
- API Reference: Proxy and admin endpoints
- Security: AES-256-GCM encryption, Argon2id key derivation, hashing, URL validation
- Privacy: What is and isn't captured, data retention, local deployment
- Failover and Hotel Routing: Failover groups, circuit breaker, backoff
- Model Discovery: Automatic sync, provider-specific metadata, enrichment
- Virtual Keys: Creating, using, and deleting client keys
- Multi-User: Dashboard accounts, roles, grants, per-user rate limits
- Request Logging: Log fields, overhead breakdown, retention
- Alerting: Outbound event notifications via Apprise
- CrowdSec: Parsers and scenarios for banning abusive clients at the edge
- Backup & Restore: Creating backups, restoring, critical requirements
- High Availability: Front Desk control plane + Traefik, drop-in HA across multiple instances
- Bellhop: Android companion app, pairing, roles, monitoring and operator controls
- Development: Local setup, build commands, contributing
