
hrbrmstr/hrbrthemes
hrbrmstr/hrbrthemes has 1,357 GitHub stars and 97 forks. GitHot measured 0 stars in 24 hours. Last checked 2026-11-06 09:13 UTC. Last push 2026-10-17.
:lock_with_ink_pen: Opinionated, typographic-centric ggplot2 themes and theme components
Measured star growth
- in 24h
- 0
- in 7 days
- Update delayed
- in 15 days
- Update delayed
- in 1 month
- Update delayed
Net star changes over overlapping periods, not daily totals. Missing measurements are left blank. Stars measure attention, not software quality.
README.md
Original




hrbrthemes
Additional Themes and Theme Components for ‘ggplot2’
This is a very focused package that provides typography-centric themes and theme components for ggplot2.
The core theme: theme_ipsum (“ipsum” is Latin for “precise”) uses
Arial Narrow which should be installed on practically any modern system,
so it’s “free”-ish. This font is condensed, has solid default kerning
pairs and geometric numbers. That’s what I consider the “font trifecta”
must-have for charts. An additional quality for fonts for charts is that
they have a diversity of weights. Arial Narrow (the one on most systems,
anyway) does not have said diversity but this quality is not (IMO) a
“must have”.
The following functions are implemented/objects are exported:
Themes:
theme_ipsum: Arial Narrowtheme_ipsum_archivo: Archivo SemiCondensedtheme_ipsum_es: Econ Sans Condensedtheme_ipsum_gs: Goldman Sans Condensedtheme_ipsum_ps: IBM Plex Sans fonttheme_ipsum_pub: Public Sanstheme_ipsum_rc: Roboto Condensedtheme_ipsum_tw: Titilium Webtheme_modern_rc: Roboto Condensed dark themetheme_ft_rc: Dark theme based on FT’s dark theme (Roboto Condensed)
Scales (that align with various themes):
scale_color_ipsum: Discrete color & fill scales based on the ipsum palettescale_colour_ipsum: Discrete color & fill scales based on the ipsum palettescale_fill_ipsum: Discrete color & fill scales based on the ipsum palettescale_color_ft: Discrete color & fill scales based on the FT palettescale_colour_ft: Discrete color & fill scales based on the FT palettescale_fill_ft: Discrete color & fill scales based on the FT palettescale_x_comma: X & Y scales with opinionated presets for percent & comma label formatsscale_x_percent: X & Y scales with opinionated presets for percent & comma label formatsscale_y_comma: X & Y scales with opinionated presets for percent & comma label formatsscale_y_percent: X & Y scales with opinionated presets for percent & comma label formats
Palettes/Named Colors:
ipsum_pal: A muted, qualitative color paletteft_cols: FT color paletteft_pal: A bright qualitative color paletteft_text_col: FT color palettebit12: A vector of 12 vibrant colors for categorical databit12_extended: List of 12 color palettes with 9 shades each for continuous interpolation
Fonts:
font_geist: Geist font name R variable aliasesfont_geist_bold: Geist font name R variable aliasesfont_geist_italic: Geist font name R variable aliasesfont_geist_medium: Geist font name R variable aliasesfont_geist_medium_italic: Geist font name R variable aliasesfont_geist_semibold: Geist font name R variable aliasesfont_ar: Archivo SemiCondensed font name R variable aliasesfont_ar_bold: Archivo SemiCondensed font name R variable aliasesfont_ar_italic: Archivo SemiCondensed font name R variable aliasesfont_ar_sb: Archivo SemiCondensed font name R variable aliasesfont_ar_sb_italic: Archivo SemiCondensed font name R variable aliasesfont_an: Arial Narrow font name R variable aliasesfont_es: Econ Sans font name R variable aliasesfont_es_bold: Econ Sans font name R variable aliasesfont_es_light: Econ Sans font name R variable aliasesfont_rc: Roboto Condensed font name R variable aliasesfont_rc_light: Roboto Condensed font name R variable aliasesfont_pub: Public Sans font name R variable aliasesfont_pub_bold: Public Sans font name R variable aliasesfont_pub_light: Public Sans font name R variable aliasesfont_pub_thin: Public Sans font name R variable aliasesfont_ps: PlexSans font name R variable aliasesfont_ps_light: PlexSans font name R variable aliases
Flexoki Color Scales:
scale_fill_flexoki_continuous: Continuous Fill Scale Using Flexoki Colorsscale_fill_flexoki_dark: Discrete Fill Scale Using Flexoki Dark Colorsscale_fill_flexoki_dark_distiller: Distiller Fill Scale Using Flexoki Dark Colorsscale_fill_flexoki_dark_spectrum: Distiller Fill Scale Across All Flexoki Dark Colorsscale_fill_flexoki_light: Discrete Fill Scale Using Flexoki Light Colorsscale_fill_flexoki_light_distiller: Distiller Fill Scale Using Flexoki Light Colorsscale_fill_flexoki_light_spectrum: Distiller Fill Scale Across All Flexoki Light Colors
Bit12 Color Scales:
scale_color_bit12: Discrete Color Scale Using Bit12 Colorsscale_fill_bit12: Discrete Fill Scale Using Bit12 Colorsscale_color_bit12_continuous: Continuous Color Scale Using Bit12 Colorsscale_fill_bit12_continuous: Continuous Fill Scale Using Bit12 Colorsscale_color_bit12_distiller: Distiller Color Scale Using Bit12 Colorsscale_fill_bit12_distiller: Distiller Fill Scale Using Bit12 Colorsscale_color_bit12_spectrum: Distiller Color Scale Across All Bit12 Colorsscale_fill_bit12_spectrum: Distiller Fill Scale Across All Bit12 Colors
Tern & omp Color Scales:
theme_tern: ggplot2 theme matching Tern’sdark-cosmoschrome and omp chart stylingscale_color_tern: Discrete color scale using the omp chart series palettescale_fill_tern: Discrete fill scale using the omp chart series palettescale_color_tern_continuous: Continuous color scale through the omp chart palettescale_fill_tern_continuous: Continuous fill scale through the omp chart paletteomp_chart_palette: Reproduce omp’s--c1..--c6series palette from a theme accent
Tern Palettes:
tern_dark: Named colors from Tern’sdark-cosmosterminal themeomp_titanium: Named colors from omp’stitaniumtheme
Flexoki Palettes:
flexoki_light: Vector of 8 colors in the light variantflexoki_dark: Vector of 8 colors in the dark variantflexoki_extended: List of 8 color palettes with 13 shades each for continuous interpolation
Utilities:
humanize_duration: Convert duration to human-readable textflush_ticks: Makes axis text labels flush on the endsft_geom_defaults: Change geom defaults from black to custom lights for the FT themegg_check: Spell check ggplot2 plot labelsimport_archivo: Import Archivo SemiCondensed font for use in chartsimport_geist: Import Geist font for use in chartsimport_econ_sans: Import Econ Sans Condensed font for use in chartsimport_plex_sans: Import IBM Plex Sans font for use in chartsimport_roboto_condensed: Import Roboto Condensed font for use in chartsmodern_geom_defaults: Change geom defaults from black to white for the modern themeupdate_geom_font_defaults: Update matching font defaults for text geoms
Installation
remotes::install_git("https://rud.is/git/hrbrthemes", git = "external")
or
install.packages("hrbrthemes") # NOTE: CRAN version is 0.9.3
# or
remotes::install_git("https://codeberg.org/hrbrmstr/hrbrthemes.git")
NOTE: To use the ‘remotes’ install options you will need to have the {remotes} package installed.
Usage
library(hrbrthemes)
library(gcookbook)
library(tidyverse)

# current version
packageVersion("hrbrthemes")
## [1] '0.9.5'
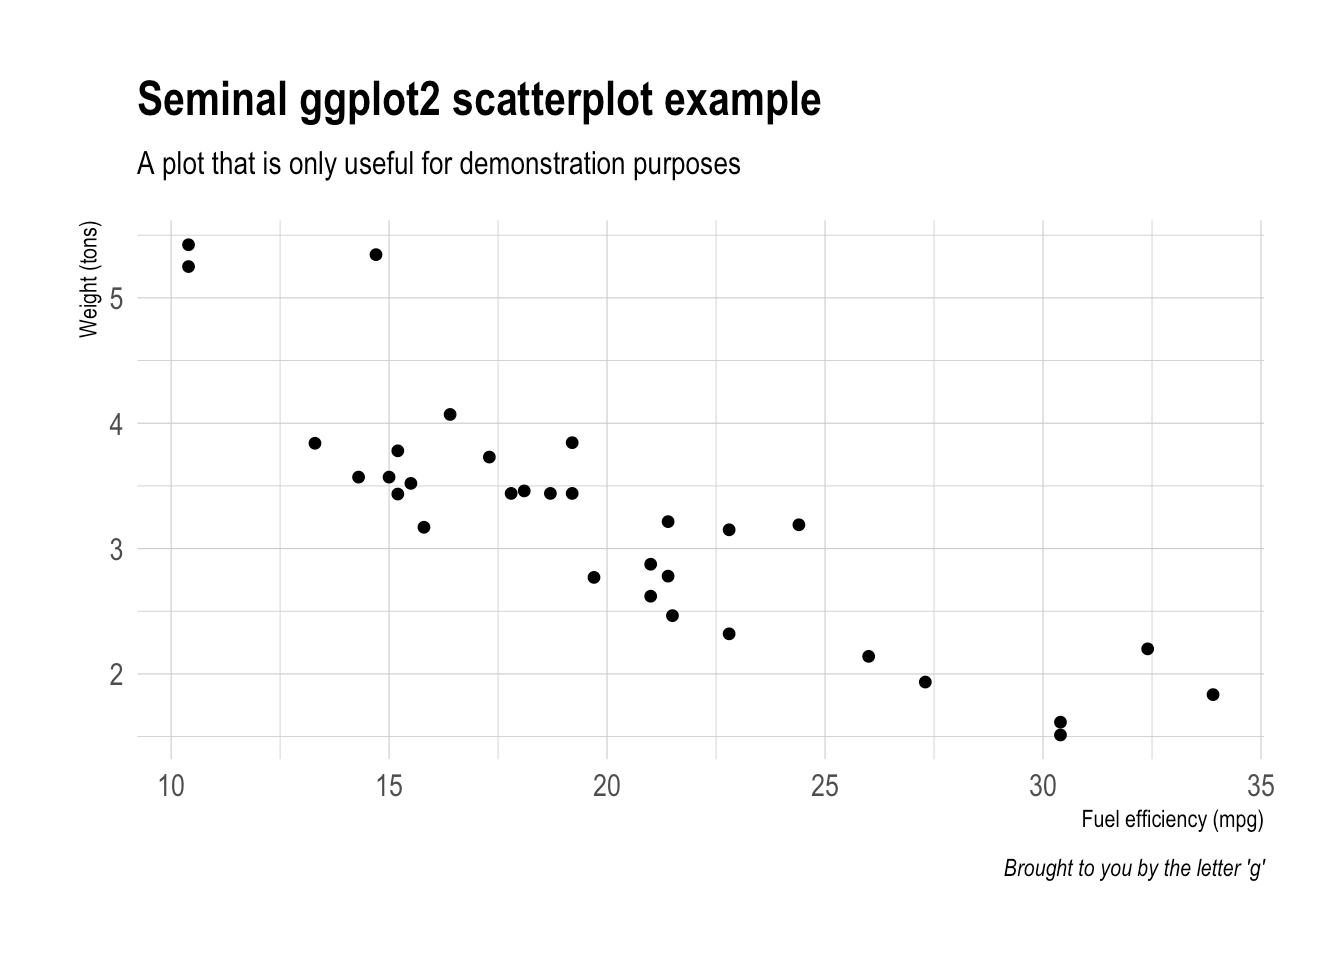
Base theme (Arial Narrow)
ggplot(mtcars, aes(mpg, wt)) +
  geom_point() +
  labs(x="Fuel efficiency (mpg)", y="Weight (tons)",
       title="Seminal ggplot2 scatterplot example",
       subtitle="A plot that is only useful for demonstration purposes",
       caption="Brought to you by the letter 'g'") +
  theme_ipsum()
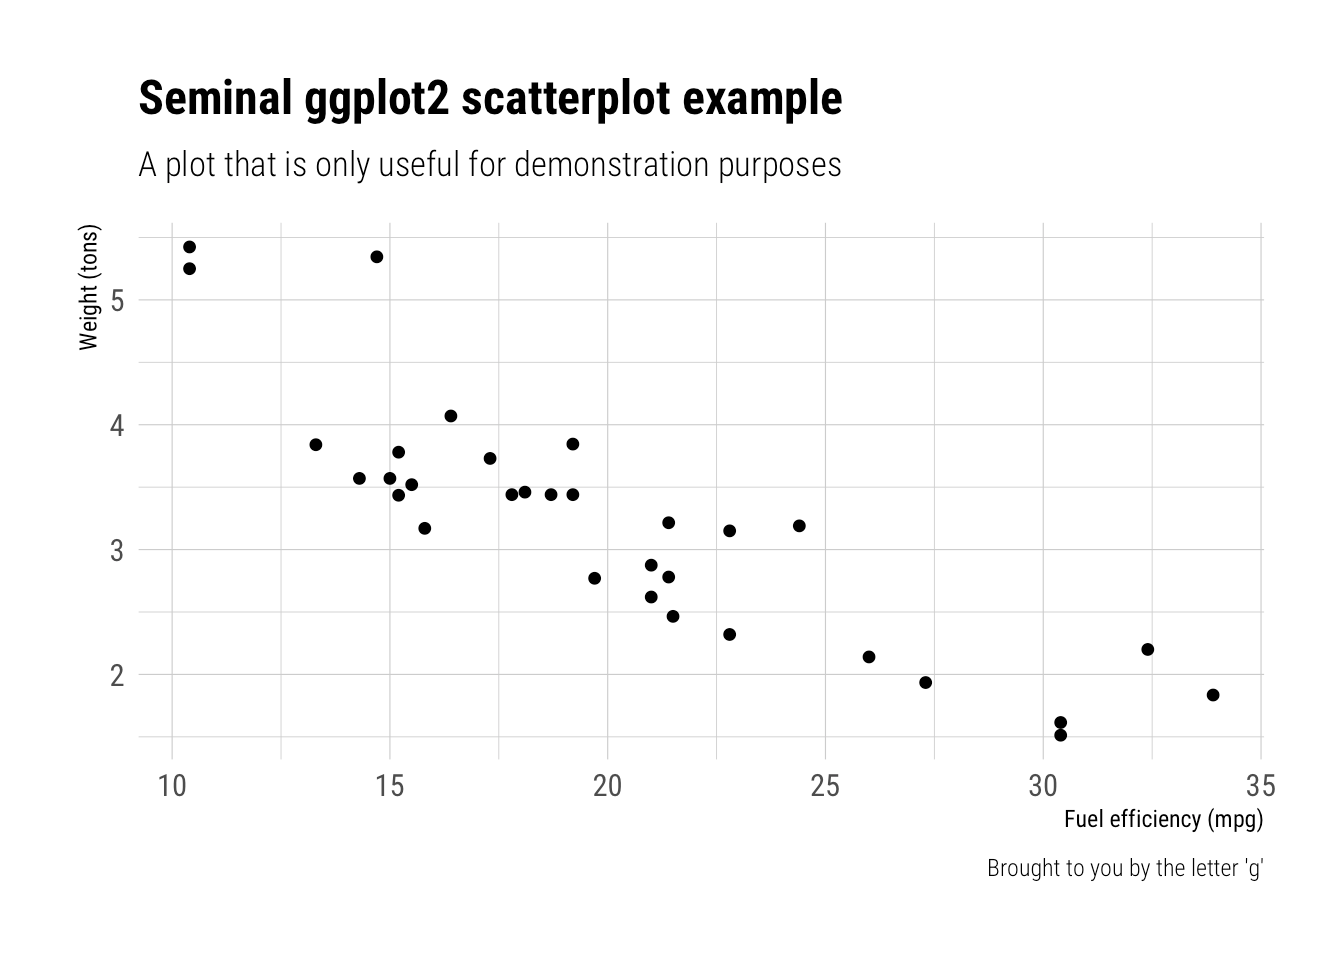
Roboto Condensed
ggplot(mtcars, aes(mpg, wt)) +
  geom_point() +
  labs(x="Fuel efficiency (mpg)", y="Weight (tons)",
       title="Seminal ggplot2 scatterplot example",
       subtitle="A plot that is only useful for demonstration purposes",
       caption="Brought to you by the letter 'g'") +
  theme_ipsum_rc()
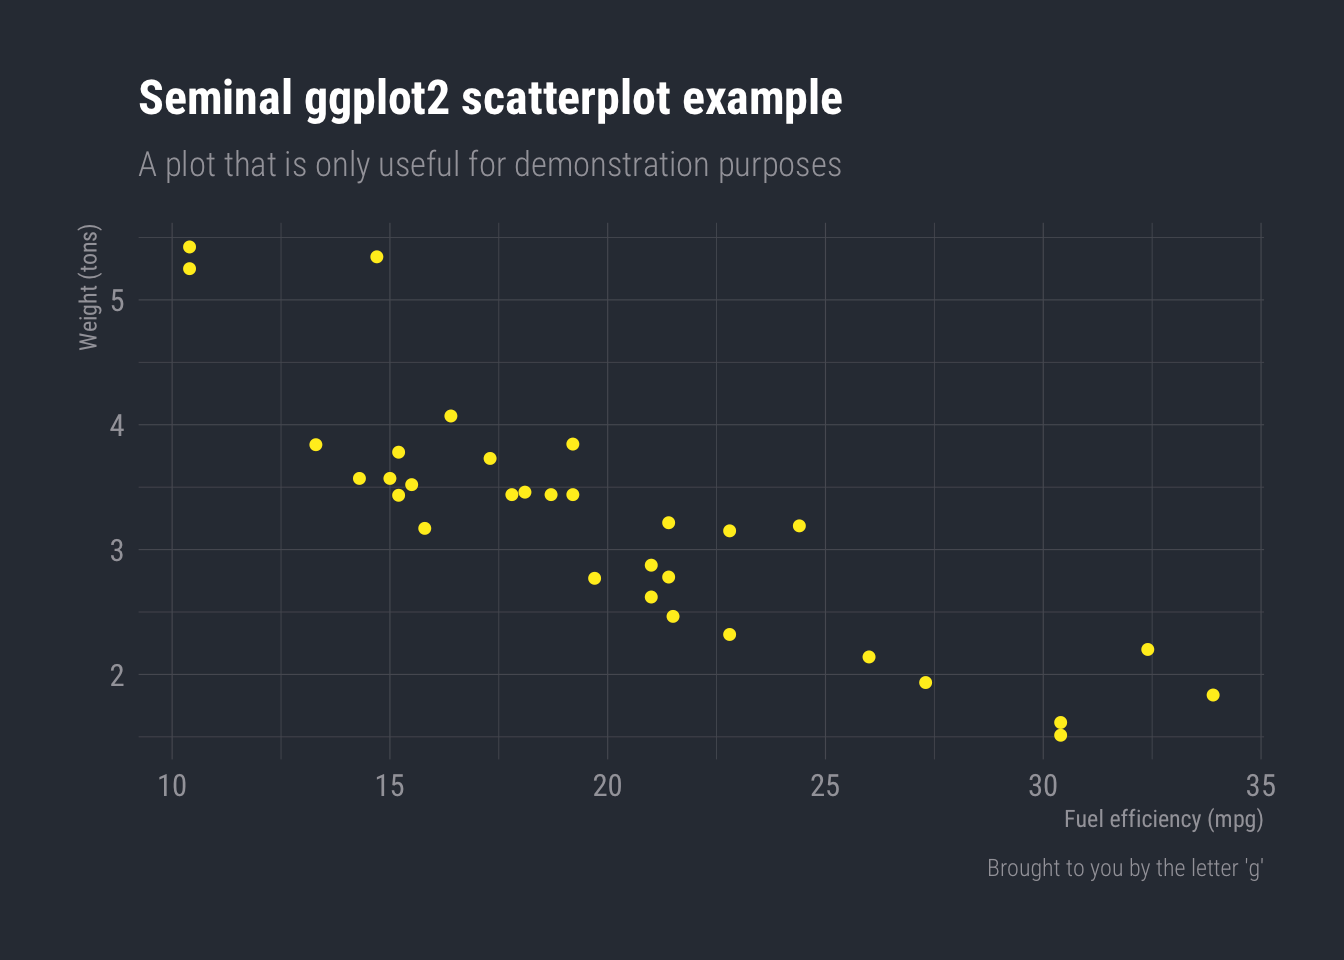
FT Theme
ggplot(mtcars, aes(mpg, wt)) +
  geom_point(color = ft_cols$yellow) +
  labs(x="Fuel efficiency (mpg)", y="Weight (tons)",
       title="Seminal ggplot2 scatterplot example",
       subtitle="A plot that is only useful for demonstration purposes",
       caption="Brought to you by the letter 'g'") +
  theme_ft_rc()
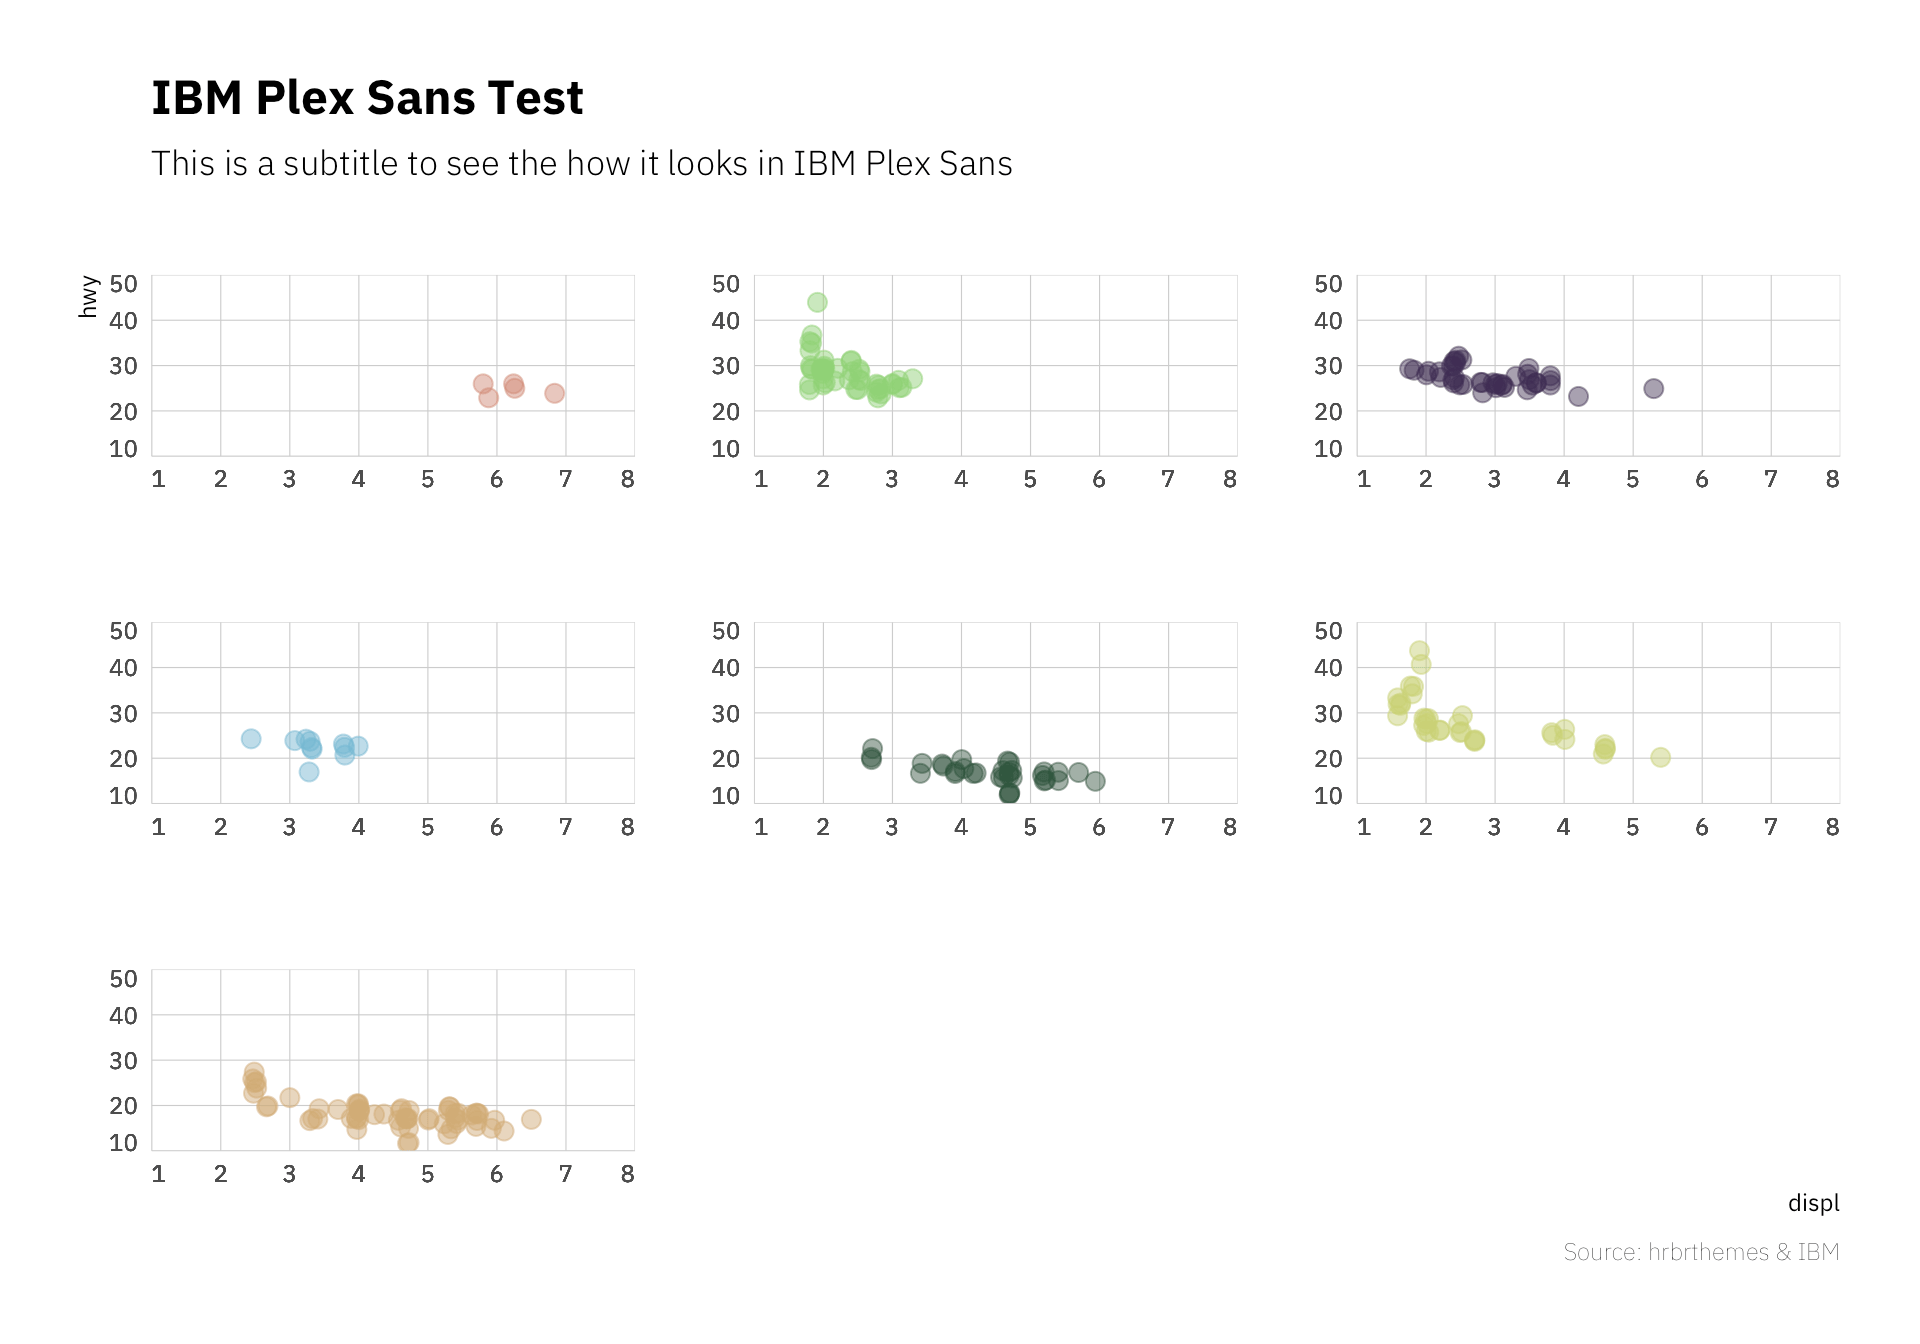
IBM Plex Sans
ggplot(mpg, aes(displ, hwy)) +
  geom_jitter(aes(color=class, fill=class), size=3, shape=21, alpha=1/2) +
  scale_x_continuous(expand=c(0,0), limits=c(1, 8), breaks=1:8) +
  scale_y_continuous(expand=c(0,0), limits=c(10, 50)) +
  scale_color_ipsum() +
  scale_fill_ipsum() +
  facet_wrap(~class, scales="free") +
  labs(
    title="IBM Plex Sans Test",
    subtitle="This is a subtitle to see the how it looks in IBM Plex Sans",
    caption="Source: hrbrthemes & IBM"
  ) +
  theme_ipsum_ps(grid="XY", axis="xy") +
  theme(legend.position="none") -> gg

flush_ticks(gg)
## theme(axis.text.x=element_text(hjust=c(0, rep(0.5, 6), 1))) +
## theme(axis.text.y=element_text(vjust=c(0, rep(0.5, 3), 1)))
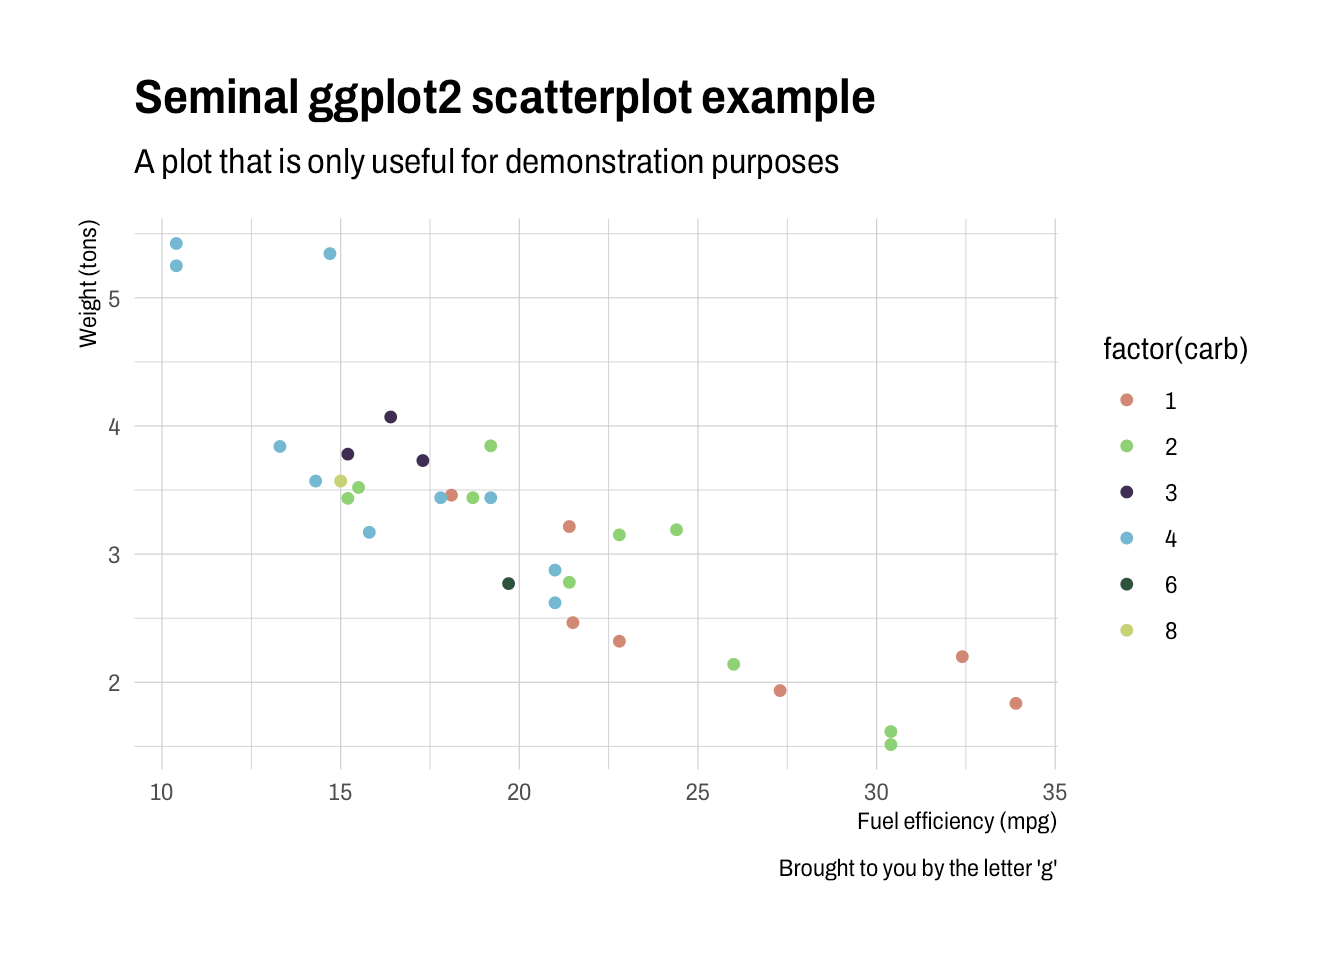
NEW! Archivo
ggplot(mtcars, aes(mpg, wt)) +
  geom_point(aes(color=factor(carb))) +
  labs(x="Fuel efficiency (mpg)", y="Weight (tons)",
       title="Seminal ggplot2 scatterplot example",
       subtitle="A plot that is only useful for demonstration purposes",
       caption="Brought to you by the letter 'g'") +
  scale_color_ipsum() +
  theme_ipsum_archivo()
Scales (Color/Fill)
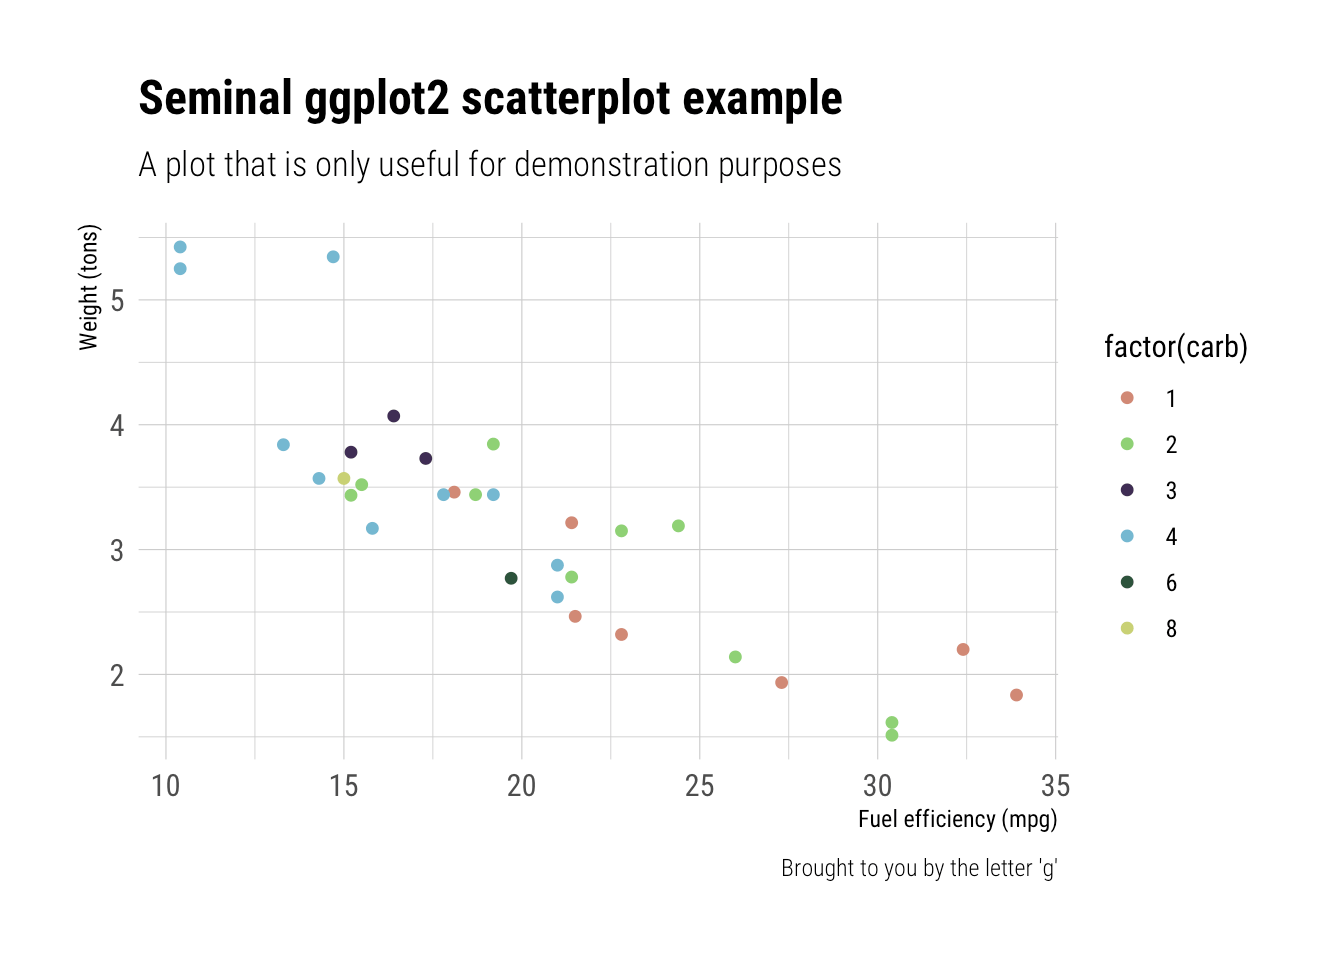
ggplot(mtcars, aes(mpg, wt)) +
  geom_point(aes(color=factor(carb))) +
  labs(x="Fuel efficiency (mpg)", y="Weight (tons)",
       title="Seminal ggplot2 scatterplot example",
       subtitle="A plot that is only useful for demonstration purposes",
       caption="Brought to you by the letter 'g'") +
  scale_color_ipsum() +
  theme_ipsum_rc()
Scales (Axis)
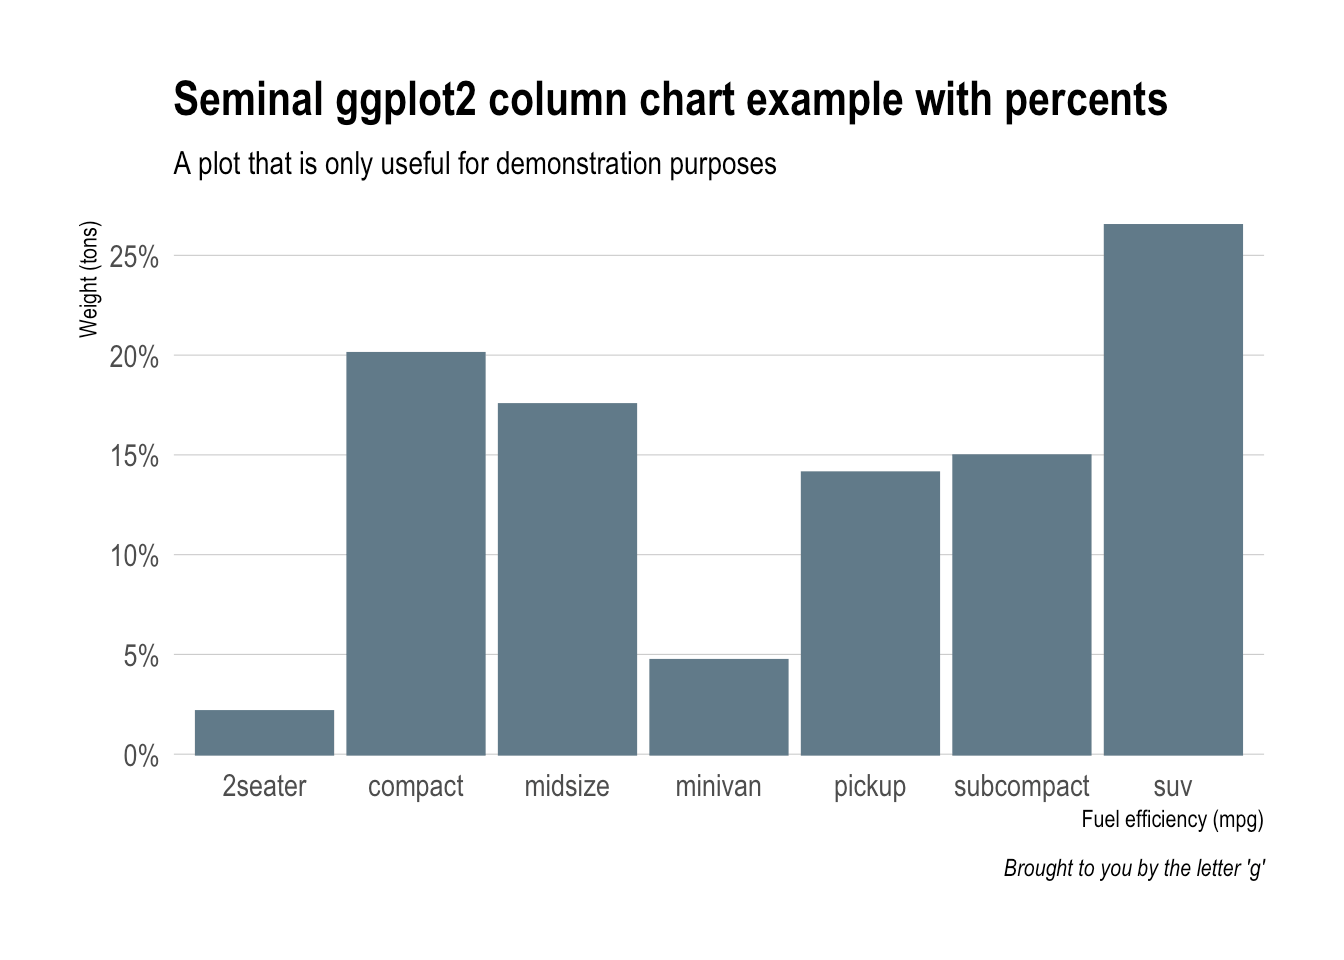
count(mpg, class) %>%
  mutate(pct=n/sum(n)) %>%
  ggplot(aes(class, pct)) +
  geom_col() +
  scale_y_percent() +
  labs(x="Fuel efficiency (mpg)", y="Weight (tons)",
       title="Seminal ggplot2 column chart example with percents",
       subtitle="A plot that is only useful for demonstration purposes",
       caption="Brought to you by the letter 'g'") +
  theme_ipsum(grid="Y")
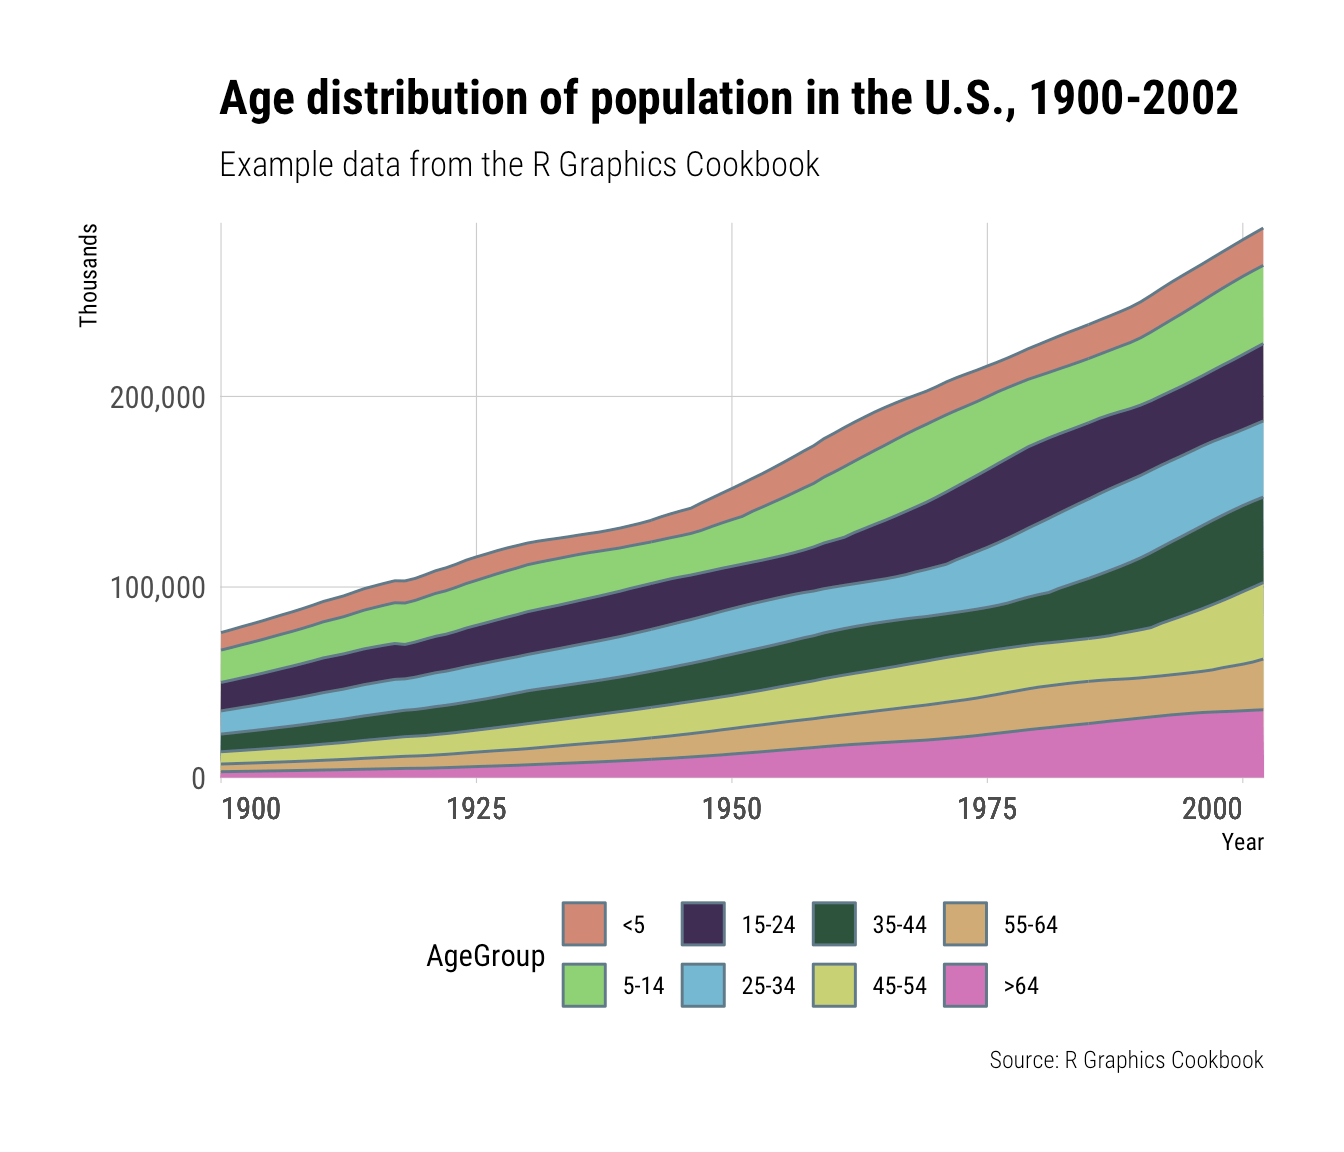
ggplot(uspopage, aes(x=Year, y=Thousands, fill=AgeGroup)) +
  geom_area() +
  scale_fill_ipsum() +
  scale_x_continuous(expand=c(0,0)) +
  scale_y_comma() +
  labs(title="Age distribution of population in the U.S., 1900-2002",
       subtitle="Example data from the R Graphics Cookbook",
       caption="Source: R Graphics Cookbook") +
  theme_ipsum_rc(grid="XY") +
  theme(axis.text.x=element_text(hjust=c(0, 0.5, 0.5, 0.5, 1))) +
  theme(legend.position="bottom")
update_geom_font_defaults(font_rc_light)

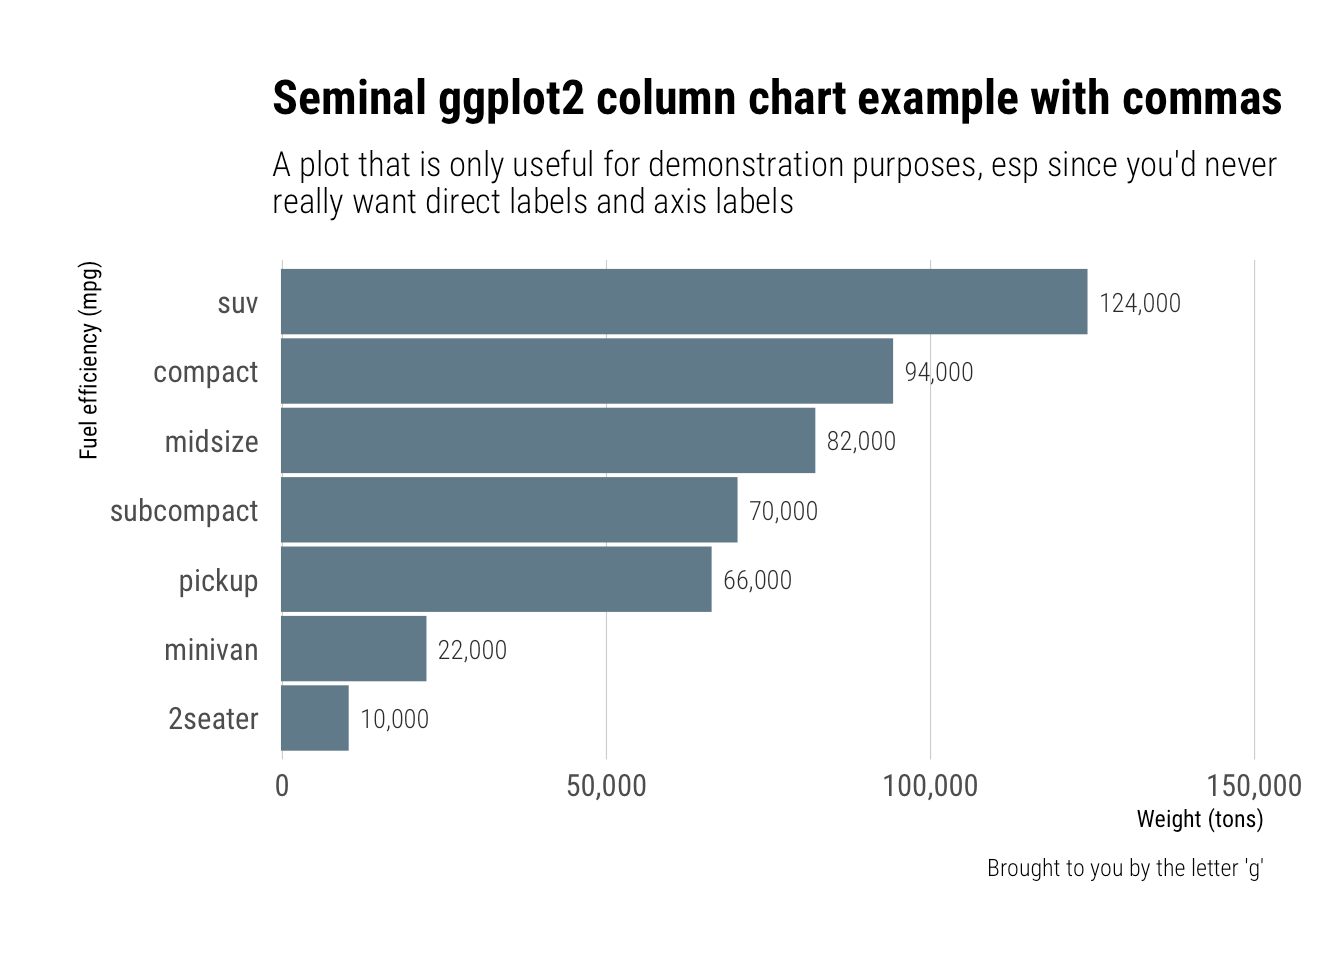
count(mpg, class) %>%
  mutate(n=n*2000) %>%
  arrange(n) %>%
  mutate(class=factor(class, levels=class)) %>%
  ggplot(aes(class, n)) +
  geom_col() +
  geom_text(aes(label=scales::comma(n)), hjust=0, nudge_y=2000) +
  scale_y_comma(limits=c(0,150000)) +
  coord_flip() +
  labs(x="Fuel efficiency (mpg)", y="Weight (tons)",
       title="Seminal ggplot2 column chart example with commas",
       subtitle="A plot that is only useful for demonstration purposes, esp since you'd never\nreally want direct labels and axis labels",
       caption="Brought to you by the letter 'g'") +
  theme_ipsum_rc(grid="X")
Spellcheck ggplot2 labels
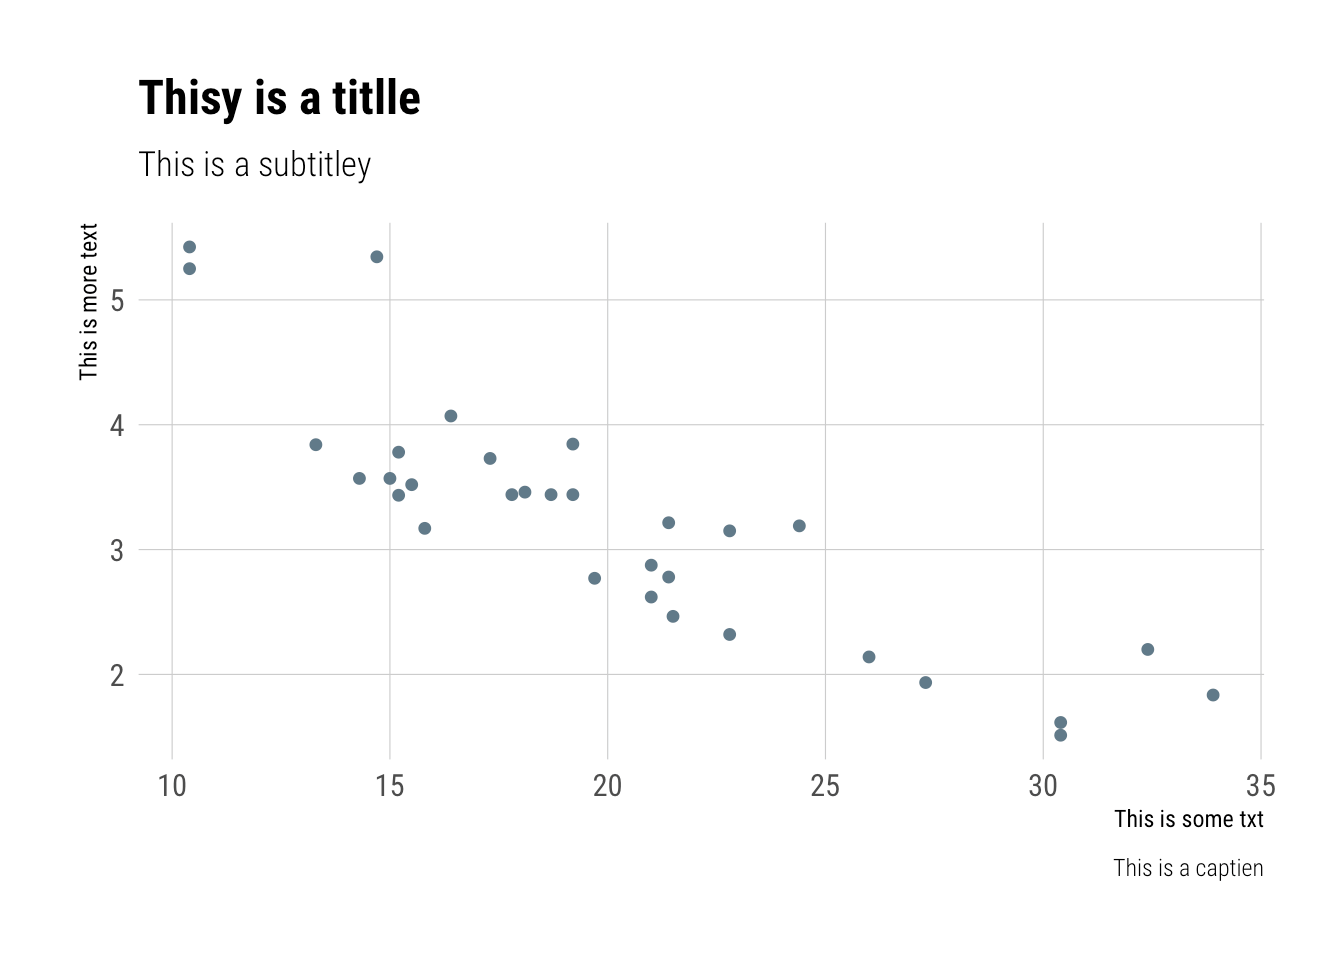
df <- data.frame(x=c(20, 25, 30), y=c(4, 4, 4), txt=c("One", "Two", "Three"))

ggplot(mtcars, aes(mpg, wt)) +
  geom_point() +
  labs(x="This is some txt", y="This is more text",
       title="Thisy is a titlle",
       subtitle="This is a subtitley",
       caption="This is a captien") +
  theme_ipsum_rc(grid="XY") -> gg

gg_check(gg)
## Possible misspelled words in [title]: (Thisy, titlle)
## Possible misspelled words in [subtitle]: (subtitley)
## Possible misspelled words in [caption]: (captien)
Flexoki Color Scales
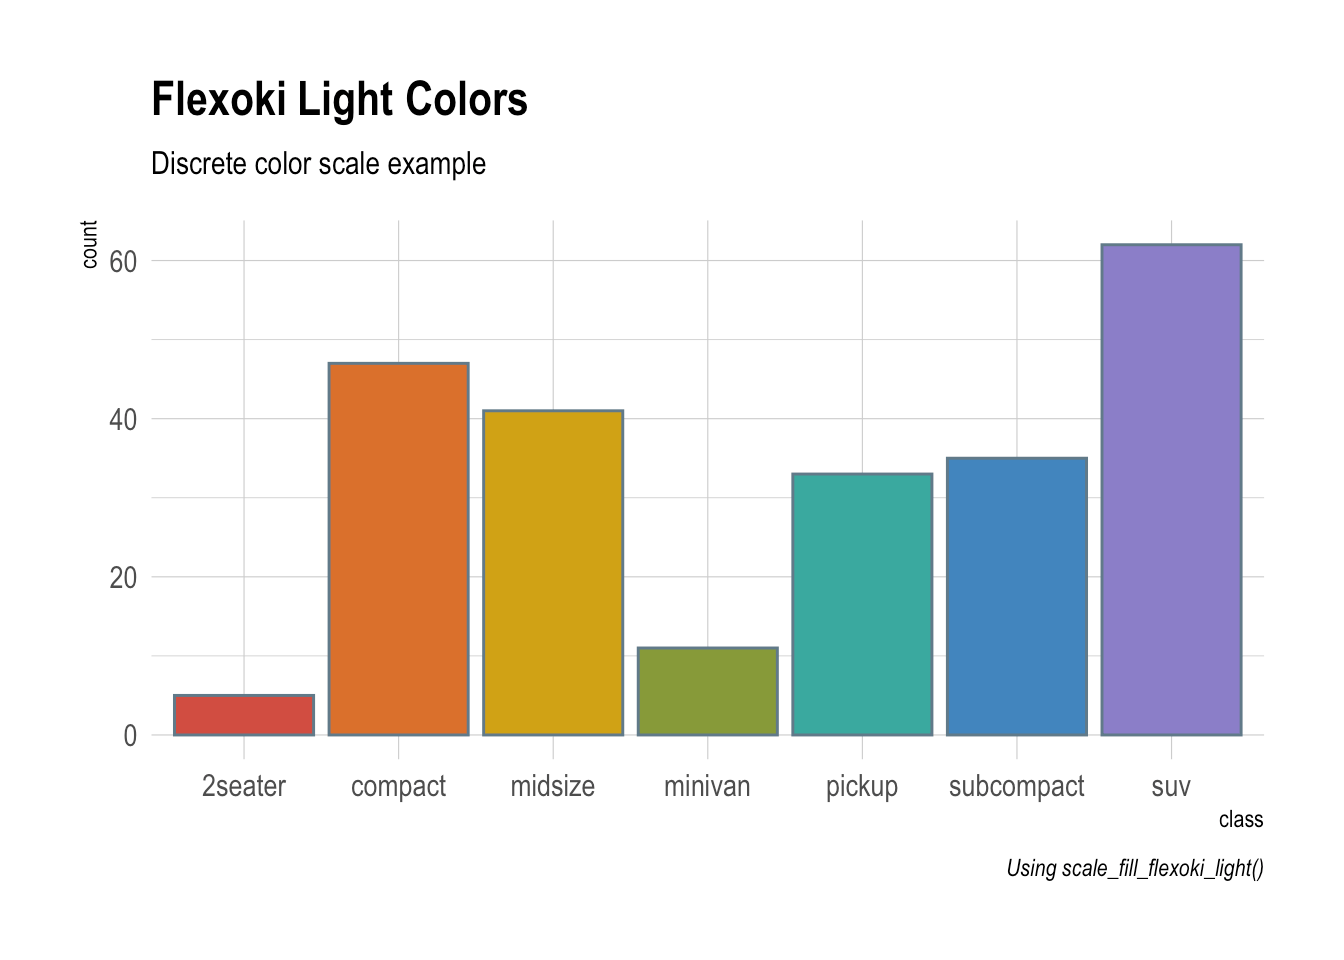
The Flexoki color system provides both discrete and continuous color scales in light and dark variants.
# Discrete colors example with light variant
ggplot(mpg, aes(class, fill=class)) +
  geom_bar() +
  labs(title="Flexoki Light Colors",
       subtitle="Discrete color scale example",
       caption="Using scale_fill_flexoki_light()") +
  theme_ipsum() +
  scale_fill_flexoki_light() +
  theme(legend.position="none")
# Dark variant with points
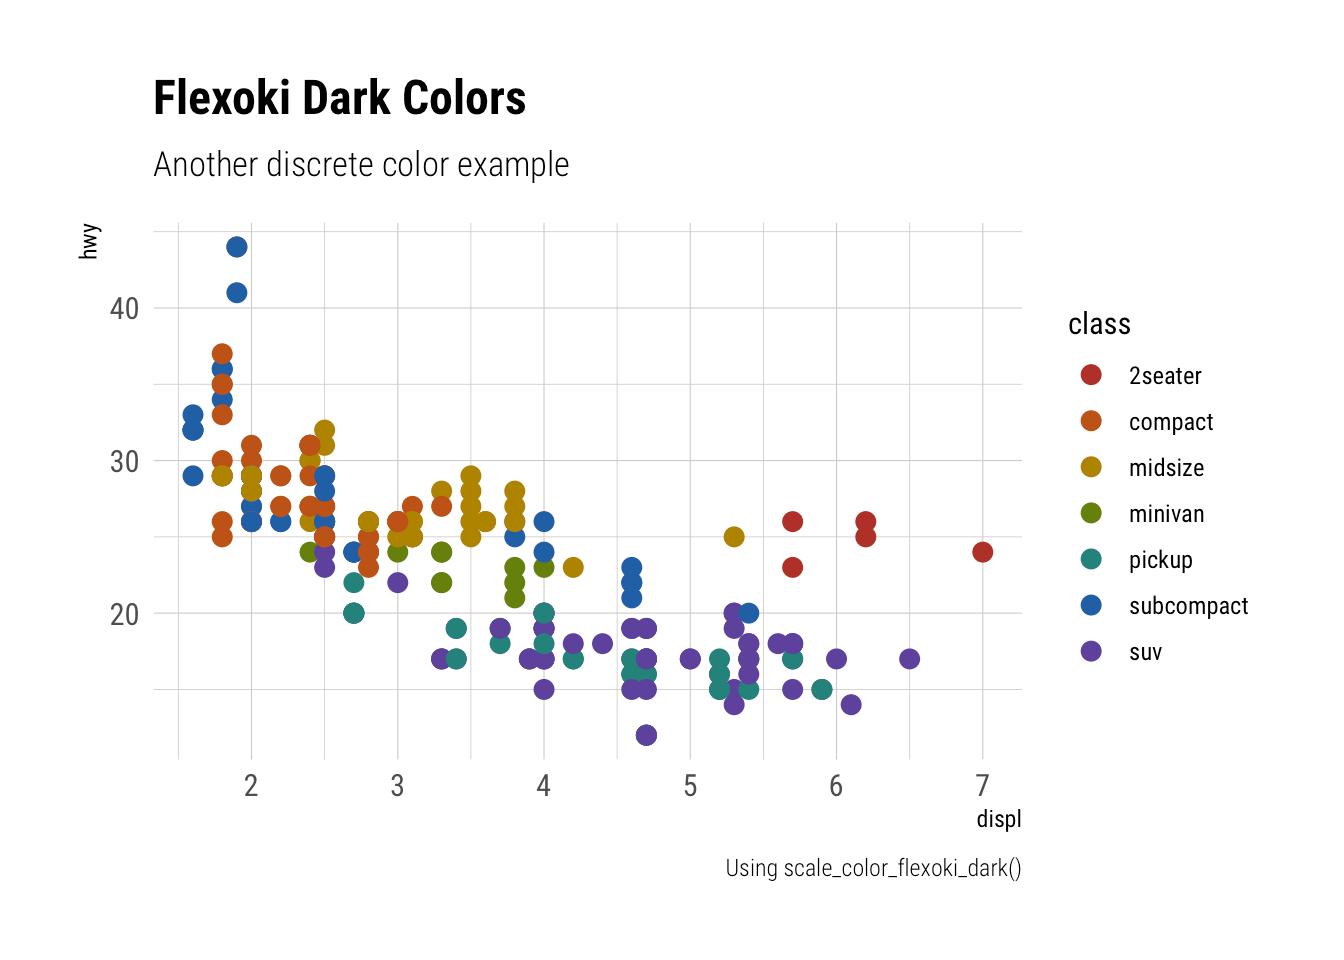
ggplot(mpg, aes(displ, hwy, color=class)) +
  geom_point(size=3) +
  labs(title="Flexoki Dark Colors",
       subtitle="Another discrete color example",
       caption="Using scale_color_flexoki_dark()") +
  theme_ipsum_rc() +
  scale_color_flexoki_dark()
library(patchwork)

data.frame(
  x = rep(1:50, 50),
  y = rep(1:50, each=50),
  z = sqrt((rep(1:50, 50)-25)^2 + (rep(1:50, each=50)-25)^2)
) -> grad_df

names(flexoki_dark) |>
  map(\(.p) {
    ggplot(grad_df, aes(x, y, fill=z)) +
      geom_tile() +
      scale_fill_flexoki_continuous(palette = .p) +
      labs(
        x = NULL, y = NULL
      ) +
      theme_ipsum(grid="") +
      theme(legend.position = "none")
  }) |>
  do.call(what = "wrap_plots") +
  plot_layout(ncol = 4) +
  plot_annotation(
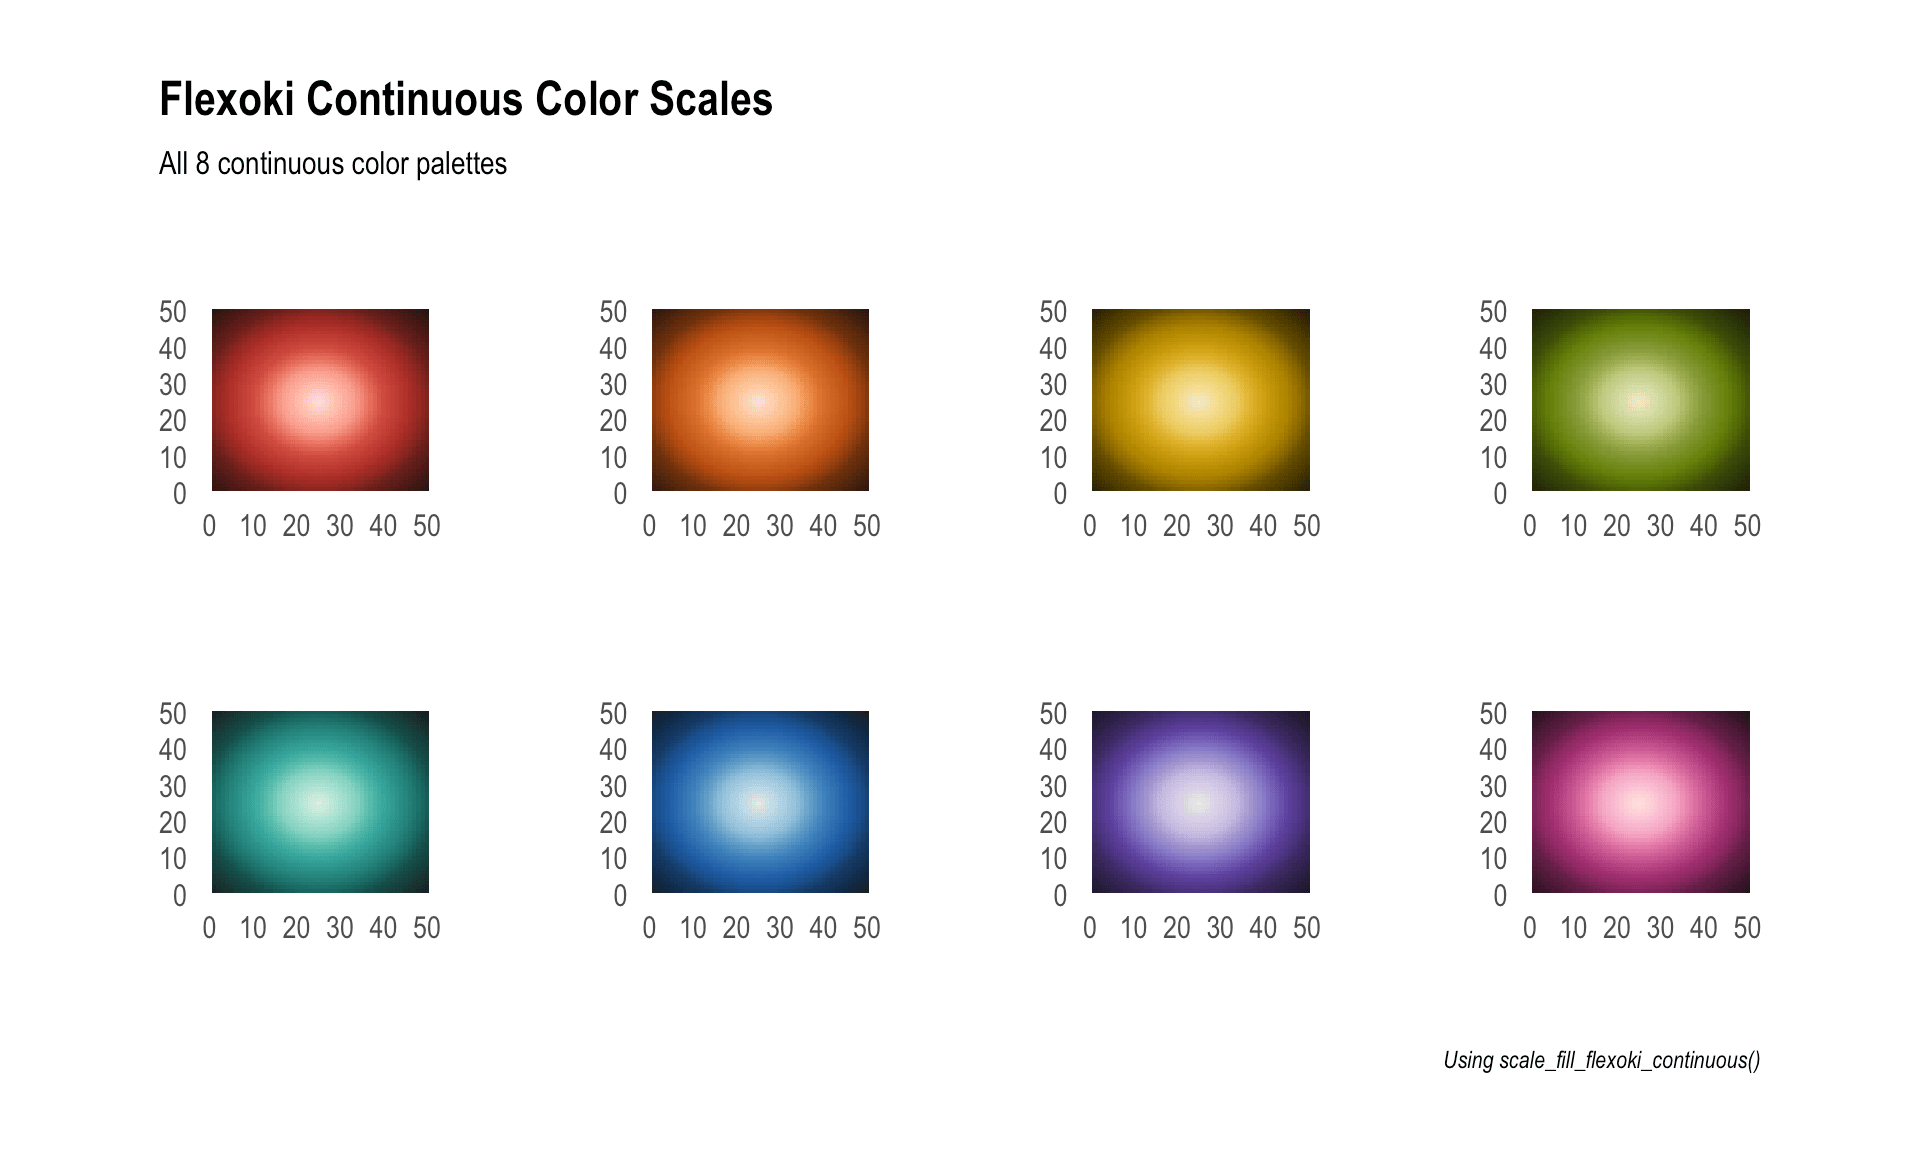
    title="Flexoki Continuous Color Scales",
    subtitle="All 8 continuous color palettes",
    caption="Using scale_fill_flexoki_continuous()",
    theme = theme_ipsum(grid="")
  )
Bit12 Color Scales
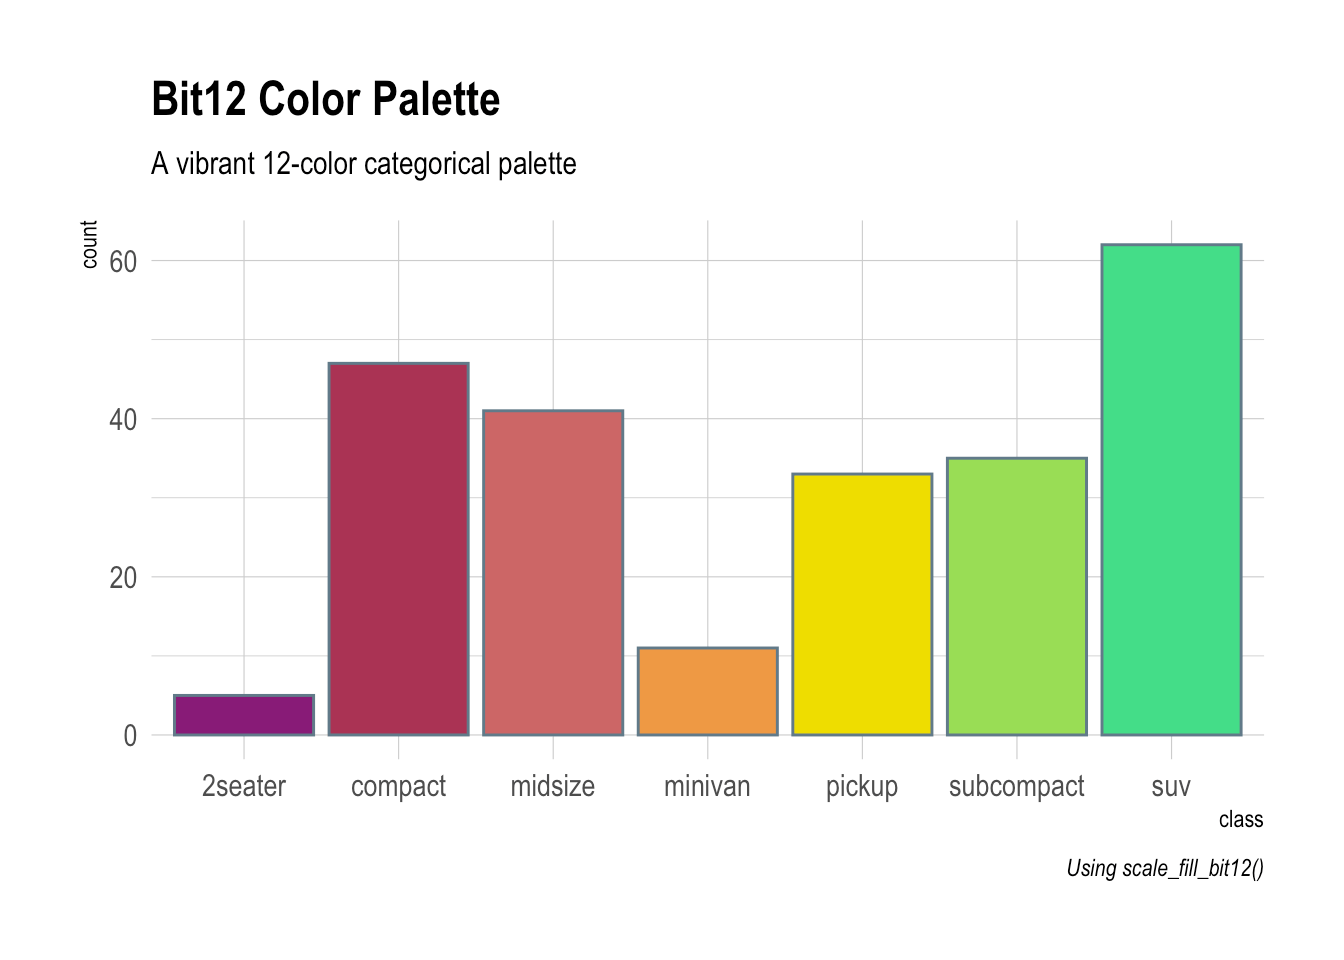
The Bit12 color system provides a set of 12 distinct colors optimized for data visualization.
# Discrete colors example
ggplot(mpg, aes(class, fill=class)) +
  geom_bar() +
  labs(title="Bit12 Color Palette",
       subtitle="A vibrant 12-color categorical palette",
       caption="Using scale_fill_bit12()") +
  theme_ipsum() +
  scale_fill_bit12() +
  theme(legend.position="none")
library(patchwork)

# Taking a subset of the palette for this example
names(bit12)[c(1,3,5,7,9,11)] |>
  map(\(.p) {
    ggplot(grad_df, aes(x, y, fill=z)) +
      geom_tile() +
      scale_fill_bit12_continuous(palette = .p) +
      labs(
        x = NULL, y = NULL, title = .p
      ) +
      theme_ipsum(grid="") +
      theme(legend.position = "none")
  }) |>
  do.call(what = "wrap_plots") +
  plot_layout(ncol = 3) +
  plot_annotation(
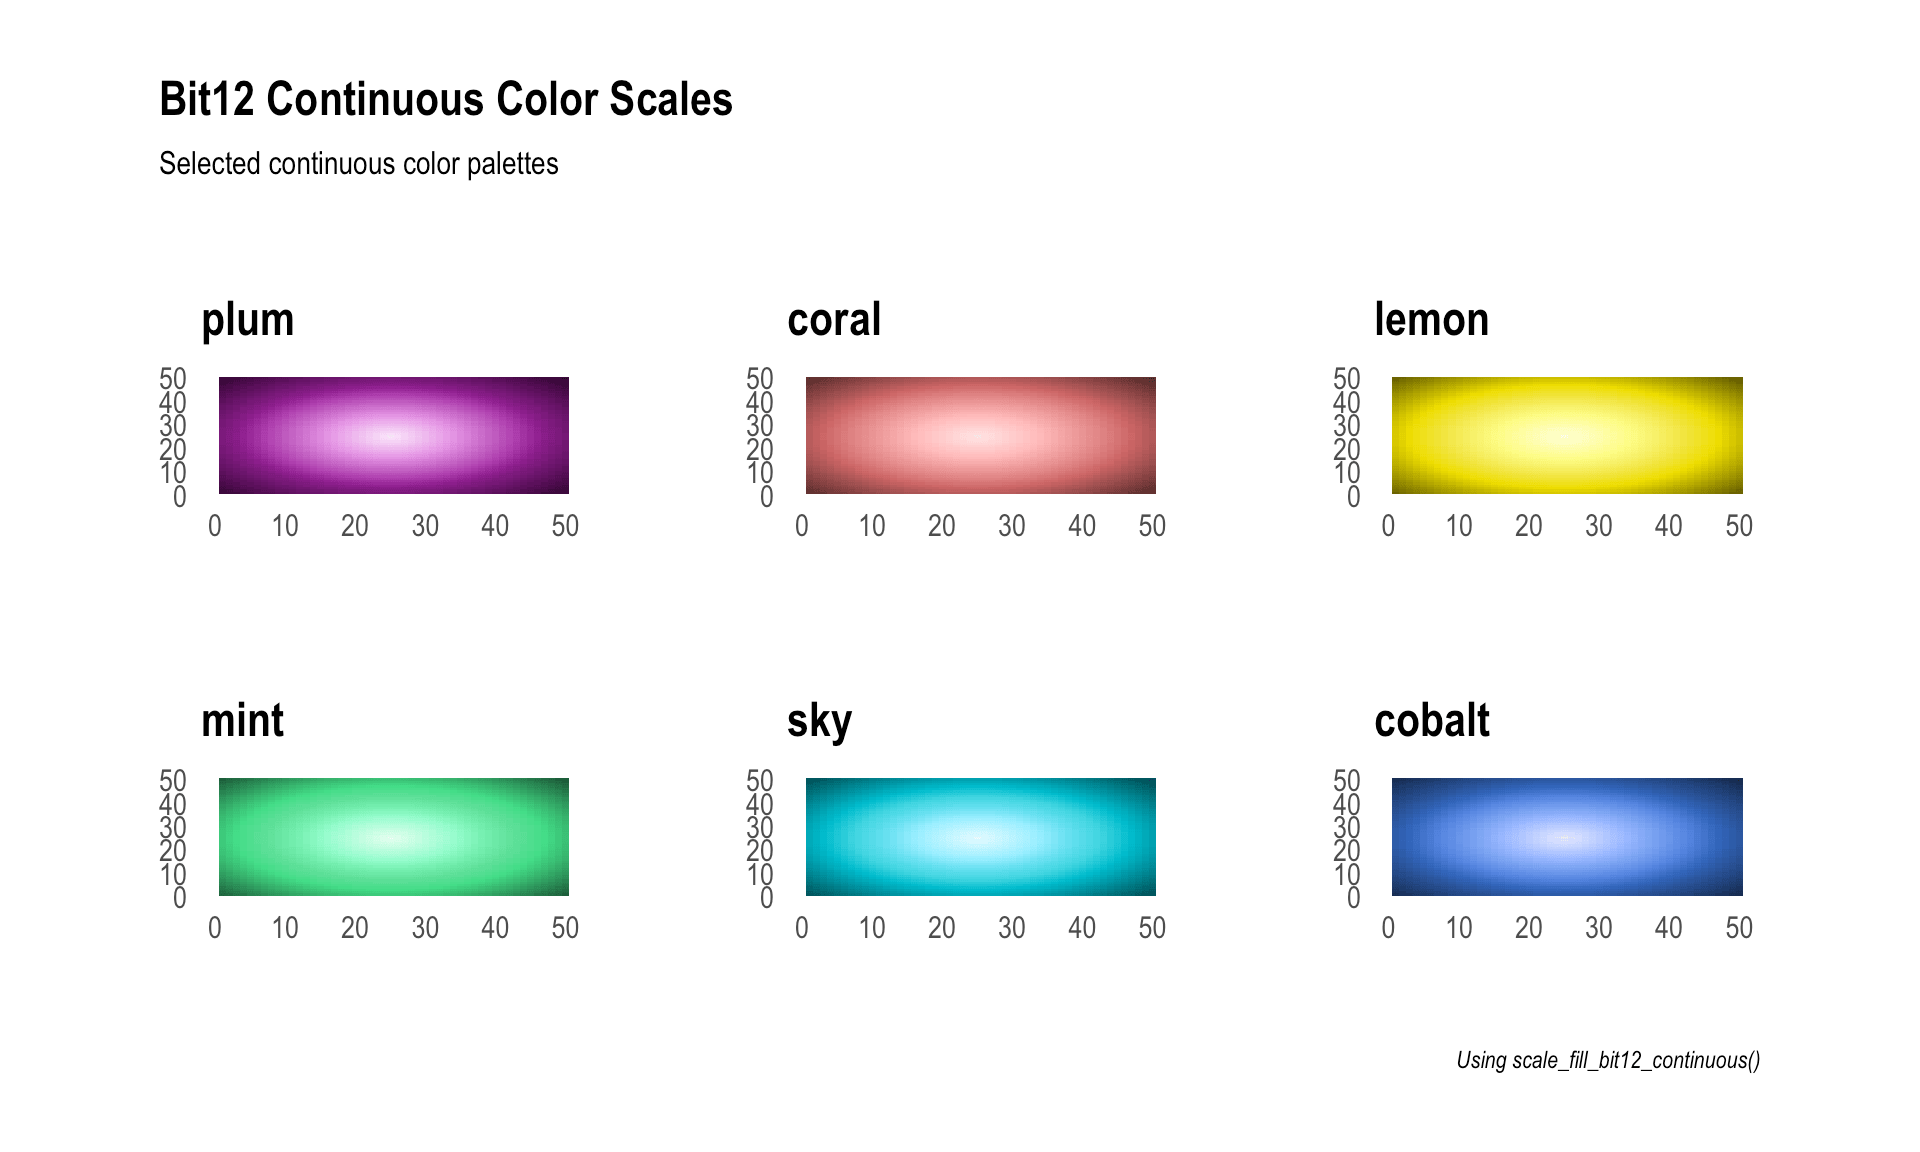
    title="Bit12 Continuous Color Scales",
    subtitle="Selected continuous color palettes",
    caption="Using scale_fill_bit12_continuous()",
    theme = theme_ipsum(grid="")
  )
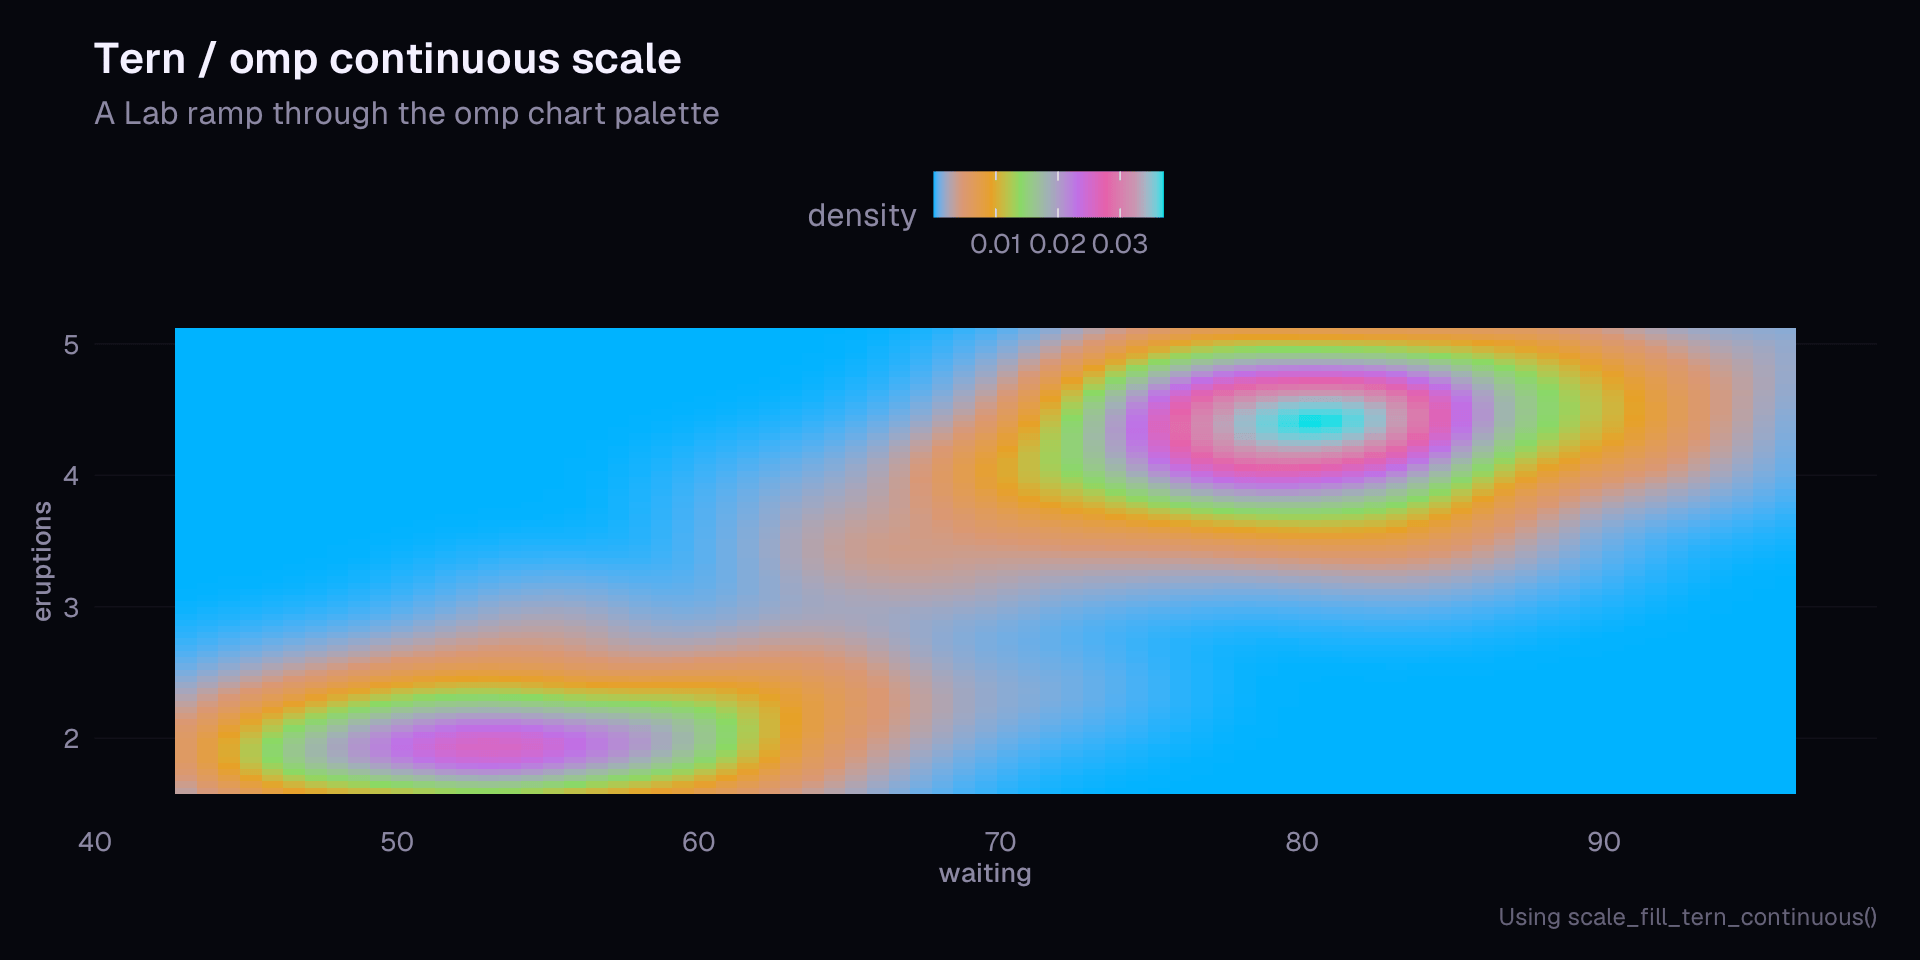
Tern & omp Color Scales
Tern is a terminal, and
omp draws charts inside it. The
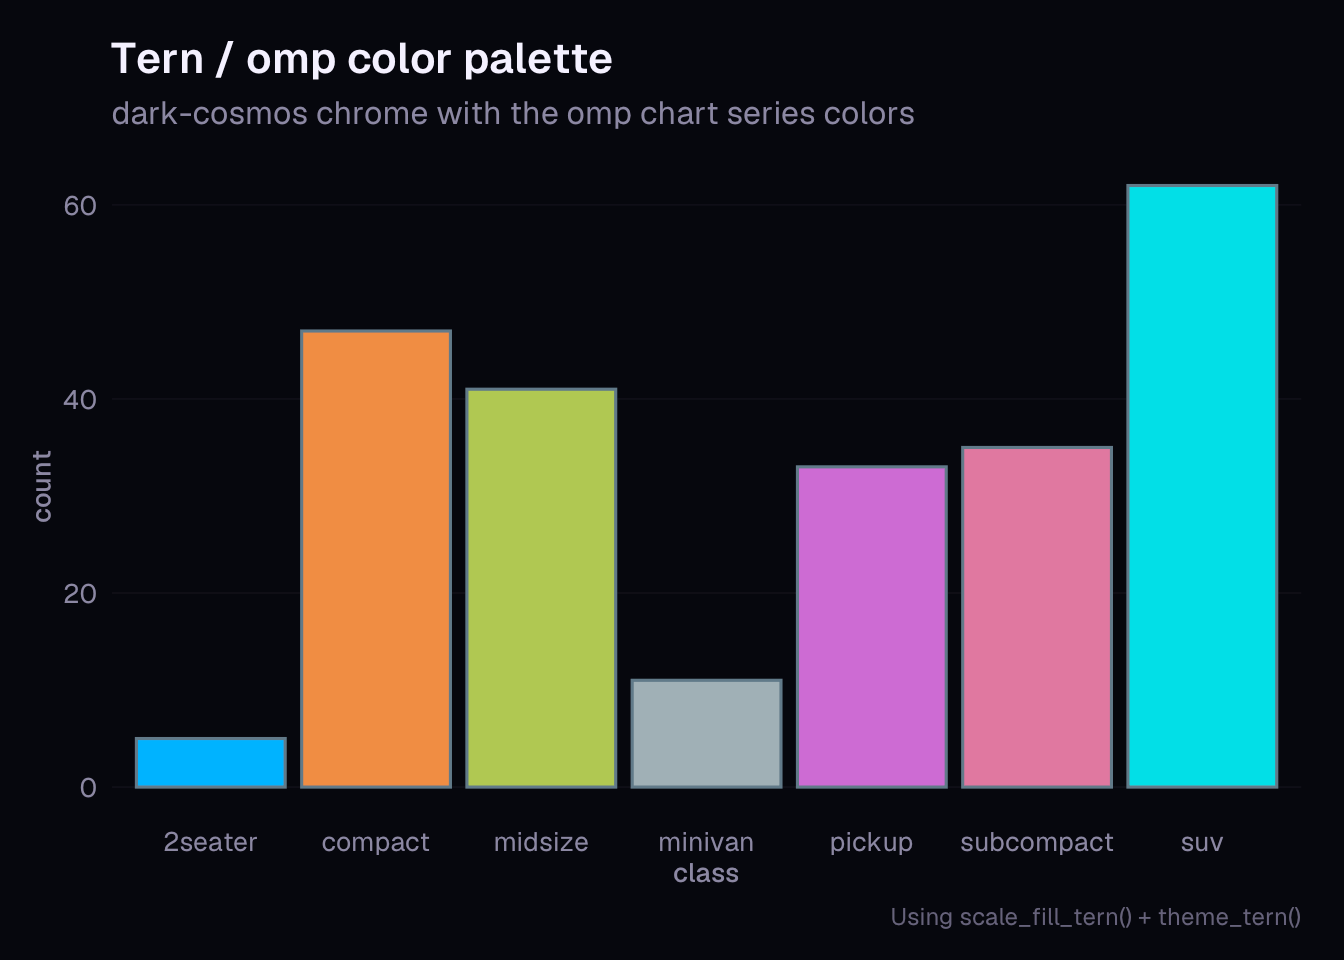
tern_* functions match that pairing: theme_tern() follows Tern’s
dark-cosmos chrome (page and panel #07070d, muted #8c88a3, dim
#66627b, #101019 grid, no axis lines or ticks), while the scales use
the series palette omp derives for its chart SVGs. omp starts from the
theme accent in OKLCH, picks six hues at least 30 degrees apart, clamps
lightness to [0.68, 0.82] in dark themes ([0.52, 0.66] in light
ones) and chroma to 0.19. omp_chart_palette() reproduces that
derivation, so a different accent yields the palette omp would draw.
With the titanium accent the six colors are #00b4ff, #ff8500,
#68e371, #b474f4, #f05b93, and #00dfe8.
ggplot(mpg, aes(class, fill=class)) +
  geom_bar() +
  scale_fill_tern() +
  theme_tern() +
  labs(
    title="Tern / omp color palette",
    subtitle="dark-cosmos chrome with the omp chart series colors",
    caption="Using scale_fill_tern() + theme_tern()"
  ) +
  theme(legend.position="none")
ggplot(faithfuld, aes(waiting, eruptions, fill=density)) +
  geom_tile() +
  scale_fill_tern_continuous() +
  theme_tern() +
  labs(
    title="Tern / omp continuous scale",
    subtitle="A Lab ramp through the omp chart palette",
    caption="Using scale_fill_tern_continuous()"
  )
theme_tern() defaults to Geist, the first family in omp’s chart font
stack. The package ships Geist TTFs in inst/fonts/geist; run
import_geist() to find them and install them on your system before
rendering, or pass a different base_family.
omp_chart_palette()
omp_chart_palette("#5b4bb7")  # Tern dark-cosmos accent
omp_chart_palette(light=TRUE)
hrbrthemes Metrics
| Lang | # Files | (%) | LoC | (%) | Blank lines | (%) | # Lines | (%) |
|---|---|---|---|---|---|---|---|---|
| R | 29 | 0.44 | 2395 | 0.46 | 405 | 0.5 | 1476 | 0.5 |
| SVG | 2 | 0.03 | 150 | 0.03 | 0 | 0.0 | 0 | 0.0 |
| JSON | 2 | 0.03 | 50 | 0.01 | 0 | 0.0 | 0 | 0.0 |
| SUM | 33 | 0.50 | 2595 | 0.50 | 405 | 0.5 | 1476 | 0.5 |
{cloc} 📦 metrics for hrbrthemes
Code of Conduct
Please note that this project is released with a Contributor Code of Conduct. By participating in this project you agree to abide by its terms.
Explore related projects
codecrafters-io/build-your-own-x
Master programming by recreating your favorite technologies from scratch.
560,411 starspublic-apis/public-apis
A collective list of free APIs
496,745 starsmorluto/rea
Reverse engineer anything with agents, from app behavior down to native binaries.
437,863 starsopenclaw/openclaw
The AI that really does things. Any OS. Any Platform. The lobster way. 🦞
394,063 stars