
fatihfurkan46/SignalWeave
fatihfurkan46/SignalWeave has 31 GitHub stars and 10 forks. GitHot measured 0 stars in 24 hours. Last checked 2026-11-15 06:53 UTC. Last push 2026-10-27.
Measured star growth
- in 24h
- 0
- in 7 days
- Collecting history
- in 15 days
- Collecting history
- in 1 month
- Collecting history
Net star changes over overlapping periods, not daily totals. Missing measurements are left blank. Stars measure attention, not software quality.
About
Signal weaving toolkit - combine noisy service metrics into stable, explainable health signals
Developer ToolsREADME.md
Original
SignalWeave
Every AI framework emits telemetry in its own shape. LangChain calls it lc_run_id and latency_ms; an OpenTelemetry span calls it trace_id and start_time; a graph runner calls it session and elapsed_ms. SignalWeave reads those heterogeneous events and weaves them onto one canonical Signal, then groups signals by run and reports reliability, quality, and cost indicators. Nothing is dropped: an unrecognized shape falls through to a permissive generic adapter.
It runs on the Python standard library only, reads from a file or stdin, and writes to stdout, so it drops into a shell pipeline without ceremony.
Pipeline
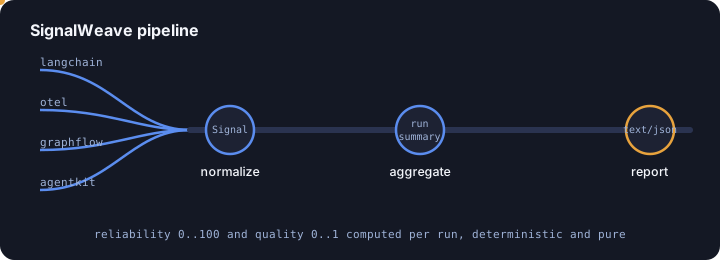
Four stages, each a subcommand:
# Canonical signals, one JSON object per line.
python -m signalweave normalize examples/events.jsonl

# Group into runs and emit the aggregate JSON.
python -m signalweave aggregate examples/events.jsonl

# Full weave report (text by default, or --format json).
python -m signalweave report examples/events.jsonl

# Everything for one run, in detail.
python -m signalweave inspect examples/events.jsonl --run-id run-gamma
Input is either a JSON array of event objects or newline-delimited JSON (JSONL). Pass - (or omit the path) to read stdin, which lets you chain stages or pipe from another tool.
How normalization works
normalize.py detects a source family per event, either from an explicit source or vendor field or from structural fingerprints (span_kind points to OpenTelemetry, lc_run_id to LangChain, graph_node to a graph runner, tool_name plus invocation_type to an agent toolkit). Each family has a small adapter that maps its field names onto the canonical model; anything unmatched uses _adapter_generic.
The canonical Signal is flat and serializes to compact, diff-friendly JSON:
| Field | Meaning |
|---|---|
signal_id |
Deterministic sig_<hash> from run, name, timestamp, ordinal |
run_id |
The workflow run this signal belongs to |
kind |
invocation, tool, retrieval, evaluation, error, or lifecycle |
name |
Step name (node, tool, operation) |
ts |
Epoch milliseconds, coerced from seconds, ISO-8601, or raw numbers |
duration_ms |
Wall-clock duration |
severity |
ok, notice, warn, error, critical |
quality |
Clamped 0..1 score when present, else null |
tokens_in / tokens_out |
Token counts |
source |
Detected vendor family |
attributes |
Passthrough of vendor-specific fields |
SignalKind.coerce and Severity.coerce map common vendor vocabularies onto the canonical enums (for example llm, chat, and completion all become invocation; warning becomes warn). The full field reference lives in docs/SCHEMA.md.
Normalization is deterministic: normalize_stream sorts by (ts, run_id, name, signal_id), so the same input always yields the same output regardless of arrival order.
Indicators
aggregate.py groups signals by run_id and computes three families of indicators, all as pure functions:
- Volume: signal counts by kind, token totals, wall-clock span, and
p50/p95durations. - Quality: mean and minimum quality across scored signals.
- Reliability: a 0 to 100 score that starts at 100 and subtracts a severity penalty (mean severity weight per signal, scaled and capped at 60) and a latency-stability penalty (the coefficient of variation of durations, capped at 20).
Severity weights are ok 0, notice 1, warn 3, error 7, critical 12. The fabric-wide RunGroup carries run_count, signal_count, token totals, fabric_reliability (the mean of per-run reliability), and fabric_quality_mean.
Reports
report.py renders an aggregate two ways, both byte-for-byte reproducible across machines:
--format textprints a fixed-width banner, a per-run table (signals, errors, reliability with an ASCII meter, quality,p50,p95), and a fabric-wide kind distribution.--format jsonemits theRunGroupwith sorted keys and stable separators.
Native aggregation core
engine/signal_aggregate.cpp is a dependency-free C++17 companion. It reads canonical signals as JSONL on stdin (the exact output of signalweave normalize) and emits a per-run reliability aggregate, mirroring signalweave.aggregate so the native and Python paths agree.
make engine                         # build engine/signal_aggregate
make parity                         # normalize | ./signal_aggregate
Example data
examples/events.jsonl carries four runs across four vendor shapes: run-alpha (LangChain), run-beta (agent toolkit), run-gamma (graph runner, including a critical guardrail error), and run-delta (generic evaluation and lifecycle events). examples/events_array.json holds the same style of data as a JSON array, exercising the array input path.
Make targets
| Target | Action |
|---|---|
make check |
Byte-compile the signalweave package |
make normalize |
Normalize the fixture |
make aggregate |
Aggregate the fixture |
make report |
Render the text report |
make engine |
Build the C++ core |
make parity |
Pipe Python normalize output through the native core |
The .github/workflows/ci.yml lane compiles the Python package and builds the C++ engine with no network access.
Module map
model.py:Signal,SignalKind,Severity, and the deterministicmake_signal_id.normalize.py: source detection, the per-vendor adapters, andnormalize_stream.aggregate.py:RunSummary,RunGroup, reliability and percentile math.report.py: text and JSON renderers.cli.py: the argparse command surface (normalize,aggregate,report,inspect).
License
See LICENSE.