
faratech/htop-win
faratech/htop-win has 87 GitHub stars and 10 forks. GitHot measured 0 stars in 24 hours. Last checked 2026-11-17 16:43 UTC. Last push 2026-11-09.
What you can do
- Efficiency Mode (EcoQoS): Reduce power consumption for background processes
- Elevation detection: See which processes run as Administrator
- Architecture display: Identify x86, x64, and ARM64 processes
- Service account support: View SYSTEM, LOCAL SERVICE, NETWORK SERVICE processes
Measured star growth
- in 24h
- 0
- in 7 days
- Collecting history
- in 15 days
- Collecting history
- in 1 month
- Collecting history
Net star changes over overlapping periods, not daily totals. Missing measurements are left blank. Stars measure attention, not software quality.
About
Fast interactive htop-like process monitor and system resource viewer for Windows, written in native Rust with full TUI navigation.
Developer ToolsREADME.md
Originalhtop-win
A native Windows clone of htop - the beloved interactive process viewer, rebuilt from the ground up in Rust.





Inspired by the original htop by Hisham Muhammad and contributors.
Why htop-win?
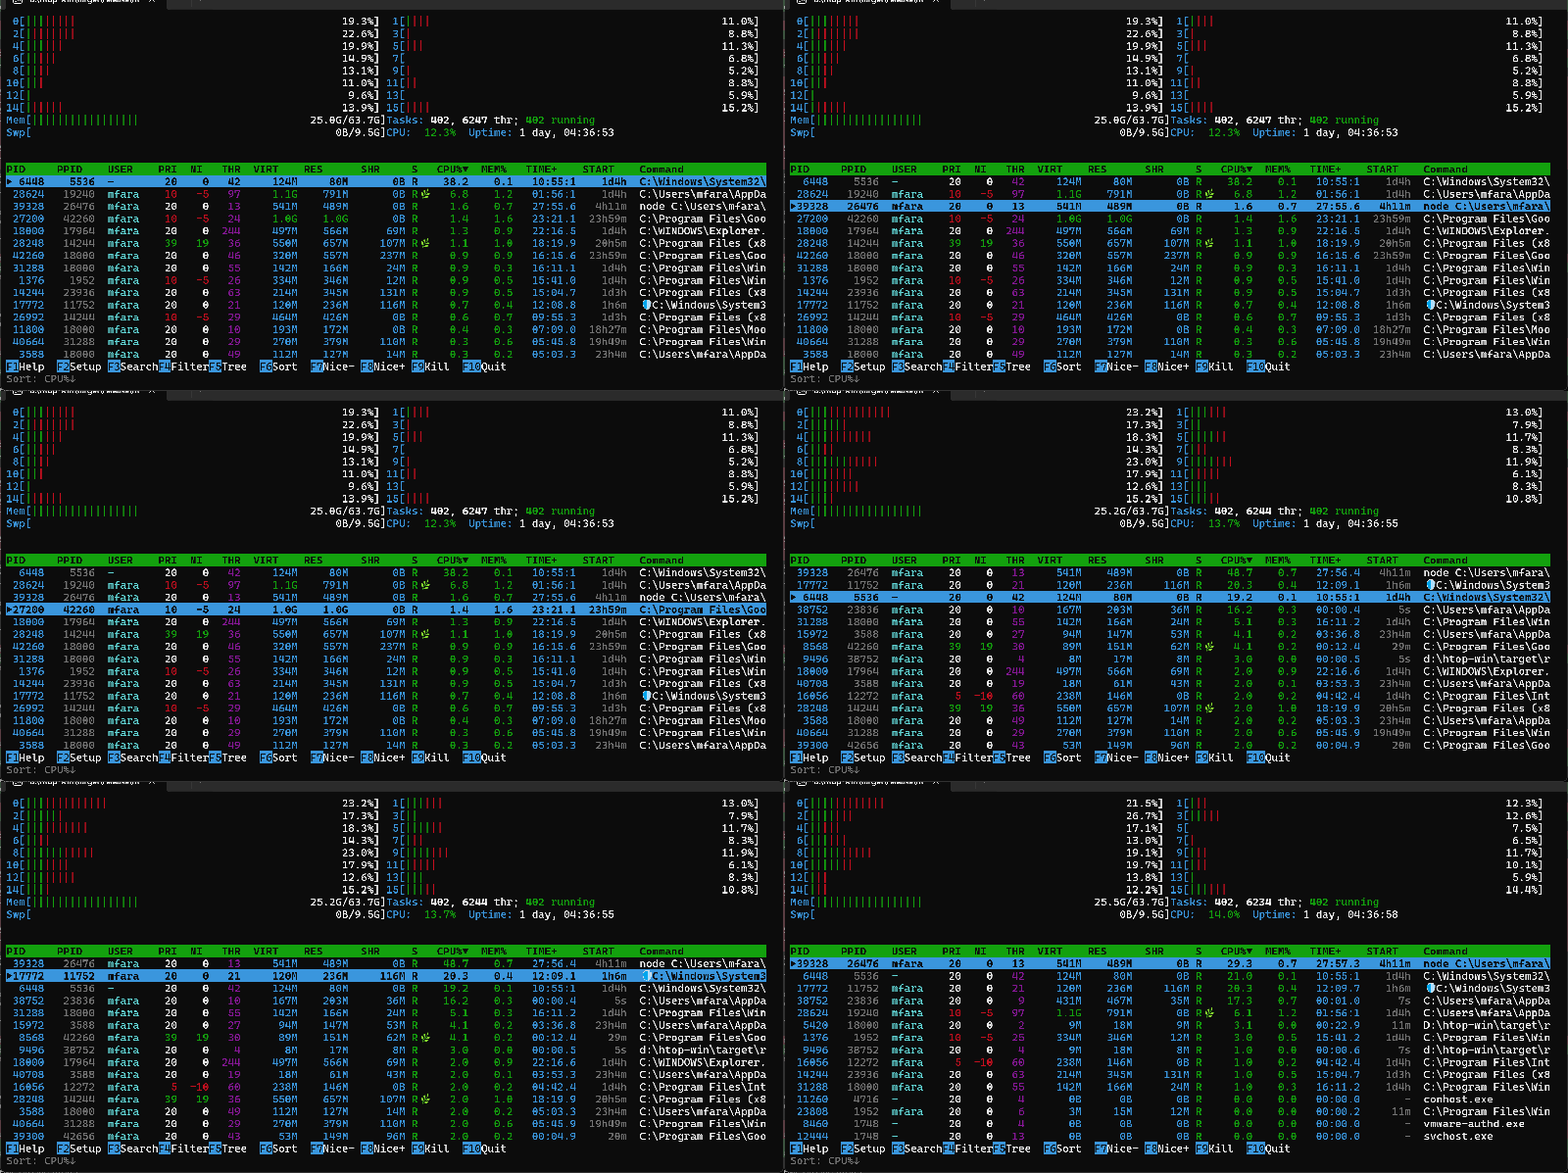
Windows Task Manager is fine, but power users deserve better. htop-win brings the beloved Unix htop experience to Windows with:
- Blazing fast performance - Direct Windows API calls, no wrappers
- Small footprint - ~930KB self-contained binary with minimal dependencies
- Full htop compatibility - Same keyboard shortcuts you already know
- Windows-native features - Efficiency Mode, CPU affinity, elevation detection
- GPU/NPU monitoring - Task Manager parity via D3DKMT, auto-enabled when hardware exists
- Automatic updates - Background update checks with one-command upgrades
Features
Real-time System Monitoring
- Per-core CPU usage with color-coded gradient bars (green → yellow → red)
- Memory and swap usage visualization
- GPU meter - Total GPU utilization bar (shown automatically when a GPU is present)
- NPU meter - NPU utilization bar (shown automatically on Copilot+ and AI PC hardware)
- Network I/O rates (Rx/Tx)
- Disk I/O rates (read/write)
- Battery status and charge indicator
- System uptime and task/thread counts
- Configurable meter modes: Bar, Text, Graph, or Hidden
- Responsive header: scales gracefully from narrow to ultrawide terminals
Interactive Process Management
- 27 sortable columns: PID, CPU%, MEM%, GPU%, NPU%, I/O rate, TIME+, Command, and more
- Screen tabs: Switch between the Main view and the dedicated I/O tab
- Tree view: Visualize parent-child process relationships with collapsible branches
- Search & Filter: Find processes instantly with live search
- Process tagging: Select multiple processes for batch operations
- Terminate processes: Force terminate the selected process or tagged processes
- Priority control: Change process priority class (Idle → Realtime)
- CPU affinity: Pin processes to specific CPU cores
GPU & NPU Monitoring (Task Manager Parity)
- System-wide GPU utilization meter in the header
- System-wide NPU utilization meter in the header (Copilot+ PCs)
- Per-process GPU% and GPU-MEM columns
- Per-process NPU% and NPU-MEM columns
- Uses the D3DKMT statistics DDI — the same source as Task Manager
- Automatically detected and enabled; hidden on machines without the hardware
I/O Tab
A dedicated tab focused on disk I/O activity:
- IO_RATE - Combined read + write rate per process (bytes/sec)
- IO_R/s - Read rate
- IO_W/s - Write rate
- HNDL - Open handle count
- Sorted by I/O rate by default
Windows-Specific Features
- Efficiency Mode (EcoQoS): Reduce power consumption for background processes
- Elevation detection: See which processes run as Administrator
- Architecture display: Identify x86, x64, and ARM64 processes
- Service account support: View SYSTEM, LOCAL SERVICE, NETWORK SERVICE processes
- Modified executable detection: Highlight processes with changed/deleted binaries
Full Mouse Support
- Click to select, double-click for details
- Right-click to tag processes
- Click column headers to sort
- Scroll wheel navigation
- Click meters to cycle display modes
- Click tabs to switch views
Customization
- 8 color themes: Default, Monochrome, Light Terminal, Midnight, Nord, and more
- Configurable columns: Show/hide and reorder any column, saved per-tab
- Adjustable refresh rate: 100ms to 5 seconds
- Persistent settings: Configuration saved to
%APPDATA%\htop-win\config
Installation
Quick Install (Recommended)
Download the latest release for your architecture:
| Architecture | Download |
|---|---|
| x64 (Intel/AMD) | htop-win-amd64.exe |
| ARM64 | htop-win-arm64.exe |
Verification
All release binaries are signed with Azure Trusted Signing and verified with GitHub artifact attestation. Verify downloaded binaries using the GitHub CLI:
gh attestation verify htop-win-amd64.exe --repo faratech/htop-win --signer-workflow faratech/htop-win/.github/workflows/release.yml
gh attestation verify htop-win-arm64.exe --repo faratech/htop-win --signer-workflow faratech/htop-win/.github/workflows/release.yml
Install to PATH
Run the downloaded executable as your normal user:
.\htop-win-amd64.exe --install
This performs a per-user install to %LOCALAPPDATA%\Microsoft\WindowsApps\htop.exe,
which is already on the user's PATH. Administrator privileges and UAC elevation
are not required.
Update
Check for updates and install automatically:
htop --update
Or force reinstall the current version:
htop --update --force
Updates (manual and automatic) are installed only if the downloaded binary
carries a valid Authenticode signature from Fara Technologies LLC through
Microsoft Trusted Signing, identifies itself as htop-win, and has exactly the
release's version, newer than the one running (--force may reinstall the
same version, never an older one). Anything else is rejected and nothing is
replaced.
Build from Source
# Clone the repository
git clone https://github.com/faratech/htop-win.git
cd htop-win

# Build optimized release (~930KB binary)
cargo build --release

# Run
.\target\release\htop-win.exe
Requirements: Rust 1.99.1+ (2024 edition), Windows 10/11. The repository pins Rust 1.99.1 via rust-toolchain.toml.
Usage
htop-win [OPTIONS]

Options:
  -d, --delay <MS>          Refresh rate in milliseconds [default: 1500]
  -u, --user <USER>         Show only processes from this user
  -p, --pid <PID,...>       Show only these PIDs (comma-separated)
  -s, --sort <COLUMN>       Sort by: pid, ppid, cpu/cpu%, mem/mem%/memory, time,
                            command/cmd, user, threads/thr
  -t, --tree                Start in tree view mode
  -F, --filter <STRING>     Initial filter string
  -H, --highlight-changes <SECS>
      --highlight <SECS>    Highlight new processes for N seconds
  -n, --max-iterations <N>
      --iterations <N>      Exit after N updates (for scripting)
      --benchmark[=<N>]     Run N iterations and print timing stats [default: 20]
      --benchmark-iterations <N>
                            Run benchmark mode with N iterations
      --inefficient         Disable Efficiency Mode / EcoQoS
      --no-color            Monochrome mode
      --no-mouse            Disable mouse support
      --no-meters           Hide header meters
      --readonly            Disable process mutation operations
      --install             Install per-user to PATH (no administrator required)
      --update              Check for and install updates
      --gpu-debug           Print GPU/NPU adapter diagnostics and exit
      --cpu-debug           Print CPU / processor-group diagnostics and exit
  -f, --force               Force install/update
  -h, --help                Show help
  -V, --version             Show version
Examples
# Monitor with 500ms refresh rate
htop -d 500

# Show only processes from current user
htop -u $env:USERNAME

# Start in tree view, sorted by memory
htop -t -s mem

# Filter to show only Chrome processes
htop -F chrome

# Monitor specific PIDs
htop -p 1234,5678,9012

# Benchmark with the default or an explicit iteration count
htop --benchmark
htop --benchmark=50
htop --benchmark-iterations 50
Keyboard Shortcuts
Navigation
| Key | Action |
|---|---|
↑ / k |
Move selection up |
↓ / j |
Move selection down |
PgUp / PgDn |
Page up / down |
Home / g |
Jump to first process |
End / G |
Jump to last process |
Tab / Shift+Tab |
Switch screen tabs |
1 / 2 |
PID prefix search |
Main Controls (Function Keys)
| Key | Action |
|---|---|
F1 / ? |
Help screen |
F2 / S |
Setup menu |
F3 / / |
Search processes |
F4 / \ |
Filter processes |
F5 / t |
Toggle tree view |
F6 / < > |
Change sort column |
F7 / ] |
Raise priority (opens dialog one class higher, Enter to apply) |
F8 / [ |
Lower priority (opens dialog one class lower, Enter to apply) |
F9 |
Force terminate process |
F10 / q |
Quit |
Process Operations
| Key | Action |
|---|---|
Enter |
View process details |
Space |
Tag/untag process |
c |
Tag process and all children |
U |
Untag all processes |
Ctrl+T |
Tag all with same name |
Ctrl+A |
Toggle tag all visible |
e |
Environment inspection unavailable |
w |
Wrap executable path |
a |
Set CPU affinity |
F |
Toggle follow mode |
During normal viewing, the selection bar and scroll position stay in place as
processes change sort order. Press F to follow a particular process instead.
Process actions capture the selected process when the action key is pressed;
an open kill, priority, or affinity dialog keeps that target even if the list
reorders. The process identity is verified before applying the action to guard
against PID reuse.
Tree View
| Key | Action |
|---|---|
+ / = |
Expand branch |
- |
Collapse branch |
* |
Toggle expand/collapse all |
Backspace |
Collapse to parent |
Display
| Key | Action |
|---|---|
# |
Toggle header meters |
p |
Toggle program path display |
H |
Toggle user threads |
K |
Toggle kernel threads |
Z |
Pause/resume updates |
I |
Invert sort order |
Quick Sort
| Key | Sort By |
|---|---|
P |
CPU% |
M |
Memory% |
T |
Time |
N |
PID |
Configuration
htop-win saves settings to %APPDATA%\htop-win\config\config.json. Configure via the Setup menu (F2) or edit directly:
{
  "refresh_rate_ms": 1500,
  "tree_view_default": false,
  "color_scheme": "Default",
  "show_kernel_threads": false,
  "show_program_path": false,
  "highlight_new_processes": true,
  "highlight_large_numbers": true,
  "cpu_meter_mode": "Bar",
  "memory_meter_mode": "Bar",
  "visible_columns": ["PID", "USER", "PRI", "CLASS", "THR", "VIRT", "RES", "SHR", "S", "CPU%", "MEM%", "TIME+", "Command"],
  "mouse_enabled": true,
  "confirm_kill": true
}
Color Themes
Access via Setup (F2) → Color Scheme:
- Default - Classic htop colors
- Monochrome - No colors (accessibility)
- Black on White - Light theme
- Light Terminal - For light backgrounds
- Midnight - Dark blue theme
- Blacknight - Pure dark theme
- Broken Gray - Subtle grays
- Nord - Nord color palette
Columns Reference
Main Tab
| Column | Description | Width |
|---|---|---|
PID |
Process ID | 7 |
PPID |
Parent Process ID | 7 |
USER |
Process owner | 10 |
PRI |
Priority (0-31) | 4 |
CLASS |
Priority class (Idle/Normal/High/Realtime) | 7 |
THR |
Thread count | 4 |
VIRT |
Virtual memory | 8 |
RES |
Resident (physical) memory | 8 |
SHR |
Shared memory | 8 |
S |
Status if known; ? when Windows native process query does not expose htop-style state |
3 |
CPU% |
CPU usage percentage | 6 |
MEM% |
Memory usage percentage | 6 |
GPU% |
GPU utilization % (max across all GPU engines) | 6 |
GPU-MEM |
GPU committed memory across all adapters | 8 |
NPU% |
NPU utilization % | 6 |
NPU-MEM |
NPU dedicated + shared memory | 8 |
TIME+ |
Cumulative CPU time | 10 |
START |
Process start time | 8 |
Command |
Executable path/name (no arguments) | Flexible |
ELEV |
Elevated/Admin status | 4 |
ARCH |
Architecture (x86/x64/ARM64) | 5 |
ECO |
Efficiency Mode status | 4 |
New default configs include GPU% / GPU-MEM and NPU% / NPU-MEM when relevant hardware is detected. Existing custom column layouts are preserved; enable these columns from Setup if you want to add them later.
I/O Tab
| Column | Description |
|---|---|
PID |
Process ID |
USER |
Process owner |
IO_RATE |
Combined read + write rate (bytes/sec) |
IO_R/s |
Read rate |
IO_W/s |
Write rate |
IO_RD |
Cumulative bytes read |
IO_WR |
Cumulative bytes written |
HNDL |
Open handle count |
Command |
Executable path/name (no arguments) |
System Requirements
- OS: Windows 10 (1903+) or Windows 11
- Architecture: x64 (AMD64) or ARM64
- Terminal: Windows Terminal recommended (supports full color and Unicode)
- Privileges: Administrator recommended for full process visibility
Dependencies
Minimal dependency set optimized for small binary size:
| Dependency | Purpose |
|---|---|
| crossterm | Cross-platform terminal I/O |
| windows-rs | Native Windows API bindings |
| unicode-width | Unicode character width calculation |
| bitflags | Terminal modifier flags |
| lexopt | Lightweight argument parsing |
No heavy frameworks: Custom terminal UI library (replaces ratatui), custom JSON parser (replaces serde).
Performance
htop-win is designed for efficiency:
- ~930KB binary - Minimal dependencies, LTO, size-optimized release profile
- Buffered rendering - One terminal flush per frame; 32-byte packed cells
- Smart caching & gating - Subsystems collect only when their meters are visible
- Background data collection - System metrics refresh off the UI thread; idle when paused
- Diff-based rendering - Only updates changed terminal cells
- Direct API access - No abstraction layers
Comparison with Alternatives
| Feature | htop-win | Task Manager | Process Explorer |
|---|---|---|---|
| Terminal-based | Yes | No | No |
| Keyboard-driven | Yes | Limited | Limited |
| Tree view | Yes | Yes | Yes |
| Process search | Yes | Yes | Yes |
| CPU affinity | Yes | Yes | Yes |
| GPU/NPU monitoring | Yes | Yes | No |
| Efficiency Mode | Yes | Yes | No |
| I/O per-process | Yes | No | Yes |
| Custom columns | Yes | Limited | Yes |
| Color themes | 8 themes | No | No |
| Binary size | ~930KB | N/A | ~2MB |
| Auto-update | Yes | N/A | No |
Contributing
Contributions are welcome! Please feel free to submit issues and pull requests.
- Fork the repository
- Create your feature branch (
git checkout -b feature/amazing-feature) - Commit your changes (
git commit -m 'Add amazing feature') - Push to the branch (
git push origin feature/amazing-feature) - Open a Pull Request
License
This project is licensed under the MIT License - see the LICENSE file for details.
Acknowledgments
- htop - The original inspiration by Hisham Muhammad
- windows-rs - Excellent Windows API bindings
- crossterm - Cross-platform terminal library
Star this repo if you find it useful!
https://github.com/faratech/htop-win