
f5/unovis
f5/unovis has 2,865 GitHub stars and 76 forks. GitHot measured 0 stars in 24 hours. Last checked 2026-11-06 20:28 UTC. Last push 2026-10-29.
Modular data visualization framework for React, Angular, Svelte, Vue, and vanilla TypeScript or JavaScript
Measured star growth
- in 24h
- 0
- in 7 days
- Collecting history
- in 15 days
- Collecting history
- in 1 month
- Collecting history
Net star changes over overlapping periods, not daily totals. Missing measurements are left blank. Stars measure attention, not software quality.
README.md
Originalhttps://user-images.githubusercontent.com/755708/205744216-5e9efd10-794b-4ce1-9aca-580c34fad193.mp4
🟨 Unovis is a modular data visualization framework for React, Angular, Svelte, Vue, Solid and vanilla TypeScript or JavaScript:
- 📈 🗺 It has charts, maps, network graphs, and more!
- 🌳 Tree-shakable and supports individual component imports to reduce your bundle size;
- 🎨 Highly customizable, thanks to the CSS-variables support.
Learn more about Unovis on unovis.dev
Quick Start
You can install the core of the library @unovis/ts and framework-specific packages (if you use React, Angular, Svelte, Vue or Solid) from NPM:
npm install -P @unovis/ts @unovis/<react|angular|svelte|vue|solid>
Now you can import components and create your first chart! Here's how to build a simple line chart uising Unovis and React:
import React, { useCallback } from 'react'
import { VisXYContainer, VisLine, VisAxis } from '@unovis/react'

type DataRecord = { x: number; y: number }
const data: DataRecord[] = [
  { x: 0, y: 0 },
  { x: 1, y: 2 },
  { x: 2, y: 1 },
]

export function BasicLineChart (): JSX.Element {
  return (
    <VisXYContainer data={data}>
      <VisLine<DataRecord>
        x={useCallback(d => d.x, [])}
        y={useCallback(d => d.y, [])}
      ></VisLine>
      <VisAxis type="x"></VisAxis>
      <VisAxis type="y"></VisAxis>
    </VisXYContainer>
  )
}
Looking for Angular, Svelte, Vue, Solid or TypeScript examples? Check out the Quick Start page on our website.
Examples and Documentation
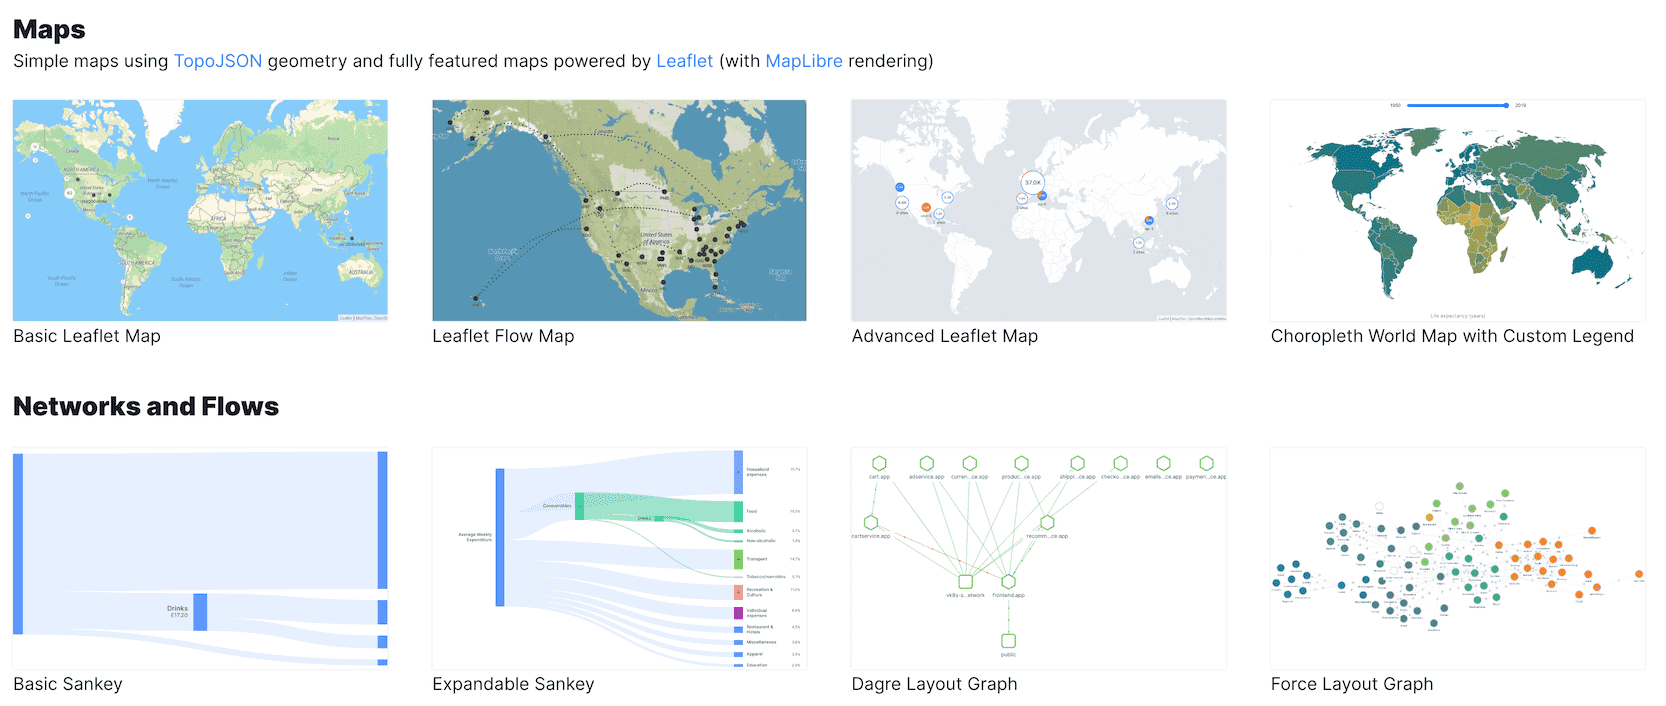
📖 Unovis has an extensive documentation with code snippets for React, Angular, Svelte and TypeScript.
🖼 Also there's a growing gallery of examples, from where you can copy the code over to your project or try it live on StackBlitz.
Repository structure

| Package | Description | Version | Downloads |
|---|---|---|---|
@unovis/ts |
Core TypeScript package | ||
@unovis/react |
React components | ||
@unovis/angular |
Angular components | ||
@unovis/svelte |
Svelte components | ||
@unovis/vue |
Vue components | ||
@unovis/solid |
Solid components | ||
@unovis/ssr |
Server-side rendering: charts to SVG/PNG in Node | ||
@unovis/mcp |
MCP server generating charts as SVG | ||
packages/website |
Website, docs and examples | — | — |
Contributing
Pull requests are welcome. For major changes, please open an issue first to discuss what you would like to change. For more information, please read CONTRIBUTING.
Maintainers


Contributors


License
Unovis is licensed under Apache-2.0
Explore related projects
freeCodeCamp/freeCodeCamp
freeCodeCamp.org's open-source codebase and curriculum. Learn math, programming, and computer science for free.
458,685 starsdonnemartin/system-design-primer
Learn how to design large-scale systems. Prep for the system design interview. Includes Anki flashcards.
377,177 starsreact/react
The library for web and native user interfaces.
252,318 starsvuejs/vue
This is the repo for Vue 2. For Vue 3, go to https://github.com/vuejs/core
212,625 stars