
eurostat/gridviz
eurostat/gridviz has 249 GitHub stars and 13 forks. Star changes are not measured yet. Last checked 2026-11-15 20:32 UTC. Last push 2026-11-13.
Measured star growth
- in 24h
- Update delayed
- in 7 days
- Update delayed
- in 15 days
- Update delayed
- in 1 month
- Update delayed
Net star changes over overlapping periods, not daily totals. Missing measurements are left blank. Stars measure attention, not software quality.
About
A library for visualizing gridded data 🌐
DataREADME.md
OriginalGridviz




Gridviz is a JavaScript library for visualizing gridded data (or any tabular dataset with x/y coordinates for that matter) in the browser using a large variety of cartographic styles and techniques. Unlike traditional raster-based web mapping tools, Gridviz renders everything client-side, on the fly.
Styles
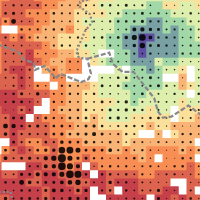
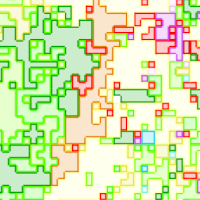
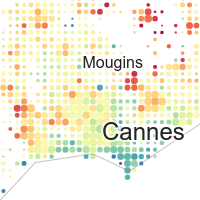
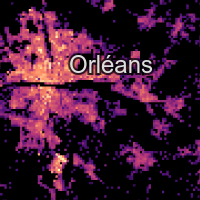
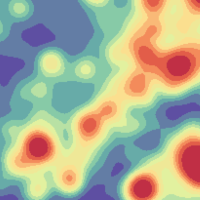
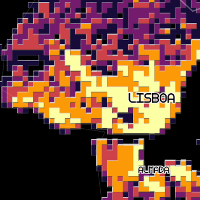
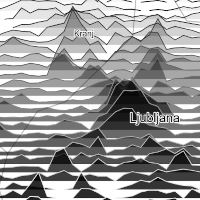
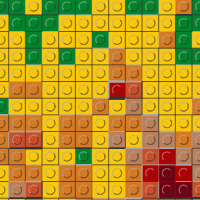
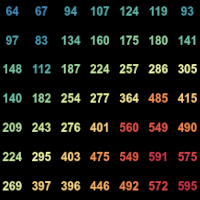
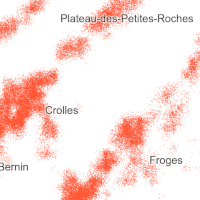
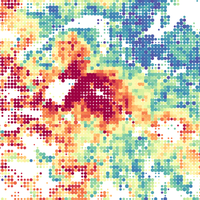
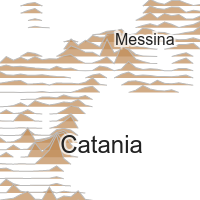
Browse the examples gallery to see the different customisable styles available for visualizing gridded data with gridviz, with live examples and their source code.
Live Demos
- Examples gallery - all the examples of the repository, with thumbnails.
- Europe - 1km resolution - Census total population
- Europe - 1km resolution - Census population composition
- Europe - 100m resolution - Accessibility to basic services
- Europe - 100m resolution - Relief
- Germany - 100m resolution - Zensus 2011
- France - 200m resolution - INSEE Filosofi. Focus on total population and income.
- Norway - 250m resolution - SSB
- Norway - 20 years of population - SSB: by year, change between two years, time series, year of the maximum.
- Croatia - 1km resolution - DZS 2015 grid
- Britain and Ireland - birds - 2km resolution - Bird Atlas 2007-11: abundance of eight species, by season
- European seas - ships - 1km resolution - EMODnet: 13 ship types, 2017 to 2024
- Belgium population, as mixed resolution layer.
Installation
Node.js
npm install gridviz
then
import * as gridviz from 'gridviz'
Or you can cherry-pick only the modules that you need, for example:
import { Map, SquareColorWebGLStyle } from 'gridviz'
Basic example
Here’s a basic example that loads a CSV file of a European population grid (10 km resolution):
//define map with initial view
const map = new gridviz.Map(document.getElementById('map'), { x: 4500000, y: 2900000, z: 3000 })

//define dataset
const dataset = new gridviz.CSVGrid(
    map,
    'https://raw.githubusercontent.com/eurostat/gridviz/master/assets/csv/Europe/pop_2018_10km.csv',
    10000
)

//define color for each cell
const colorFunction = (cell) => {
    if (cell.population > 150000) return '#993404'
    else if (cell.population > 60000) return '#d95f0e'
    else if (cell.population > 20000) return '#fe9929'
    else if (cell.population > 6000) return '#fec44f'
    else if (cell.population > 1500) return '#fee391'
    else return '#ffffd4'
}

//define style
const style = new gridviz.ShapeColorSizeStyle({ color: colorFunction })

//add layer to map. The tooltip of a cell is written by cellInfoHTML: without it, it lists the names of the columns of the data.
map.layers = [
    new gridviz.GridLayer(dataset, [style], {
        cellInfoHTML: (c) => '<b>' + (+c.population).toLocaleString() + '</b> inhabitants (2018)',
    }),
]
See the documentation page for more information.
standalone
<script src="https://unpkg.com/gridviz/dist/gridviz.min.js"></script>
Documentation
See the gridviz documentation page.
Grid tiling
In order to visualize large grids efficiently, you can produce tiled grids in a tiled grid format with GridTiler.
About
| contributors |   |
| version | See npm |
| status | Since 2020 |
| license | EUPL 1.2 |
Tests
npm test runs the unit tests. These run in Chrome: npm run test:browser (hover, with real data), npm run test:gpu (the GPU renderer against the map's own drawing), npm run test:csv-worker, npm run test:fullscreen. Before a release, npm run test:compat compares every example of the gallery with the published version, at rest and after a drag, the wheel and a zoom button, and npm run build makes both bundles.
Support and contribution
Feel free to ask support, fork the project or simply star it (it's always a pleasure).
Copyright
The Eurostat NUTS dataset is copyrighted. There are specific provisions for the usage of this dataset which must be respected. The usage of these data is subject to their acceptance. See the Eurostat-GISCO website for more information.
Disclaimer
The designations employed and the presentation of material on these maps do not imply the expression of any opinion whatsoever on the part of the European Union concerning the legal status of any country, territory, city or area or of its authorities, or concerning the delimitation of its frontiers or boundaries. Kosovo*: This designation is without prejudice to positions on status, and is in line with UNSCR 1244/1999 and the ICJ Opinion on the Kosovo declaration of independence. Palestine*: This designation shall not be construed as recognition of a State of Palestine and is without prejudice to the individual positions of the Member States on this issue.