
elastic/LogstashUI
elastic/LogstashUI has 34 GitHub stars and 6 forks. GitHot measured 0 stars in 24 hours. Last checked 2026-11-14 20:04 UTC. Last push 2026-11-13.
Measured star growth
- in 24h
- 0
- in 7 days
- Collecting history
- in 15 days
- Collecting history
- in 1 month
- Collecting history
Net star changes over overlapping periods, not daily totals. Missing measurements are left blank. Stars measure attention, not software quality.
About
A control plane and visual pipeline editor for Logstash
SecurityREADME.md
OriginalLogstashUI
A control plane and visual editor for Logstash, built for managing Logstash nodes and authoring, simulating, and deploying pipelines.
⚠️ Beta Release - This project is under active development. Features may change.
See CHANGELOG.md for release notes and the matching LogstashAgent version. Operator guide: agent roles / ports / coexistence / VERSION.
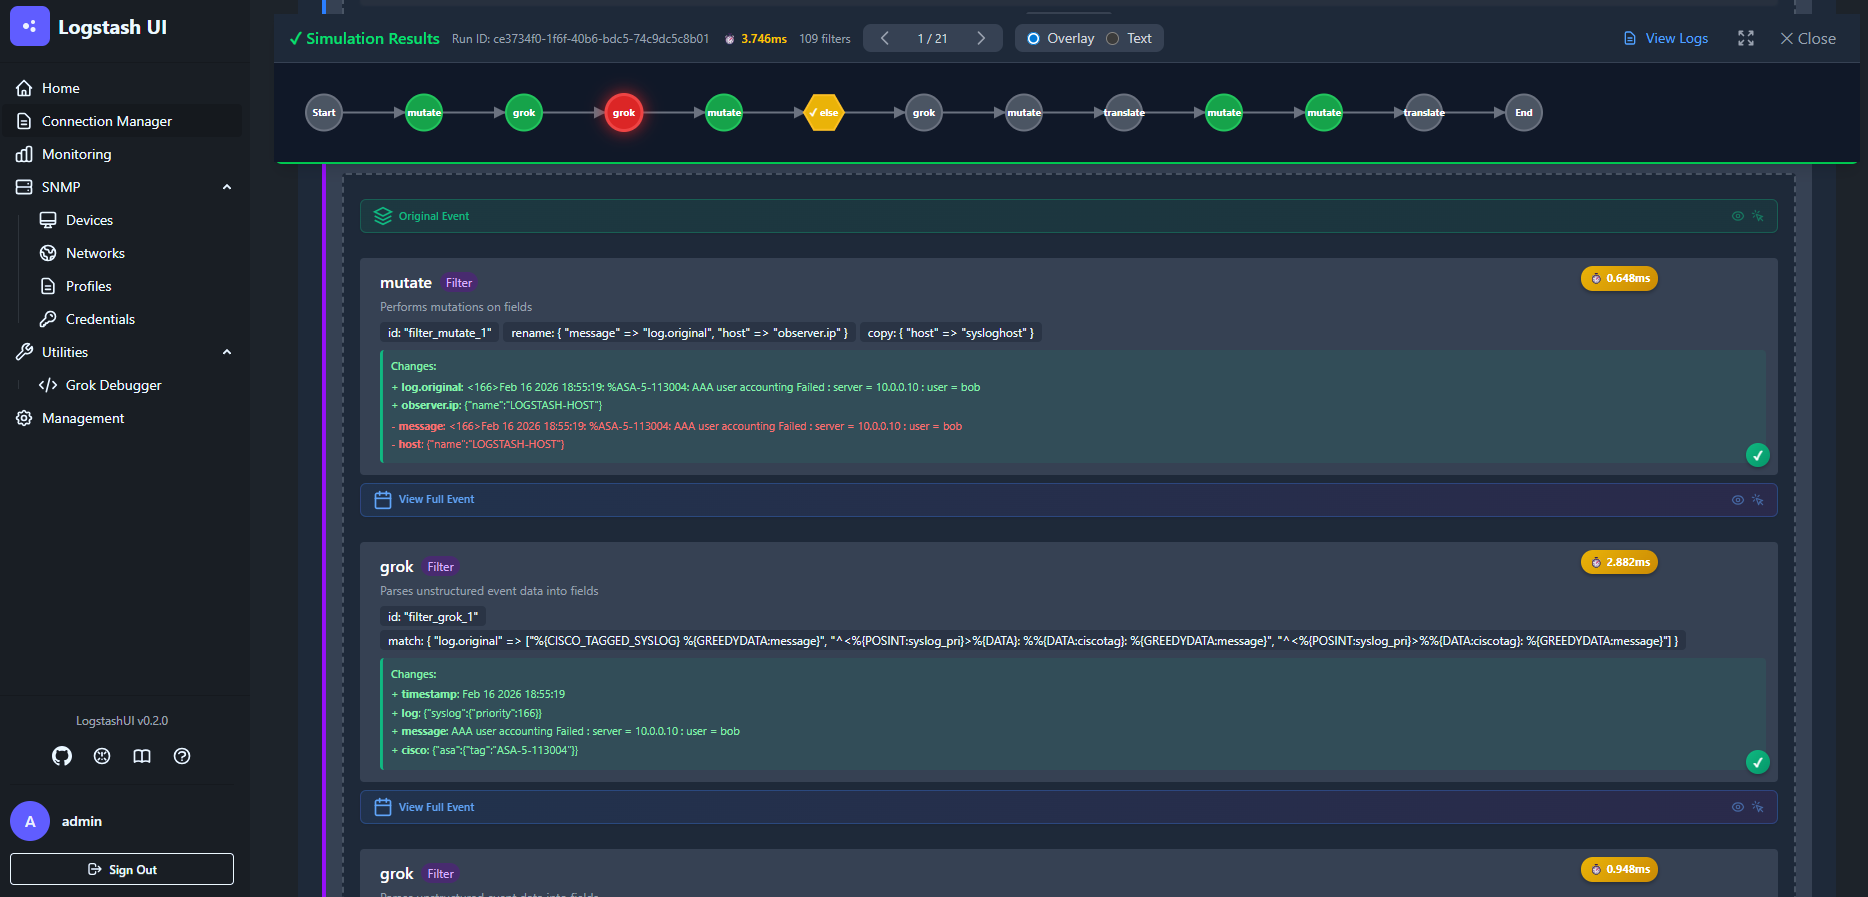
Overview
LogstashUI provides a visual interface for designing, testing, and operating Logstash pipelines.
Instead of editing configuration files manually, pipelines can be authored visually, simulated against sample events, and deployed to multiple Logstash nodes from a single interface.
Supported Platforms
Officially, if all other requirements are met, LogstashUI can run on any x86-64 or arm64 platform that can run Docker.
It should be noted that at this time, Windows cannot run LogstashUI natively via Python due to a lack of support. However, running via Docker in Windows is fully supported.
Features
Control Plane for Logstash — Centrally manage Logstash nodes with Centralized Pipeline Management and Logstash Agent

Visual Pipeline Editor — Author pipelines in three modes: an inline graphical interface, raw text editor, and a full visual graph for building pipelines by connecting nodes. Switch between modes seamlessly on any pipeline.

Pipeline Simulation — Execute pipelines against sample events and inspect transformations step-by-step

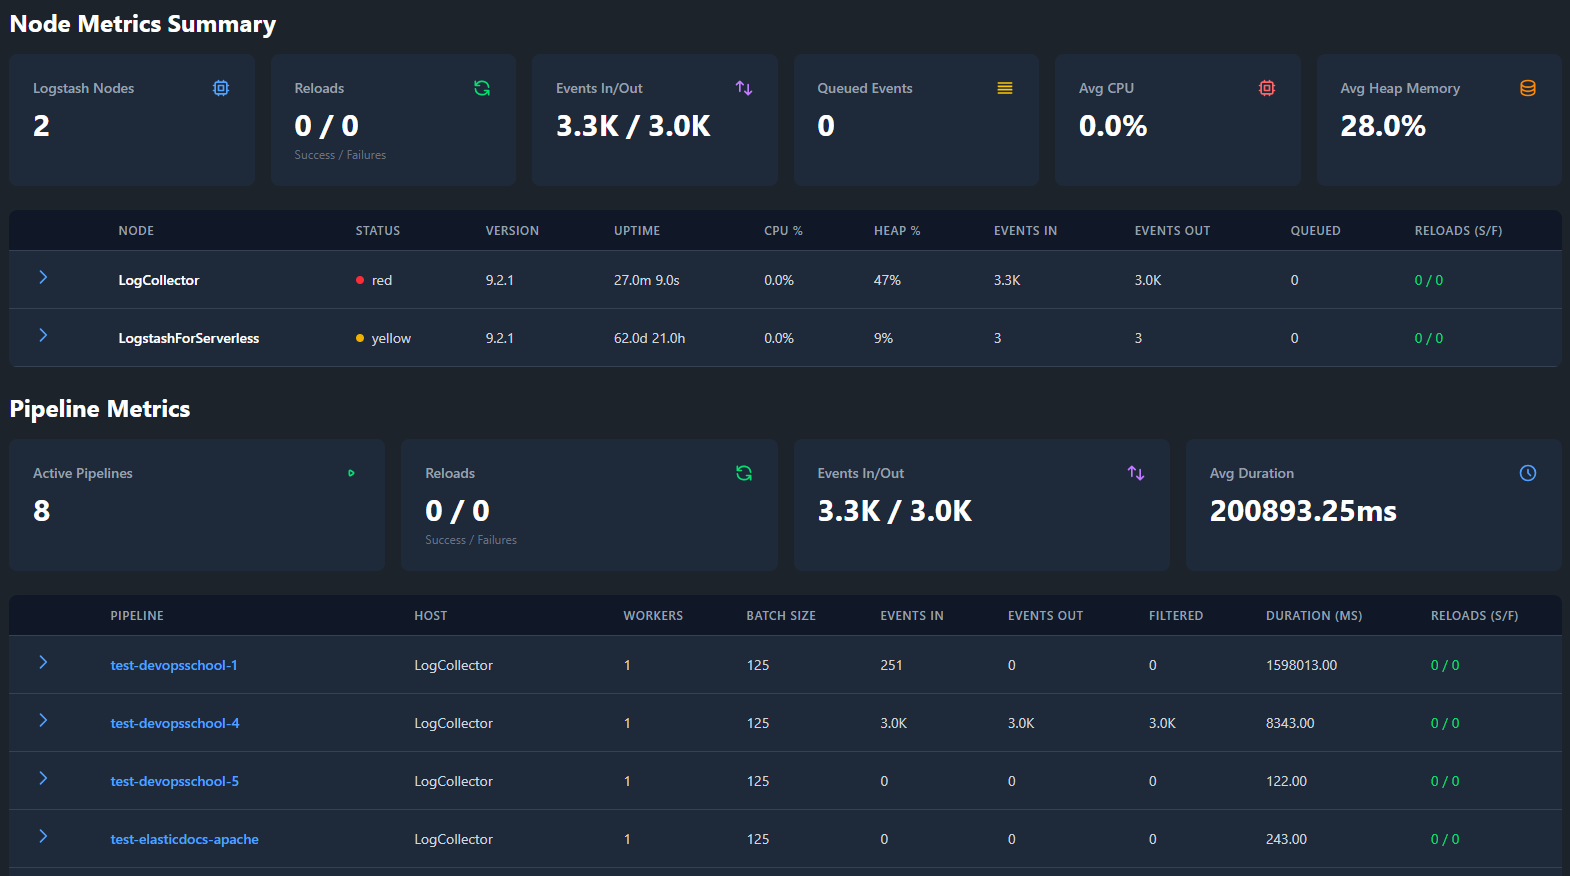
Monitoring — View metrics and performance for running pipelines and Logstash nodes

SNMP Pipeline Management — Configure polling, traps, discovery, credentials, devices, networks, and profiles through the UI.

Documentation
- Architecture - System architecture and component overview
- LogstashUI Documentation - Installation, configuration, and usage guides for LogstashUI
- SNMP Monitoring - Network monitoring with polling, traps, and discovery
- LogstashAgent Documentation - Setup and configuration for LogstashAgent
Requirements
System Requirements
Start with 8 GB RAM and 4 vCPUs. See the Deployment Recommendations for more details.
How to Deploy
The Deployment Guide covers the ways you can deploy LogstashUI — the standard Docker install, host-backed simulation, and running from source.
If you have internet access and can use Docker and GitHub, the standard install is below in the Quick Start section.
Quick Start - Embedded Mode
[!TIP] For heavy simulation, prefer enrolled simulate agents (isolated
simulate-Ninstances).start_logstashui.sh --legacy-host-agentis a legacy local path.
Download LogstashUI
git clone https://github.com/elastic/LogstashUI.git
cd LogstashUI/bin
Run LogstashUI
Linux
./start_logstashui.sh
Windows
start_logstashui.bat
Once the containers are running, navigate to your host in your browser:
https://<your_server_ip_or_hostname>:8443
And that's it!
Add Your First Connection
1. Create an initial user

2. Add a connection
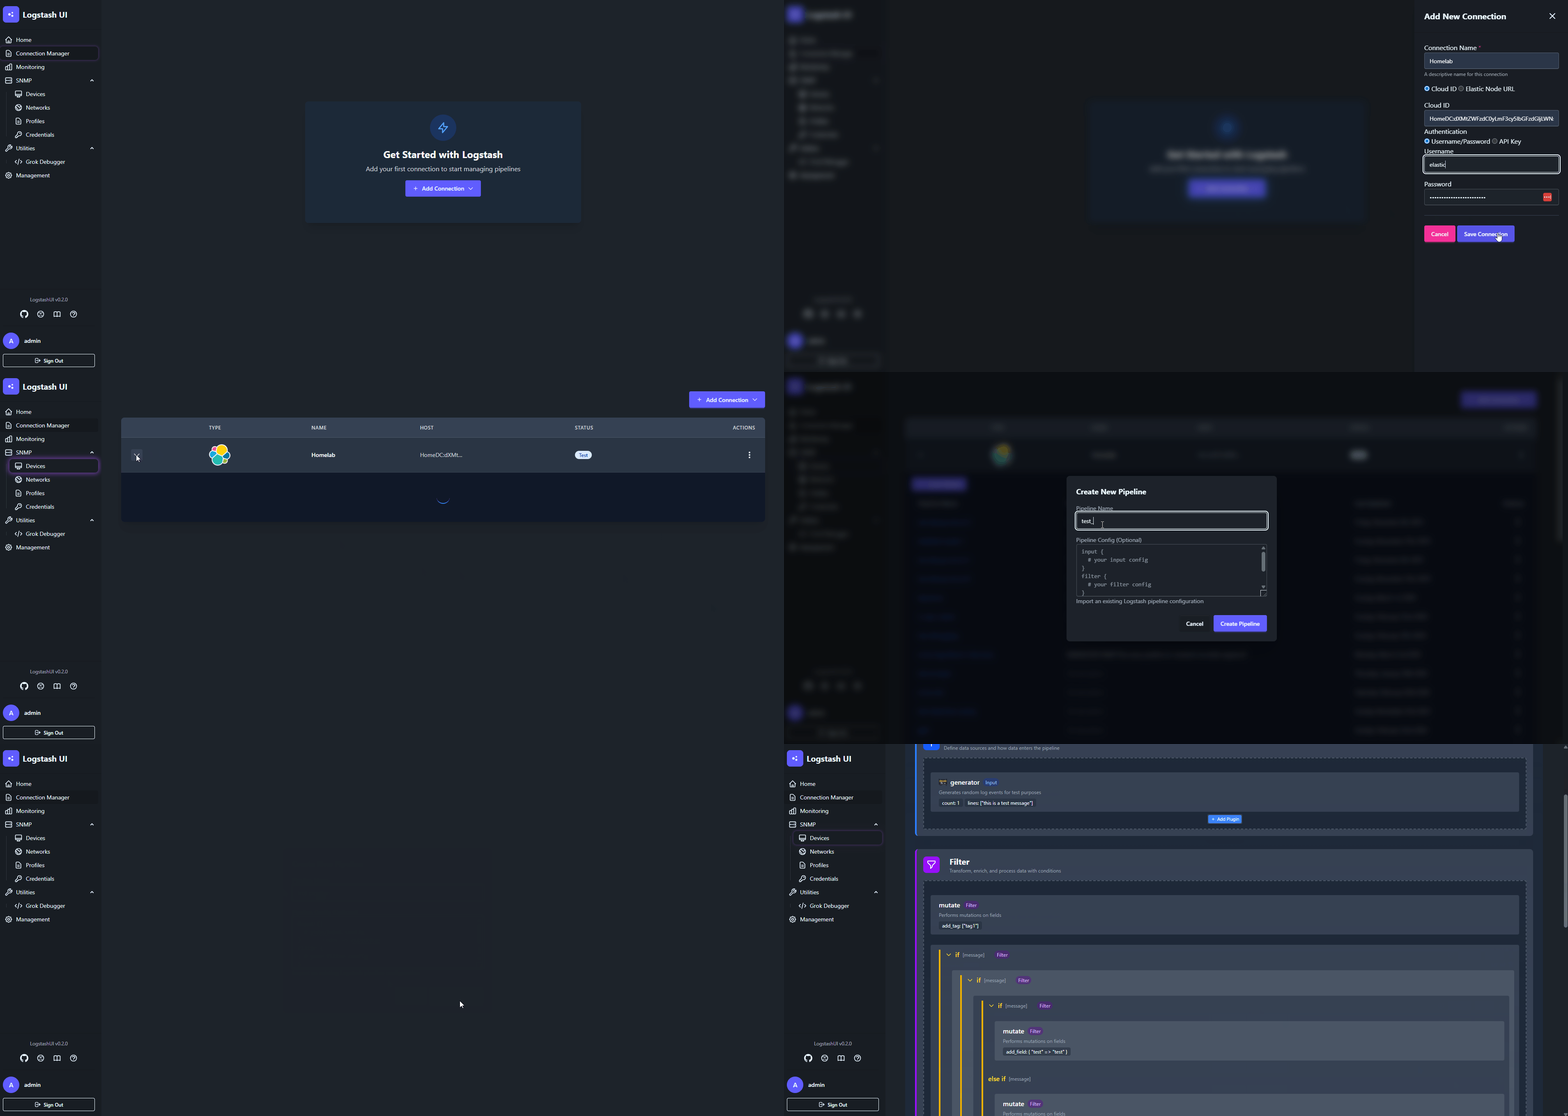
3. Start managing pipelines!
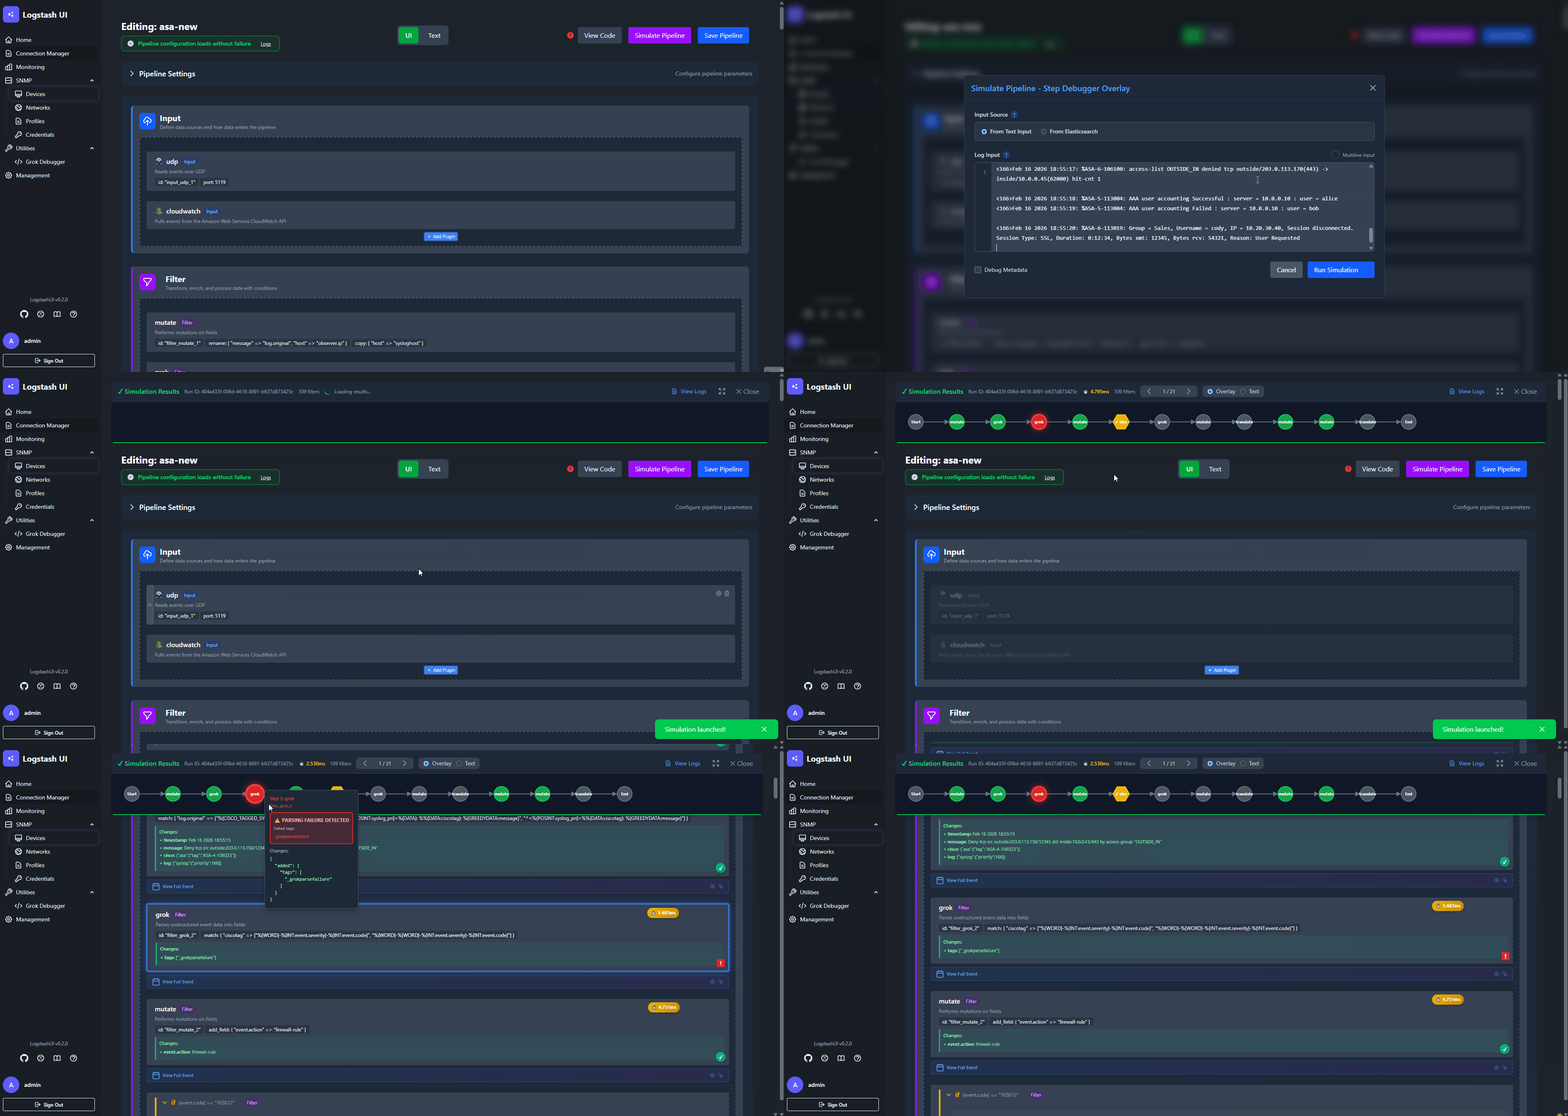
Optional: Add monitoring to your connections:
Use this guide to set up the Elastic Agent's Logstash integration. Once Logstash monitoring data is indexed into Elasticsearch, metrics and logs will appear in the UI.
Updating
LogstashUI will notify you when a new version is available via a banner in the navigation sidebar.
To update LogstashUI to the latest version:
[!WARNING]
--updateswitches the repository to themainbranch before pulling the latest code and images.
Linux
cd LogstashUI/bin
./start_logstashui.sh --update
Windows
cd LogstashUI\bin
start_logstashui.bat --update
Limitations
- Comments inside plugin blocks (inline and standalone) are preserved through parsing and serialization, but their exact position relative to config keys is not guaranteed. All comments are grouped at the top of the plugin block in the output.
input {
    udp { # inline comments are moved
        port => 5119 # inline comments are moved
    }
}
Becomes:
input {
    udp {
        # inline comments are moved
        # inline comments are moved
        port => 5119
    }
}
Support
LogstashUI is an open source project. The configuration and pipelines artifacts it generates are supported by Elastic. If you have a problem using LogstashUI, need help, find a bug or issue with the UI or Agent, those should be reported via GitHub and not to Elastic support.
Reporting Issues
Found a bug or have a feature request? Open an issue.
Contributing
Contributions are welcome!
Please open an issue to discuss large changes before submitting a pull request.
License
Copyright 2024–2026 Elasticsearch and contributors.
Licensed under the Elastic License 2.0 (ELv2). See LICENSE for details.