
dhaitz/mplcyberpunk
dhaitz/mplcyberpunk has 1,847 GitHub stars and 79 forks. GitHot measured 0 stars in 24 hours and 0 in 7 days. Last checked 2026-11-09 00:18 UTC. Last push 2025-08-06.
"Cyberpunk style" for matplotlib plots
Measured star growth
- in 24h
- 0
- in 7 days
- 0
- in 15 days
- Collecting history
- in 1 month
- Collecting history
Net star changes over overlapping periods, not daily totals. Missing measurements are left blank. Stars measure attention, not software quality.
README.md
Originalmplcyberpunk


A Python package on top of matplotlib to create 'cyberpunk' style plots with 3 additional lines of code.
Installation
pip install mplcyberpunk
Usage
After importing the package, the cyberpunk stylesheet (dark background etc.) is available via plt.style.use.
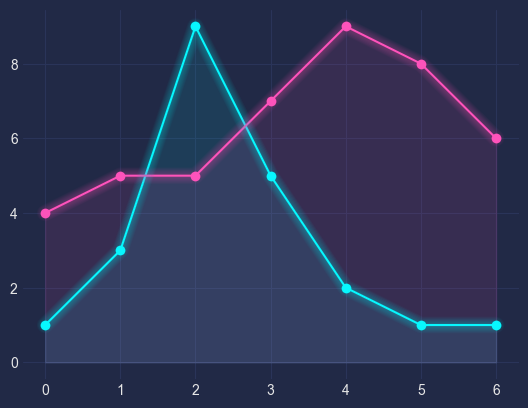
The line glow and 'underglow' effects are added via calling add_glow_effects:
import matplotlib.pyplot as plt
import mplcyberpunk

plt.style.use("cyberpunk")

plt.plot([1, 3, 9, 5, 2, 1, 1], marker='o')
plt.plot([4, 5, 5, 7, 9, 8, 6], marker='o')

mplcyberpunk.add_glow_effects()

plt.show()
Result:
This effect is currently only implemented for lines.
The individual steps are described here in more detail.
Add effects individually
Instead of add_glow_effects, you can add the line glow and underglow effects separately:
mplcyberpunk.make_lines_glow()
mplcyberpunk.add_underglow()
You can also add the effect to a specific axis object explicitly:
fig, ax = plt.subplots()
...
mplcyberpunk.make_lines_glow(ax)
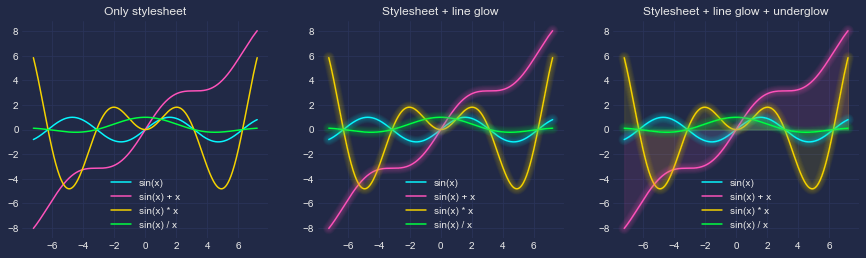
To activate the glow effect only for specific lines, pass a Line2D object or a list of Line2Ds to make_lines_glow.
Gradient glow
Gradient underglow effect can be added with
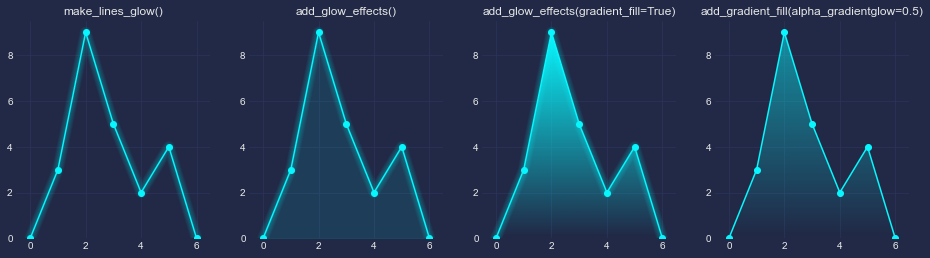
mplcyberpunk.add_glow_effects(gradient_fill=True)
or independently of line glow with
mplcyberpunk.add_gradient_fill(alpha_gradientglow=0.5)
add_gradient_fill takes a gradient_start argument for different gradient starting values:
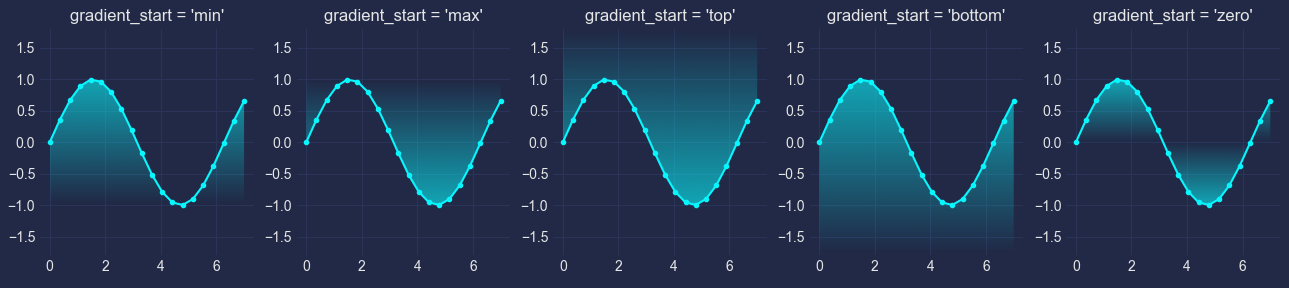
Different glow configurations:
Scatter plots
Glow effect can be added to scatter plots via mplcyberpunk.make_scatter_glow():
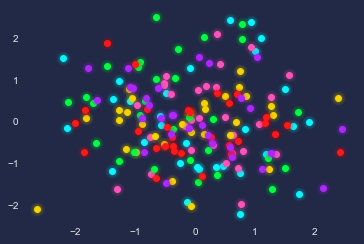
Colormap
The default colormap is cool:
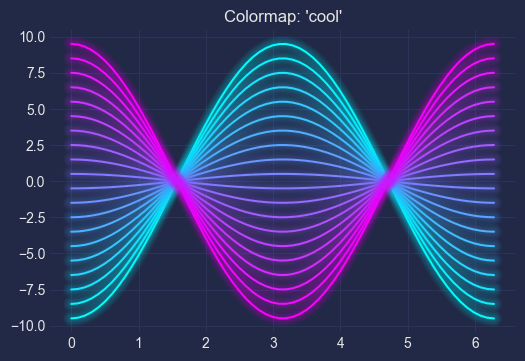
Others:

Bar charts
import matplotlib.pyplot as plt
import mplcyberpunk

plt.style.use('cyberpunk')

categories = ['A', 'B', 'C', 'D', 'E']
values = [25, 67, 19, 45, 10]
colors = ["C0", "C1", "C2", "C3", "C4"]

bars = plt.bar(categories, values, color=colors, zorder=2)

mplcyberpunk.add_bar_gradient(bars=bars)

plt.show()
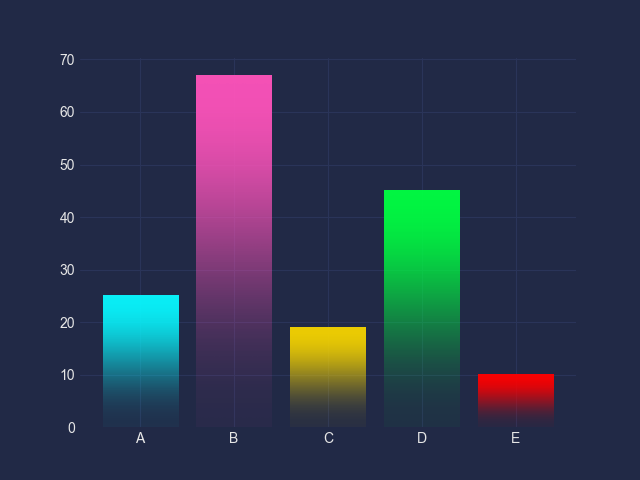
Gallery
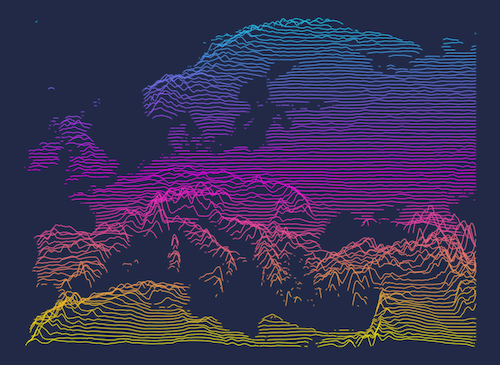
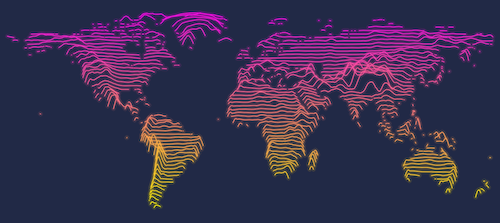
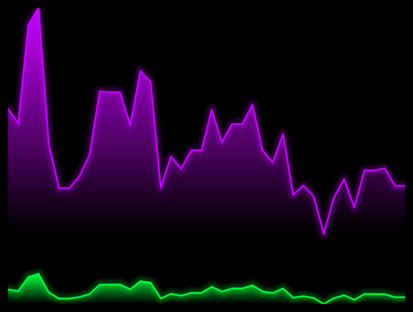
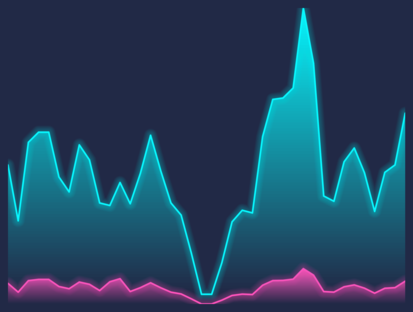
Some images can be bought as posters here.
Explore related projects
codecrafters-io/build-your-own-x
Master programming by recreating your favorite technologies from scratch.
561,210 starspublic-apis/public-apis
A collective list of free APIs
497,425 starsmorluto/rea
Reverse engineer anything with agents, from app behavior down to native binaries.
445,356 starsopenclaw/openclaw
The AI that really does things. Any OS. Any Platform. The lobster way. 🦞
394,225 stars