
debezium/debezium-platform
debezium/debezium-platform has 55 GitHub stars and 46 forks. GitHot measured 0 stars in 24 hours. Last checked 2026-11-15 08:52 UTC. Last push 2026-11-10.
Measured star growth
- in 24h
- 0
- in 7 days
- Collecting history
- in 15 days
- Collecting history
- in 1 month
- Collecting history
Net star changes over overlapping periods, not daily totals. Missing measurements are left blank. Stars measure attention, not software quality.
About
An opinionated data-centric view of Debezium components. Please log issues at https://github.com/debezium/dbz/issues.
DataREADME.md
OriginalDebezium Management Platform
Debezium Management Platform (Debezium Orchestra) aims to provide means to simplify the deployment of Debezium to various environments in highly opinionated manner. The goal is not to provide total control over environment specific configuration. To achieve this goal the platform uses a data-centric view on Debezium components.
Disclaimer: This project is still in early development stage and should not be used in production.
Platform Architecture
The platform is composed of the following main components:
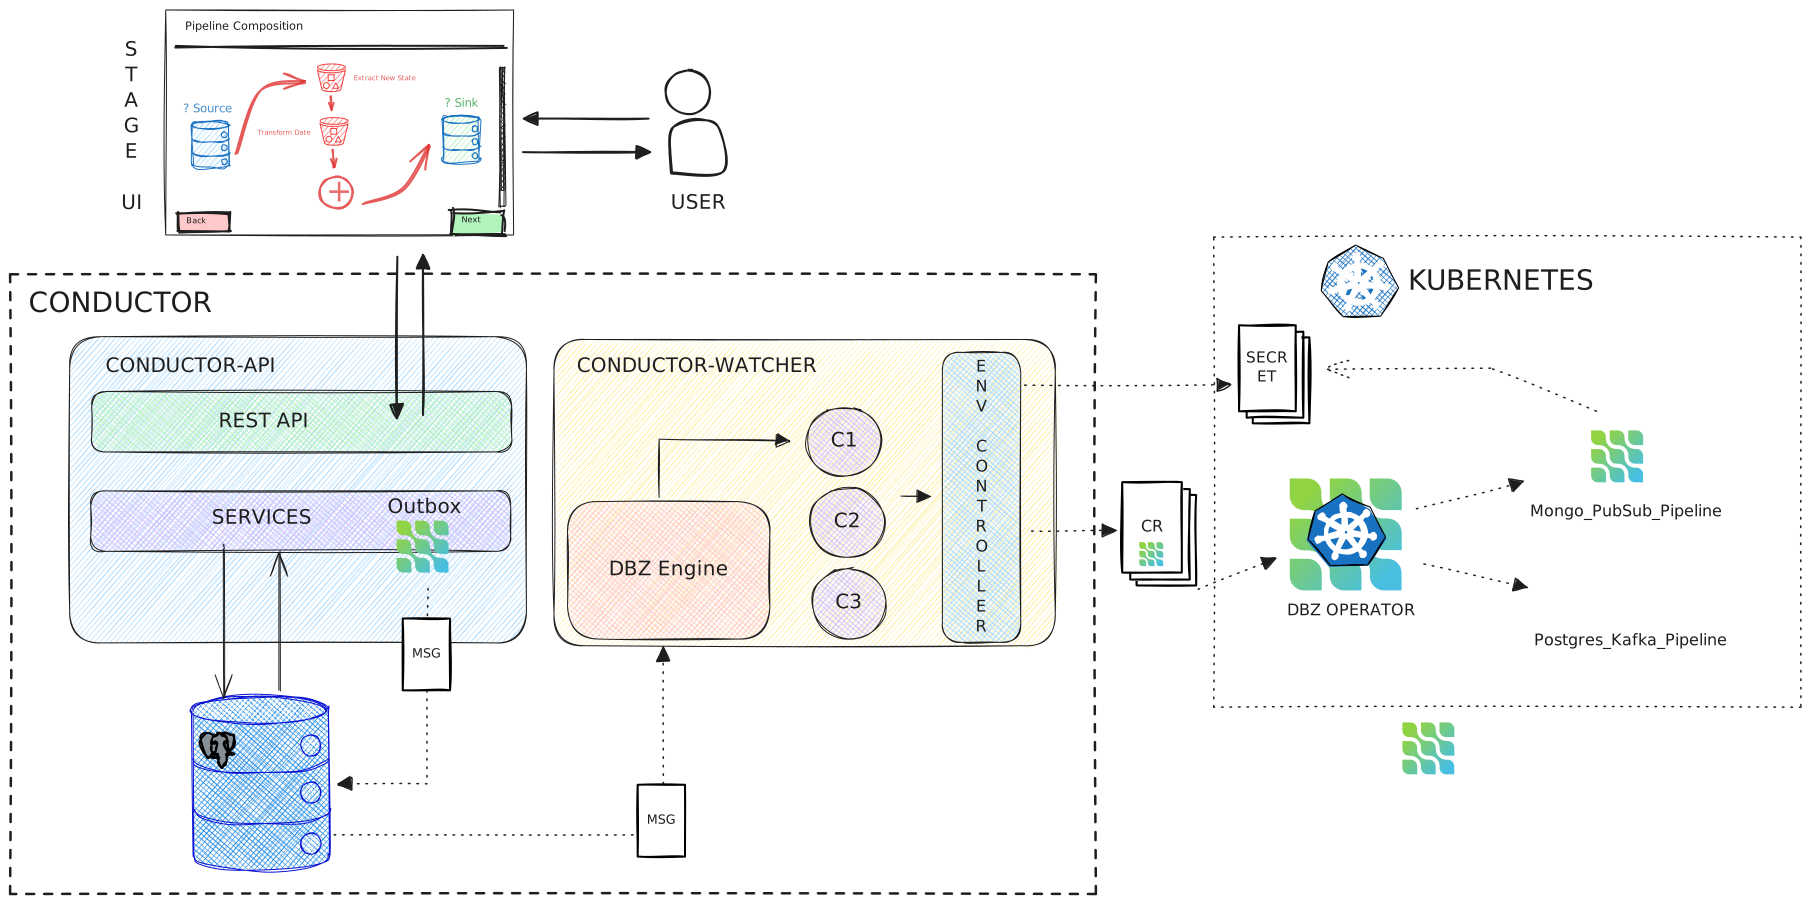
- Conductor: The back-end component which provides a set of APIs to orchestrate and control Debezium deployments.
- Stage: The front-end component which provides a user interface to interact with the Conductor.
- Monitoring: Built-in pipeline monitoring powered by OpenTelemetry and Prometheus. Debezium Server instances export metrics via OpenTelemetry to an OTel Collector, which exposes them to Prometheus.
Conductor Architecture
The conductor component itself is composed of several subcomponents:
- API Server: The main entry point for the platform. It provides a set of APIs to interact with the platform.
- Watcher: Component responsible for the actual communication with deployment environment (e.g. Debezium Operator in K8s cluster).
Installation
You can install the platform through helm chart. For instructions refer to the README
Run the example
If you don't have already a Kubernetes cluster up, you can use one of the commons tools to have a local K8s cluster
If you are using kind locally, expose ports 80 and 443 on the control-plane node so the ingress can be reached from your host:
kind: Cluster
apiVersion: kind.x-k8s.io/v1alpha4
nodes:
- role: control-plane
  extraPortMappings:
    - containerPort: 80
      hostPort: 80
      listenAddress: "127.0.0.1"
      protocol: TCP
    - containerPort: 443
      hostPort: 443
      listenAddress: "127.0.0.1"
      protocol: TCP
kind create cluster --config kind-ingress.yaml
The prerequisite is to install an ingress controller.
For example, on kind you can install ingress-nginx with:
helm upgrade --install ingress-nginx ingress-nginx \
  --repo https://kubernetes.github.io/ingress-nginx \
  --namespace ingress-nginx \
  --create-namespace \
  --set controller.hostPort.enabled=true
For this example, considering a local setup, we will use the /etc/hosts to resolve the domain.
The following script will map the K8s IP to the specified domain into the /etc/hosts.
export DEBEZIUM_PLATFORM_DOMAIN=platform.debezium.io
sudo ./examples/update_hosts.sh
NOTE: If you are using minikube on Mac, you need also to run the
minikube tunnelcommand. For more details see this and this.
NOTE: If you are using Windows, add
127.0.0.1 platform.debezium.iotoC:\Windows\System32\drivers\etc\hosts.
Install the OpenTelemetry Operator for pipeline monitoring:
helm repo add open-telemetry https://open-telemetry.github.io/opentelemetry-helm-charts
helm install opentelemetry-operator open-telemetry/opentelemetry-operator \
  -n opentelemetry-operator-system --create-namespace \
  --set admissionWebhooks.certManager.enabled=false \
  --set admissionWebhooks.autoGenerateCert.enabled=true
NOTE: The above command uses Helm auto-generated self-signed certificates for the operator webhooks, which is suitable for development but not for production (certificates expire after 365 days without auto-renewal). For production environments, use a proper certificate management solution such as cert-manager or provide your own certificates. See the OTel Operator Helm chart documentation for all available options.
Install the Prometheus Operator for metrics scraping:
helm repo add prometheus-community https://prometheus-community.github.io/helm-charts
helm install kube-prometheus-stack prometheus-community/kube-prometheus-stack -n monitoring --create-namespace
When monitoring is enabled, configure the Prometheus URL in your values file so the conductor can query metrics:
monitoring:
  otel:
    enabled: true
  prometheus:
    url: "http://kube-prometheus-stack-prometheus.monitoring.svc.cluster.local:9090"
Create a dedicated namespace
kubectl create ns debezium-platform
and then install debezium-platform through helm
cd helm &&
helm dependency build &&
helm install debezium-platform . -n debezium-platform -f ../examples/example.yaml &&
cd ..
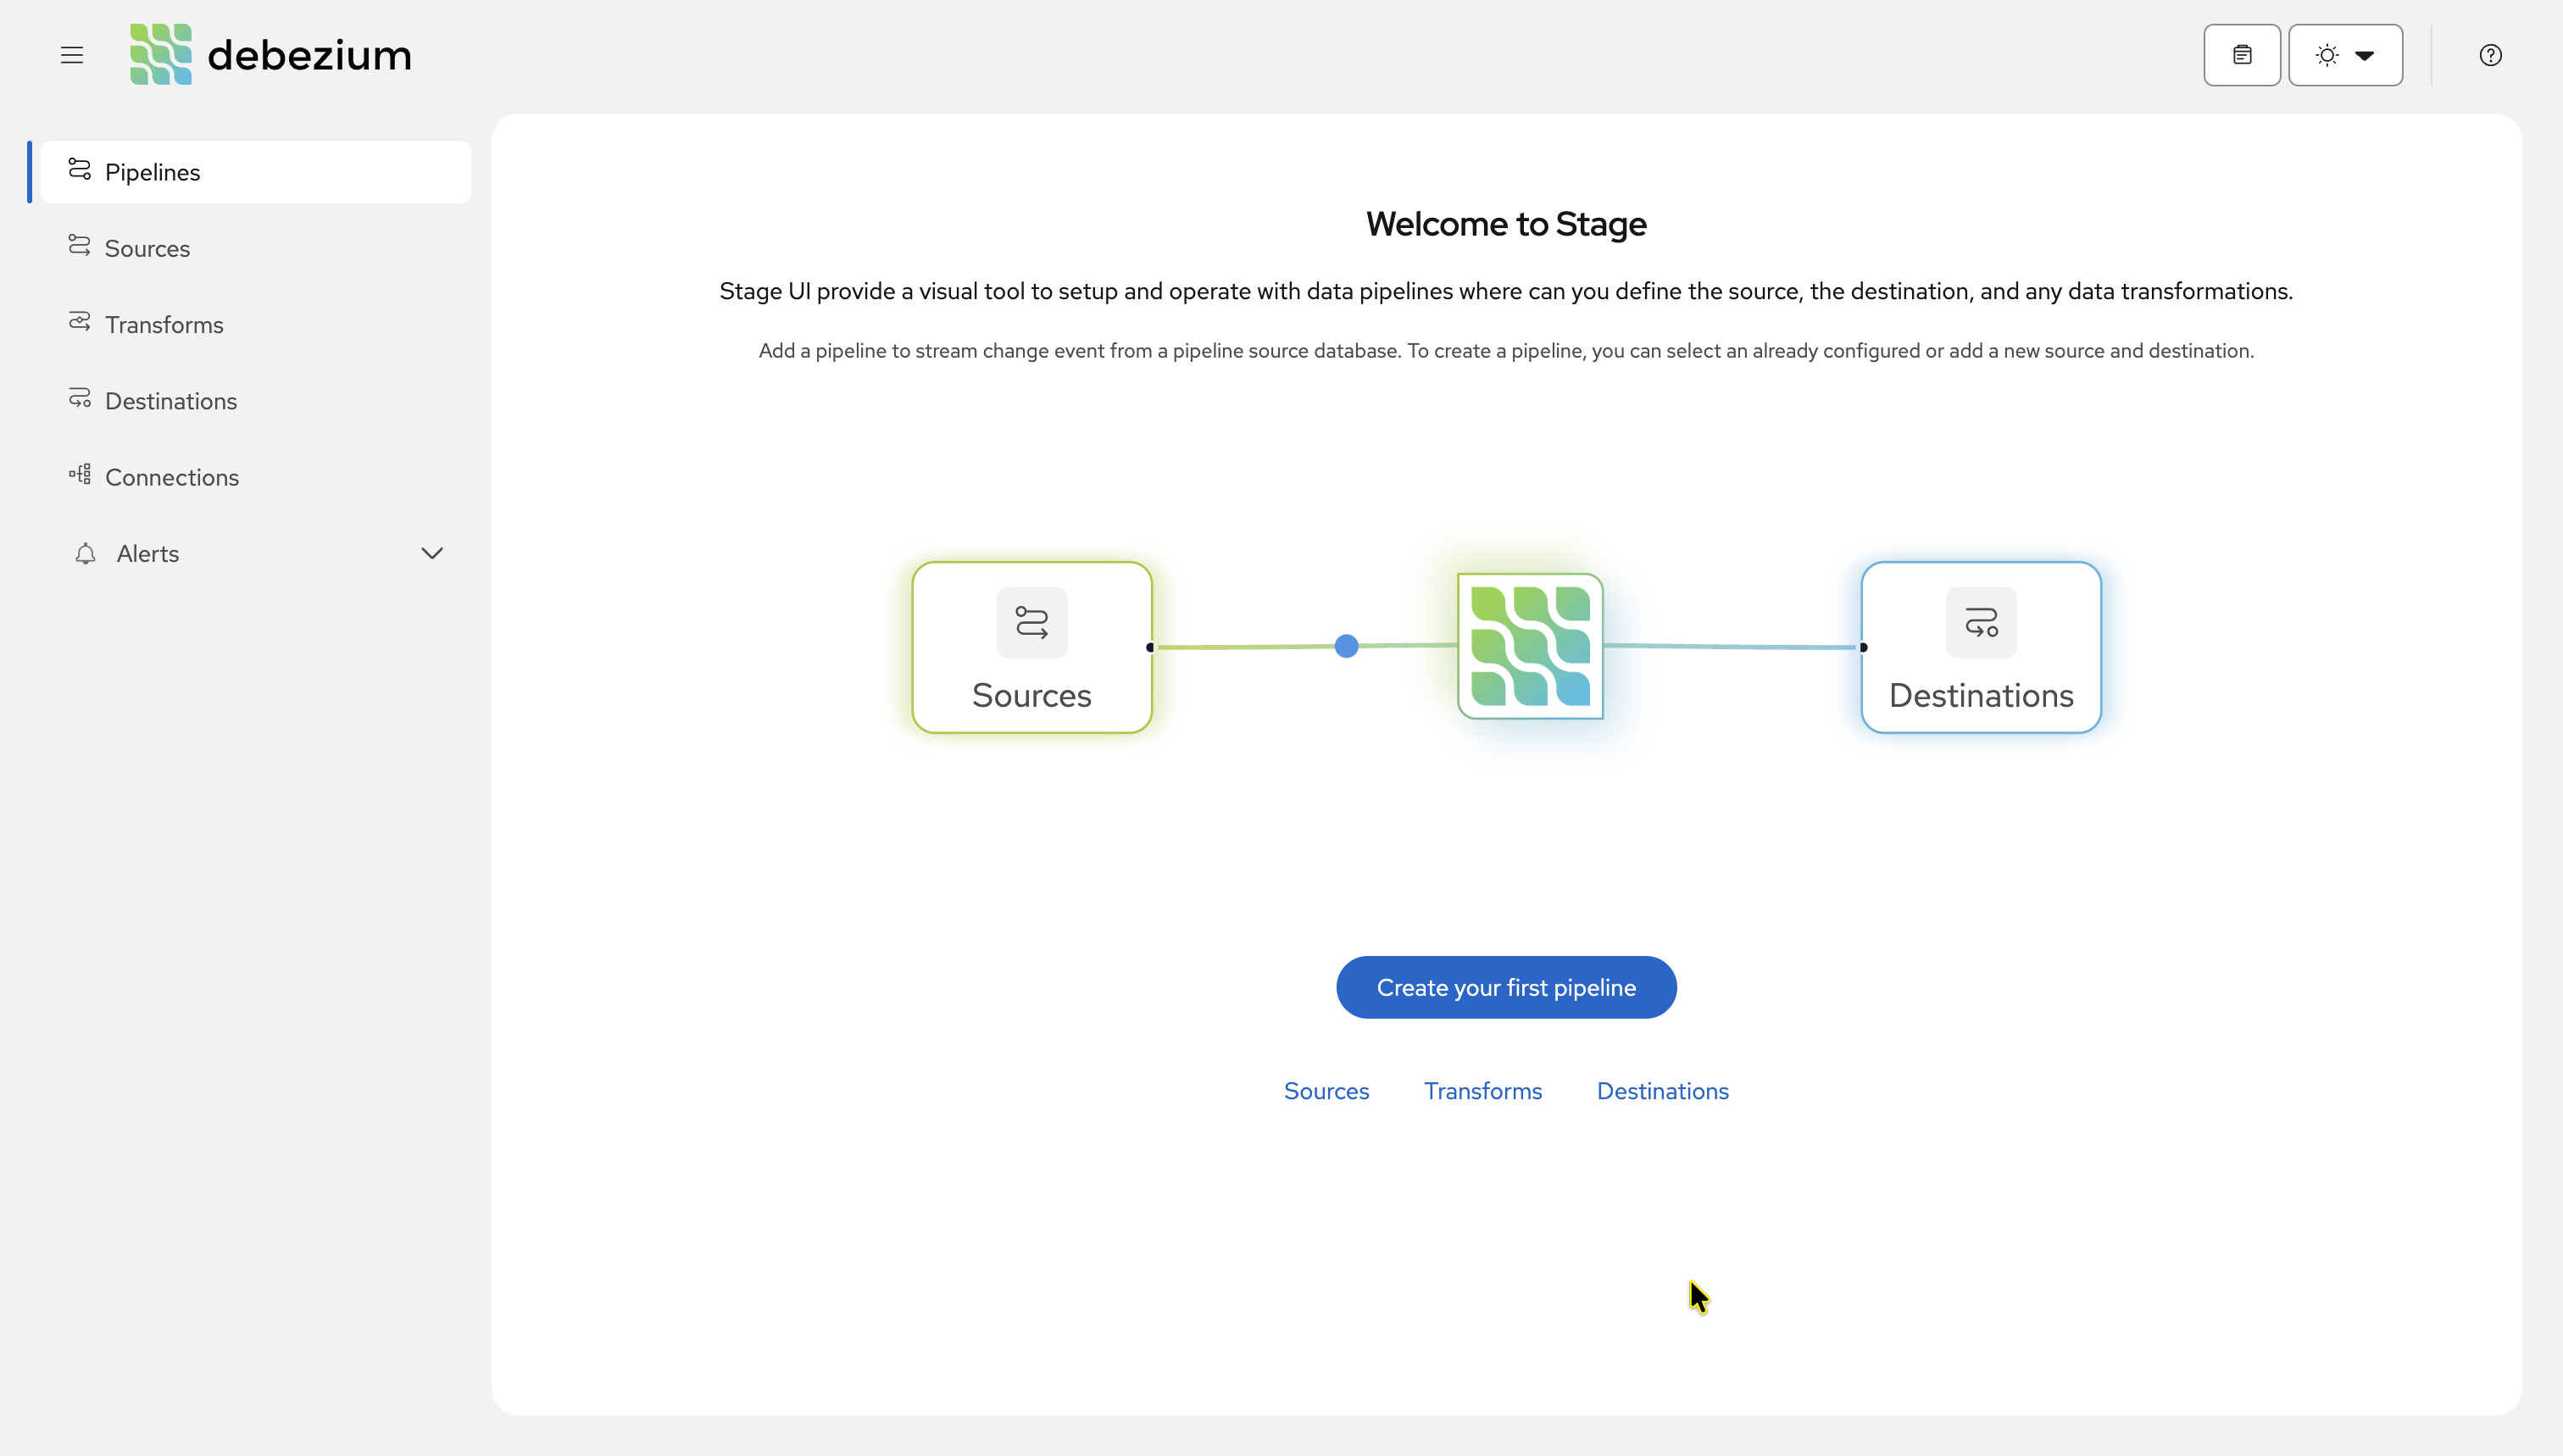
after all pods are running you should access the platform UI from http://platform.debezium.io/
Platform UI
To finish the example we will create a PostgreSQL, that will be used as source database, and a kafka cluster, used as destination in our example pipeline.
# Deploy the source database

kubectl create -n debezium-platform -f examples/k8s/database/001_postgresql.yml
Install the Strimzi operator
helm repo add strimzi https://strimzi.io/charts/ &&
helm repo update strimzi &&
helm install strimzi-operator strimzi/strimzi-kafka-operator --version 0.45.1 --namespace debezium-platform
# Deploy the kafka cluster

kubectl create -n debezium-platform -f examples/k8s/kafka/001_kafka.yml
# Create a test pipeline
#
# The script uses the `http` command from HTTPie.

./examples/seed.sh platform.debezium.io 80 examples/payloads/
And that's all. You should have a test pipeline configured to move data from PostgreSQL to Kakfa.