
datajoint/datajoint-python
datajoint/datajoint-python has 198 GitHub stars and 103 forks. GitHot measured 0 stars in 24 hours, +1 in 7 days, and +1 in 15 days. Last checked 2026-11-11 11:59 UTC. Last push 2026-11-05.
Relational Workflows: where database schemas define executable data pipelines.
Measured star growth
- in 24h
- 0
- in 7 days
- +1
- in 15 days
- +1
- in 1 month
- Collecting history
Net star changes over overlapping periods, not daily totals. Missing measurements are left blank. Stars measure attention, not software quality.
README.md
OriginalDataJoint Library for Python
The DataJoint Library is a framework for scientific data pipelines based on the Relational Workflow Model — a paradigm where your database schema is an executable specification of your workflow.
- Tables represent workflow steps — Each table is a step in your pipeline
- Foreign keys encode dependencies — Parent tables must be populated before child tables
- Computations are declarative — Define what to compute; DataJoint handles when
- Results are immutable — Full lineage and reproducibility
Documentation: https://docs.datajoint.com
📘 Upgrading from legacy DataJoint (pre-2.0)? See the Migration Guide for a step-by-step upgrade path.
| PyPI |

|
Conda |

|
Tests |

|
| License |

|
Citation |

|
Coverage |

|
Installation
pip install datajoint
or with Conda:
conda install -c conda-forge datajoint
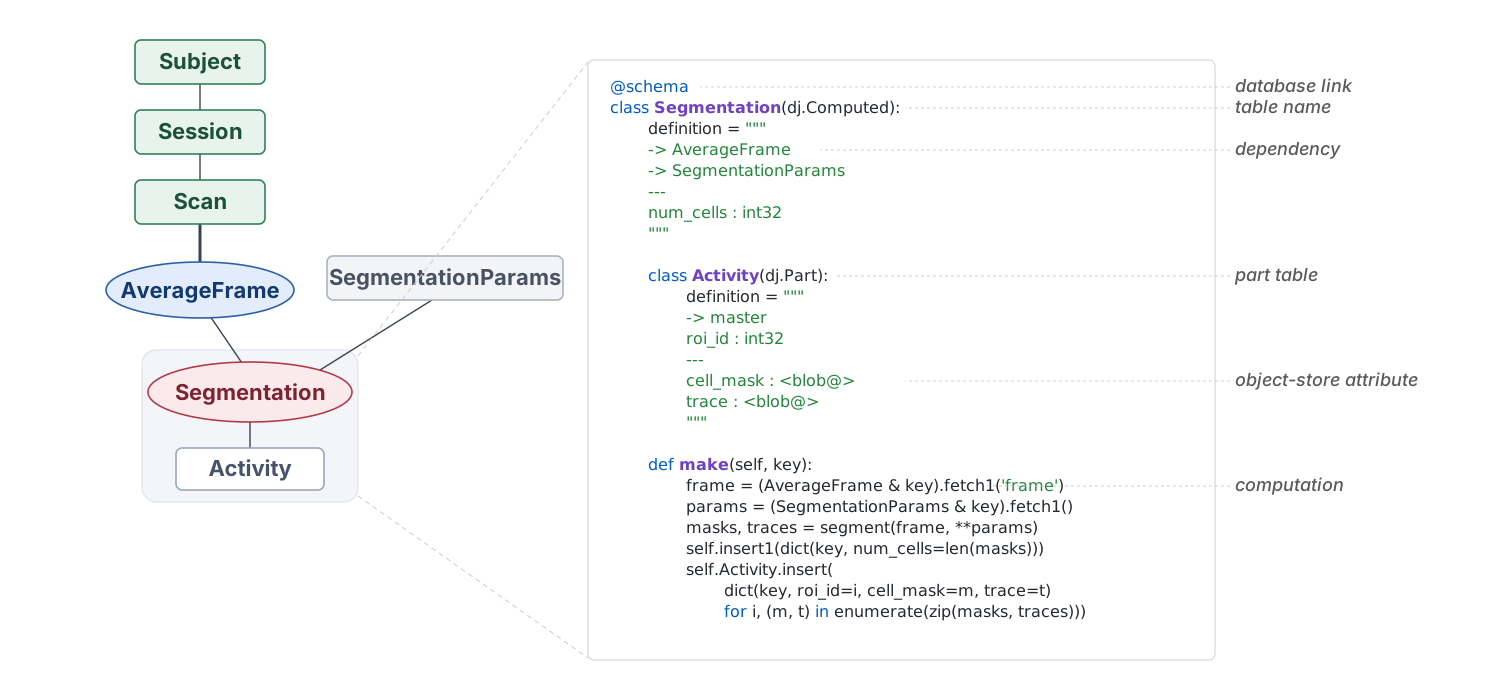
Example Pipeline
Cite DataJoint: Yatsenko et al., 2026 — RRID: SCR_014543
Resources
- Documentation — Complete guides and reference
- Tutorials — Learn by example
- How-To Guides — Task-oriented guides
- API Reference — Complete API documentation
- Migration Guide — Upgrade from legacy versions
- DataJoint Elements — Example pipelines for neuroscience
- GitHub Discussions — Community support
Contributing
See CONTRIBUTING.md for development setup and guidelines.
Explore related projects
Asabeneh/30-Days-Of-Python
The 30 Days of Python programming challenge is a step-by-step guide to learn the Python programming language in 30 days. This challenge may take more than 100 days. Follow your own pace. These videos may help too: https://www.youtube.com/channel/UC7PNRuno1rzYPb1xLa4yktw
78,560 starsgrafana/grafana
The open and composable observability and data visualization platform. Visualize metrics, logs, and traces from multiple sources like Prometheus, Loki, Elasticsearch, InfluxDB, Postgres and many more.
77,830 starsredis/redis
For developers, who are building real-time data-driven applications, Redis is the preferred, fastest, and most feature-rich cache, data structure server, and document and vector query engine.
77,395 starsapache/superset
Apache Superset is a Data Visualization and Data Exploration Platform
75,473 stars