
dagster-io/dagster
dagster-io/dagster has 16,379 GitHub stars and 2,406 forks. GitHot measured +2 stars in 24 hours, +15 in 7 days, and +56 in 15 days. Last checked 2026-11-09 13:53 UTC. Last push 2026-11-04.
An orchestration platform for the development, production, and observation of data assets.
Measured star growth
- in 24h
- +2
- in 7 days
- +15
- in 15 days
- +56
- in 1 month
- Update delayed
Net star changes over overlapping periods, not daily totals. Missing measurements are left blank. Stars measure attention, not software quality.
README.md
Original


Dagster is a cloud-native data pipeline orchestrator for the whole development lifecycle, with integrated lineage and observability, a declarative programming model, and best-in-class testability.
It is designed for developing and maintaining data assets, such as tables, data sets, machine learning models, and reports.
With Dagster, you declare—as Python functions—the data assets that you want to build. Dagster then helps you run your functions at the right time and keep your assets up-to-date.
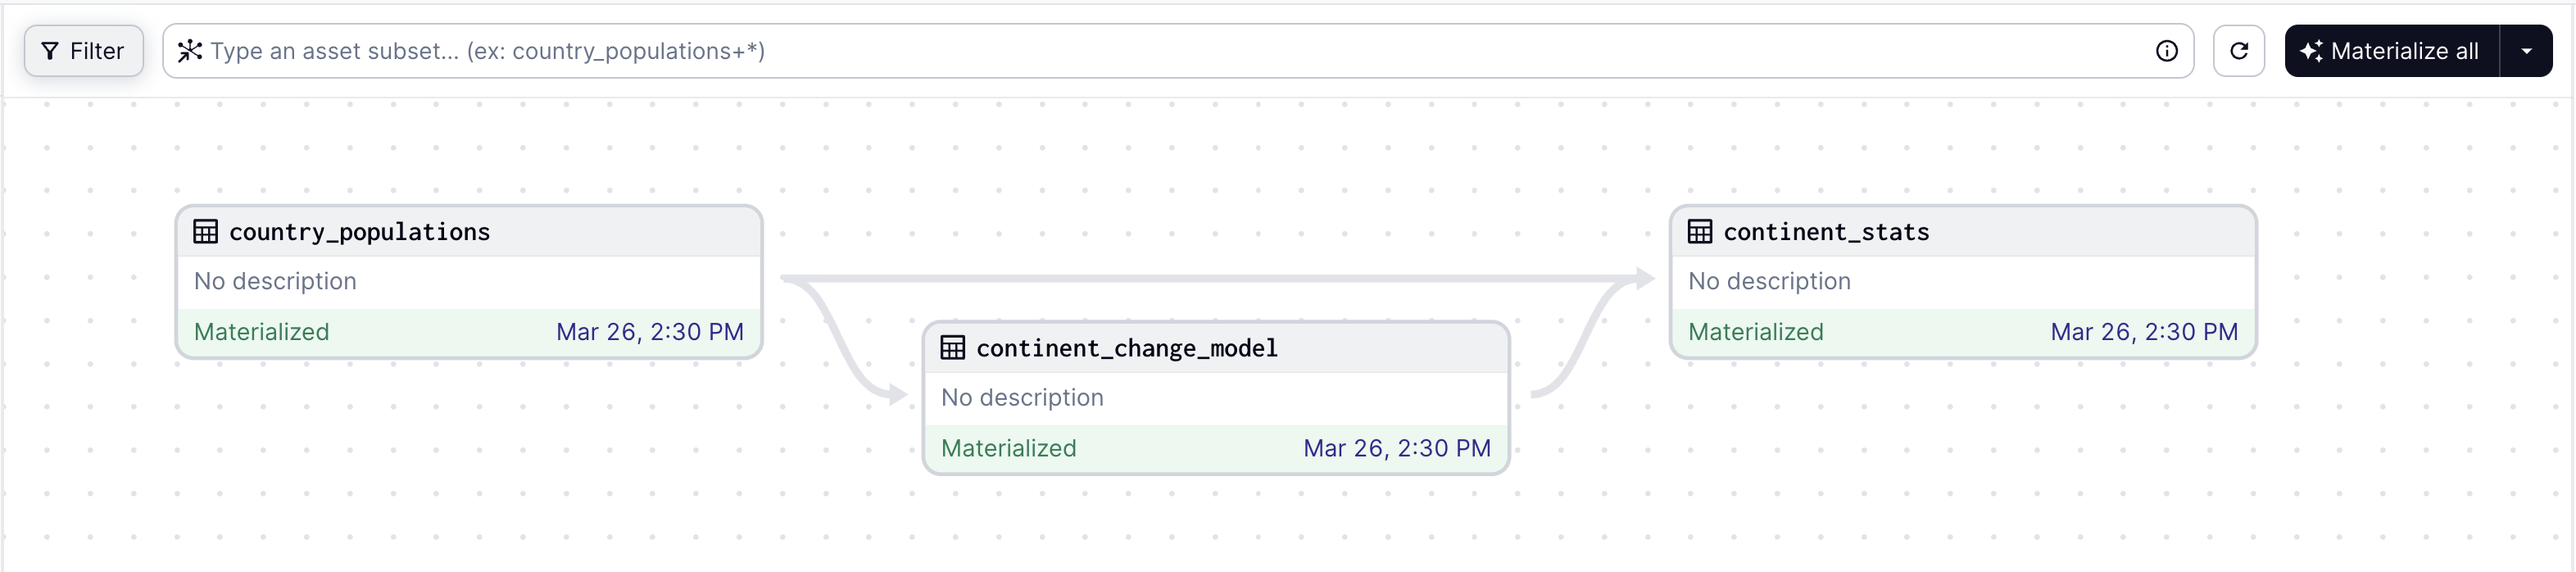
Here is an example of a graph of three assets defined in Python:
import dagster as dg
import pandas as pd

from sklearn.linear_model import LinearRegression


@dg.asset
def country_populations() -> pd.DataFrame:
    df = pd.read_html("https://tinyurl.com/mry64ebh")[0]
    df.columns = ["country", "pop2022", "pop2023", "change", "continent", "region"]
    df["change"] = df["change"].str.rstrip("%").astype("float")
    return df


@dg.asset
def continent_change_model(country_populations: pd.DataFrame) -> LinearRegression:
    data = country_populations.dropna(subset=["change"])
    return LinearRegression().fit(pd.get_dummies(data[["continent"]]), data["change"])


@dg.asset
def continent_stats(
    country_populations: pd.DataFrame, continent_change_model: LinearRegression
) -> pd.DataFrame:
    result = country_populations.groupby("continent").sum()
    result["pop_change_factor"] = continent_change_model.coef_
    return result
The graph loaded into Dagster's web UI:
Dagster is built to be used at every stage of the data development lifecycle - local development, unit tests, integration tests, staging environments, all the way up to production.
Quick Start:
If you're new to Dagster, we recommend checking out the docs or following the hands-on tutorial.
Dagster is available on PyPI and officially supports Python 3.9 through Python 3.14.
uv add dagster dagster-webserver dagster-dg-cli
Documentation
You can find the full Dagster documentation here, including the Quickstart guide.
Key Features:

Dagster as a productivity platform
Identify the key assets you need to create using a declarative approach, or you can focus on running basic tasks. Embrace CI/CD best practices from the get-go: build reusable components, spot data quality issues, and flag bugs early.
Dagster as a robust orchestration engine
Put your pipelines into production with a robust multi-tenant, multi-tool engine that scales technically and organizationally.
Dagster as a unified control plane
Maintain control over your data as the complexity scales. Centralize your metadata in one tool with built-in observability, diagnostics, cataloging, and lineage. Spot any issues and identify performance improvement opportunities.
Master the Modern Data Stack with integrations
Dagster provides a growing library of integrations for today’s most popular data tools. Integrate with the tools you already use, and deploy to your infrastructure.

Community
Connect with thousands of other data practitioners building with Dagster. Share knowledge, get help, and contribute to the open-source project. To see featured material and upcoming events, check out our Dagster Community page.
Join our community here:
- 🌟 Star us on GitHub
- 📥 Subscribe to our Newsletter
- 🐦 Follow us on Twitter
- 🕴️ Follow us on LinkedIn
- 📺 Subscribe to our YouTube channel
- 📚 Read our blog posts
- 👋 Join us on Slack
- 🗃 Browse Slack archives
- ✏️ Start a GitHub Discussion
Contributing
For details on contributing or running the project for development, check out our contributing guide.
License
Dagster is Apache 2.0 licensed.
Explore related projects
Asabeneh/30-Days-Of-Python
The 30 Days of Python programming challenge is a step-by-step guide to learn the Python programming language in 30 days. This challenge may take more than 100 days. Follow your own pace. These videos may help too: https://www.youtube.com/channel/UC7PNRuno1rzYPb1xLa4yktw
78,486 starsgrafana/grafana
The open and composable observability and data visualization platform. Visualize metrics, logs, and traces from multiple sources like Prometheus, Loki, Elasticsearch, InfluxDB, Postgres and many more.
77,790 starsredis/redis
For developers, who are building real-time data-driven applications, Redis is the preferred, fastest, and most feature-rich cache, data structure server, and document and vector query engine.
77,332 starsapache/superset
Apache Superset is a Data Visualization and Data Exploration Platform
75,455 stars