
chvvkumar/Monitoring
chvvkumar/Monitoring has 647 GitHub stars and 58 forks. GitHot measured 0 stars in 24 hours. Last checked 2026-11-09 15:53 UTC. Last push 2022-03-28.
Monitor ESXi, Synology, Docker, PiHole and Raspberry Pi and Windows using Grafana, InfluxDB and Telegraf
Measured star growth
- in 24h
- 0
- in 7 days
- Collecting history
- in 15 days
- Collecting history
- in 1 month
- Collecting history
Net star changes over overlapping periods, not daily totals. Missing measurements are left blank. Stars measure attention, not software quality.
README.md
OriginalMonitor ESXi, Synology, Docker, PiHole, Plex and Raspberry Pi and Windows using Grafana, InfluxDB and Telegraf
Demo
Screenshots:
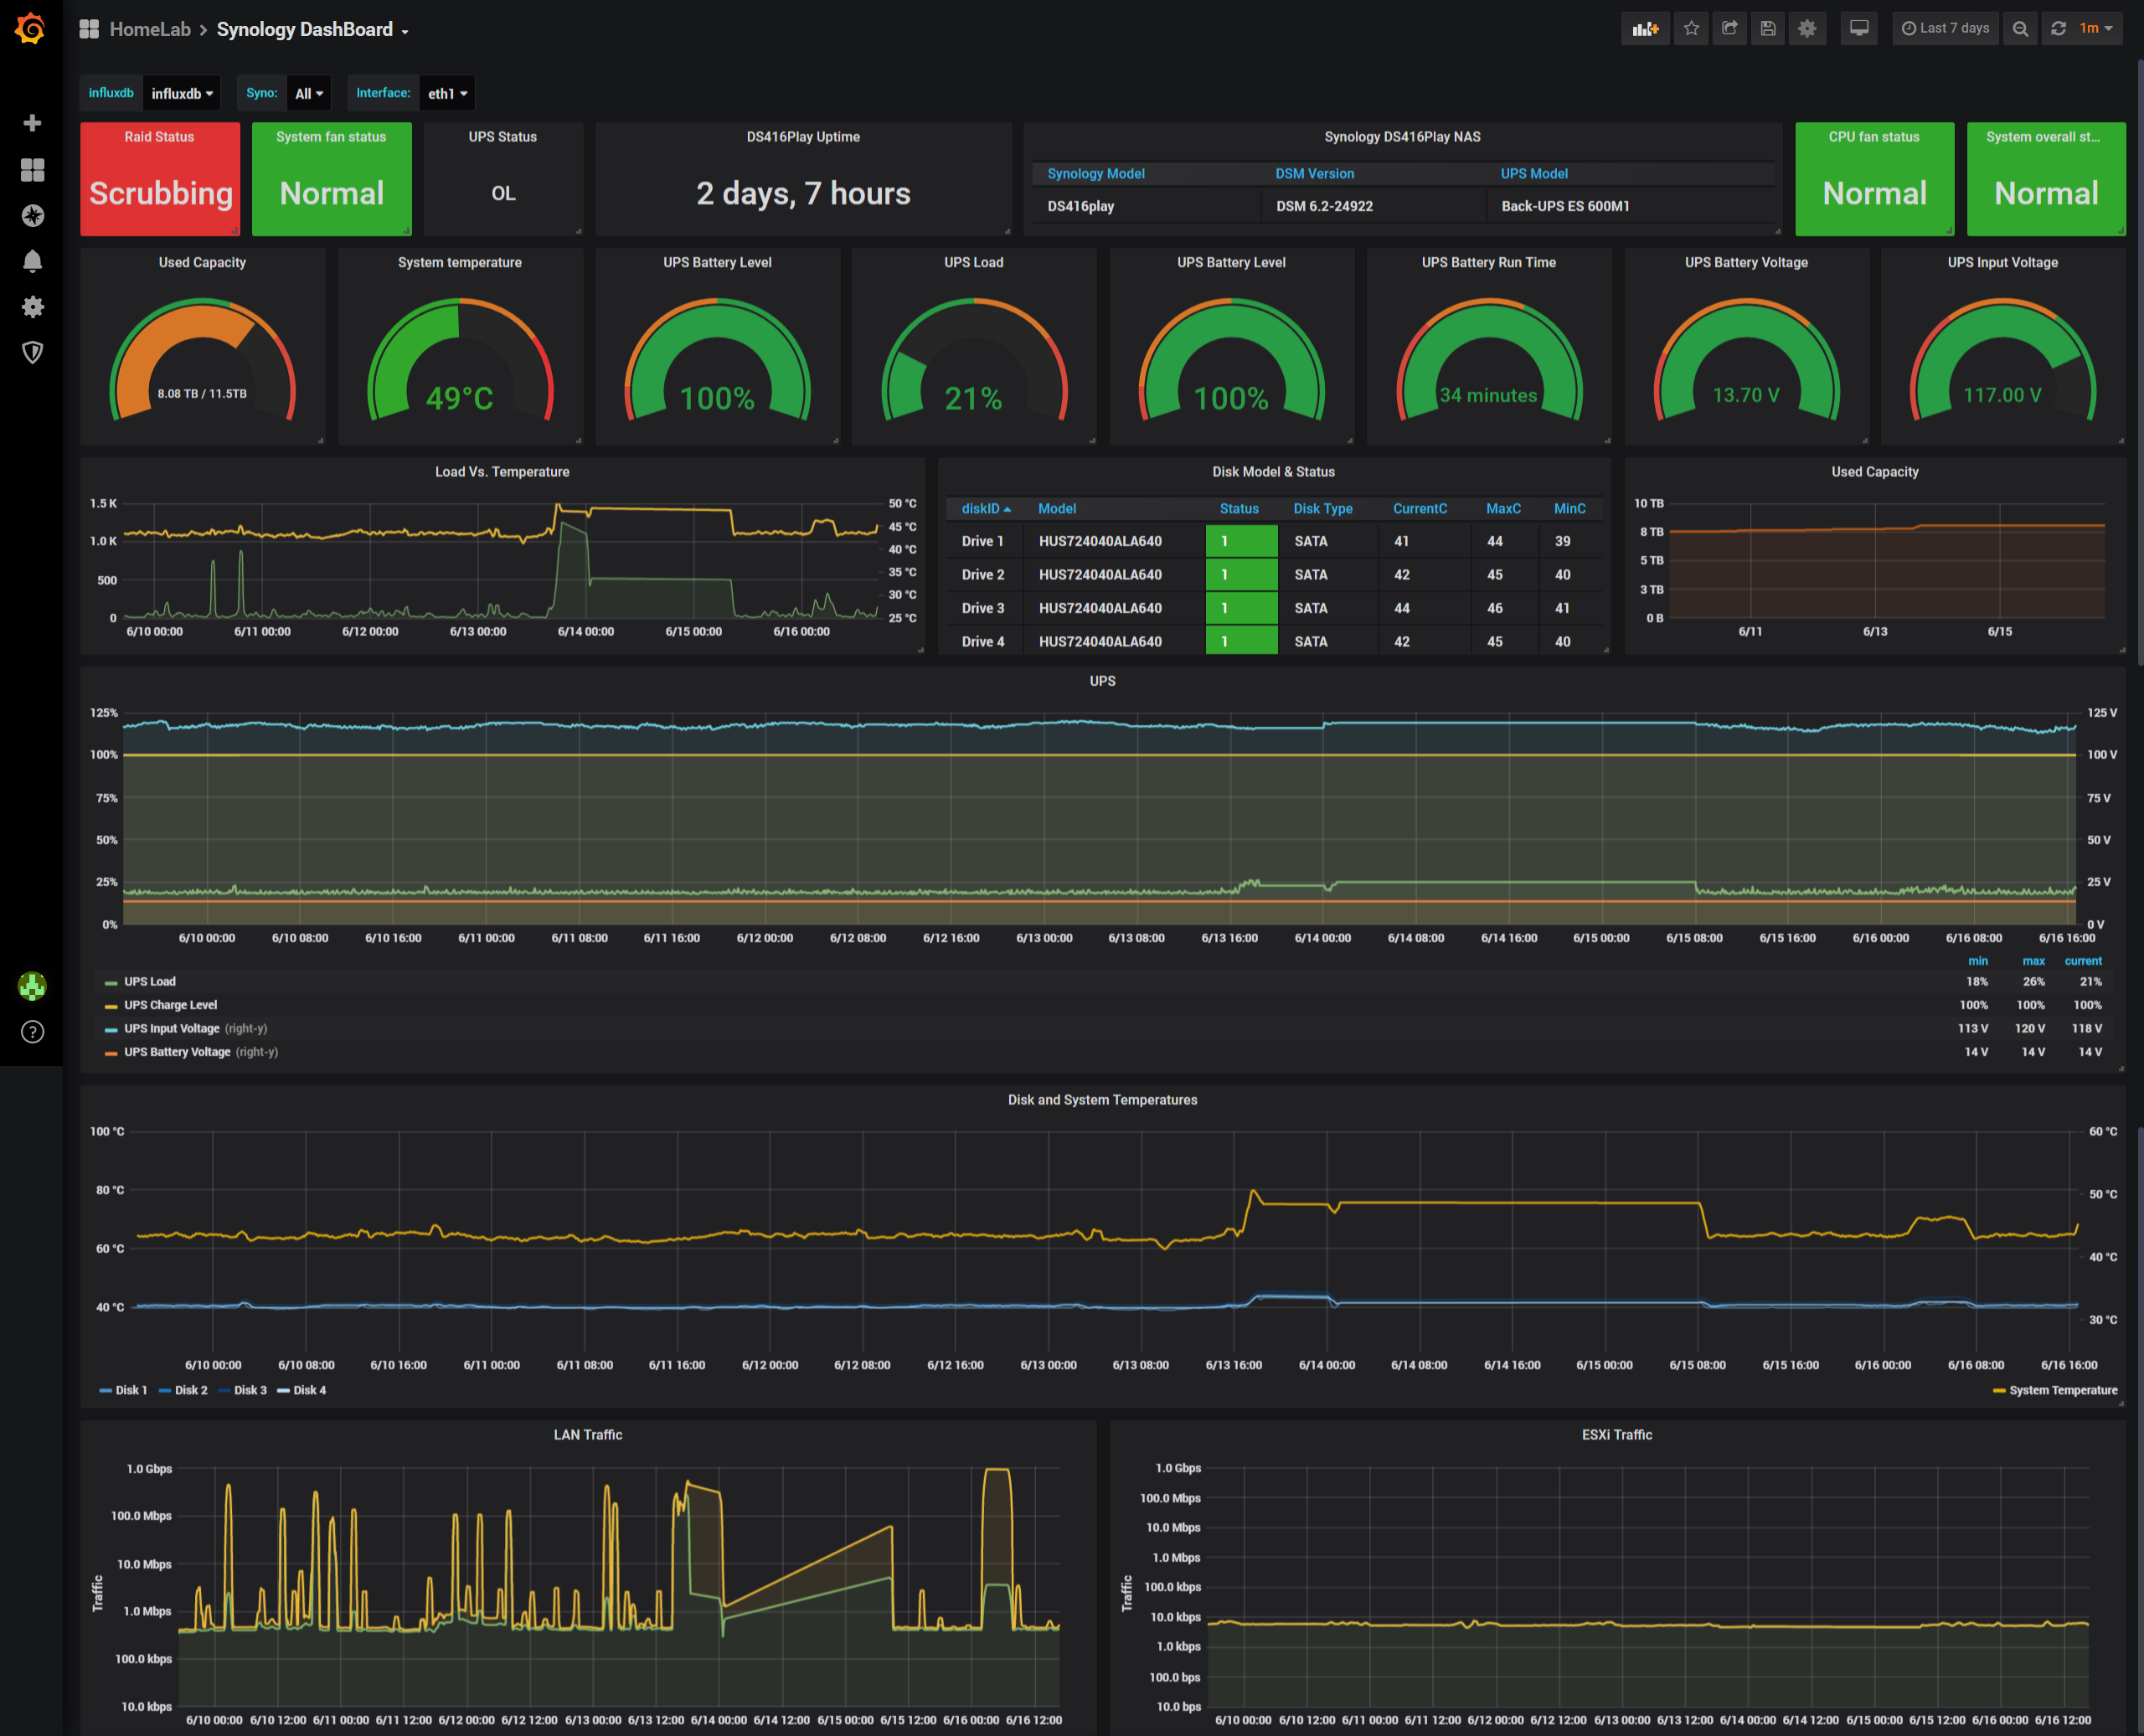
Synology Dashboard
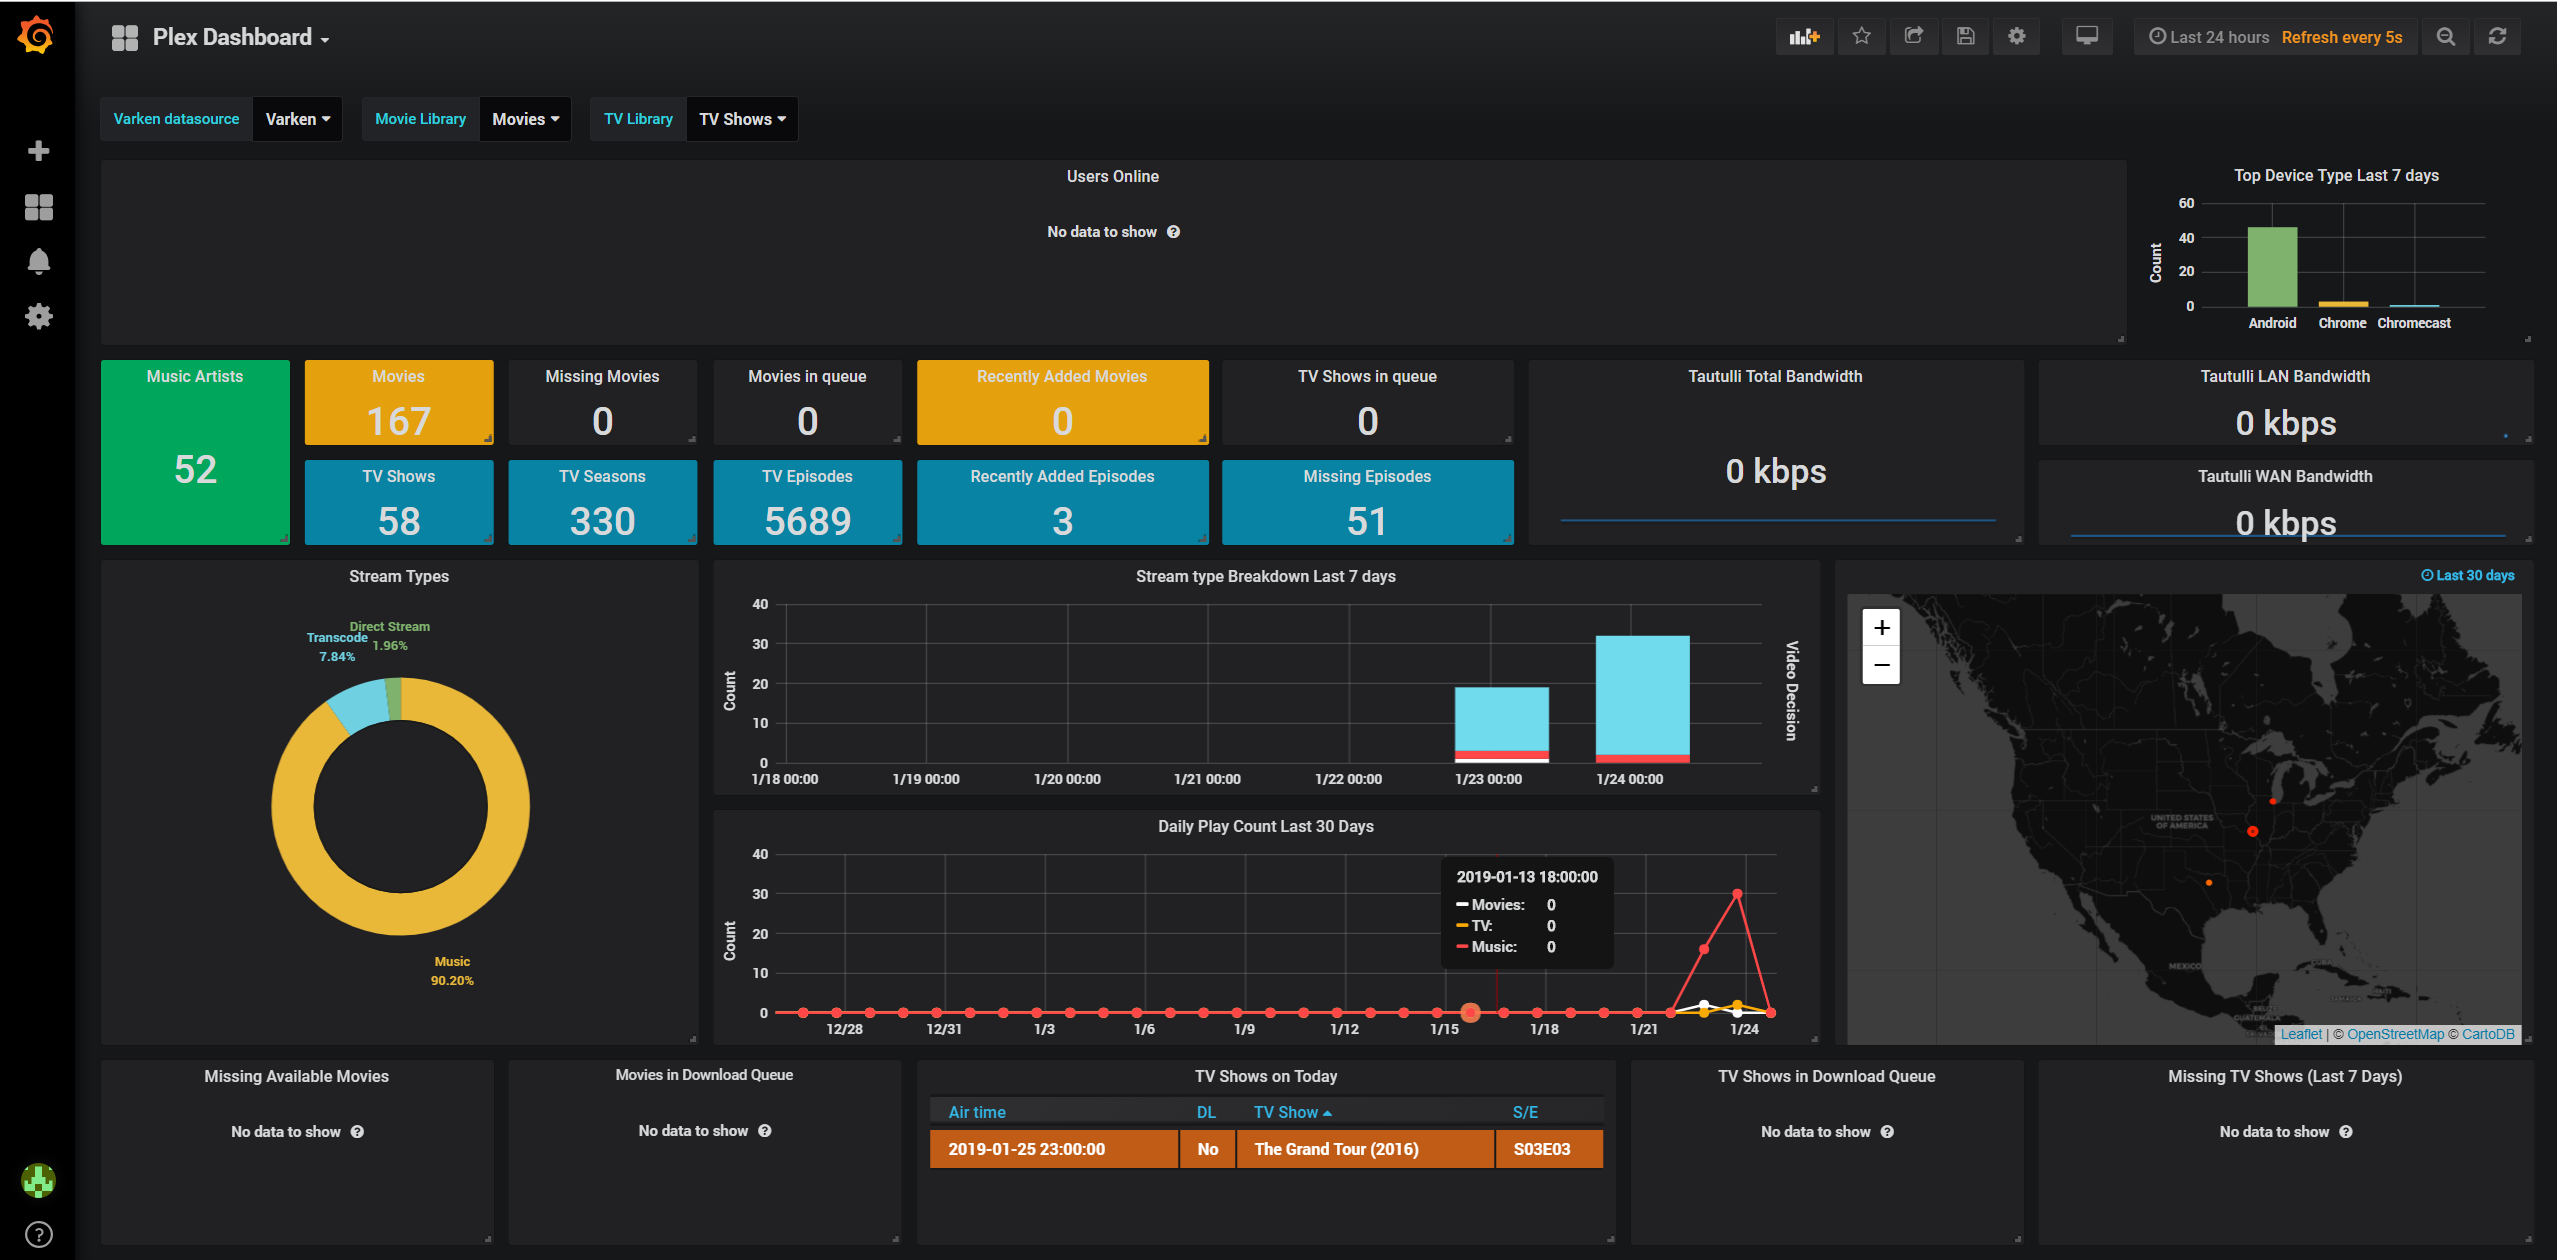
Plex:
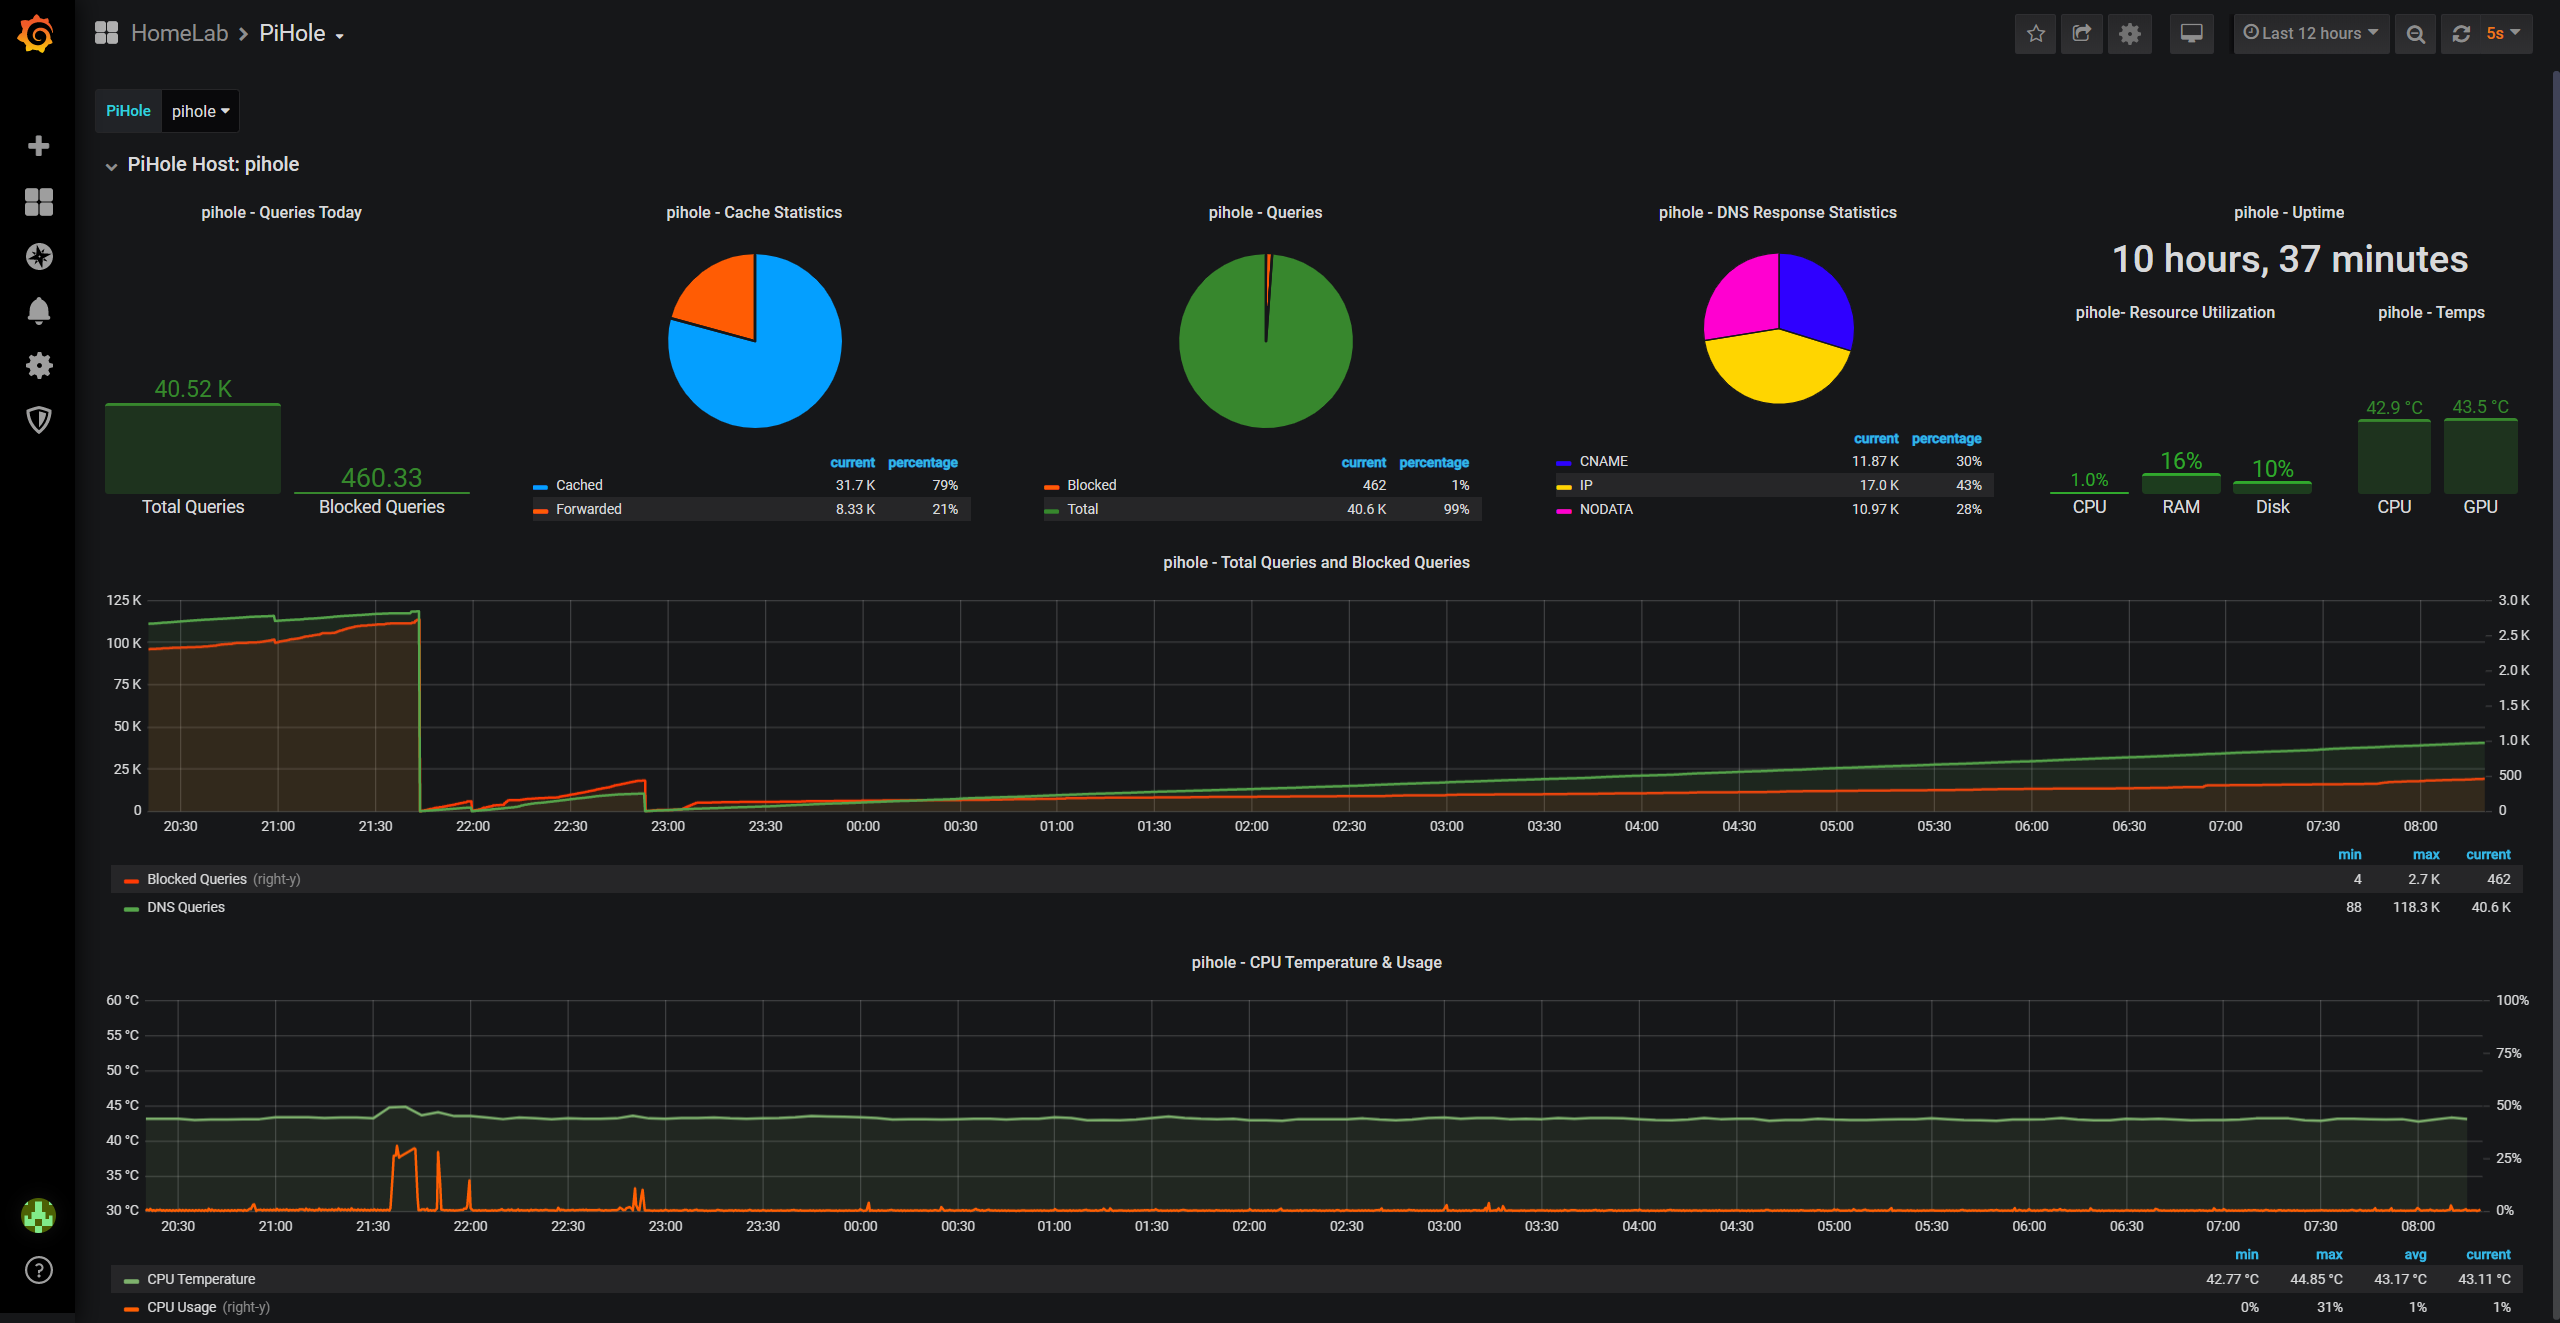
PiHole and Raspberry Pi Dashboard
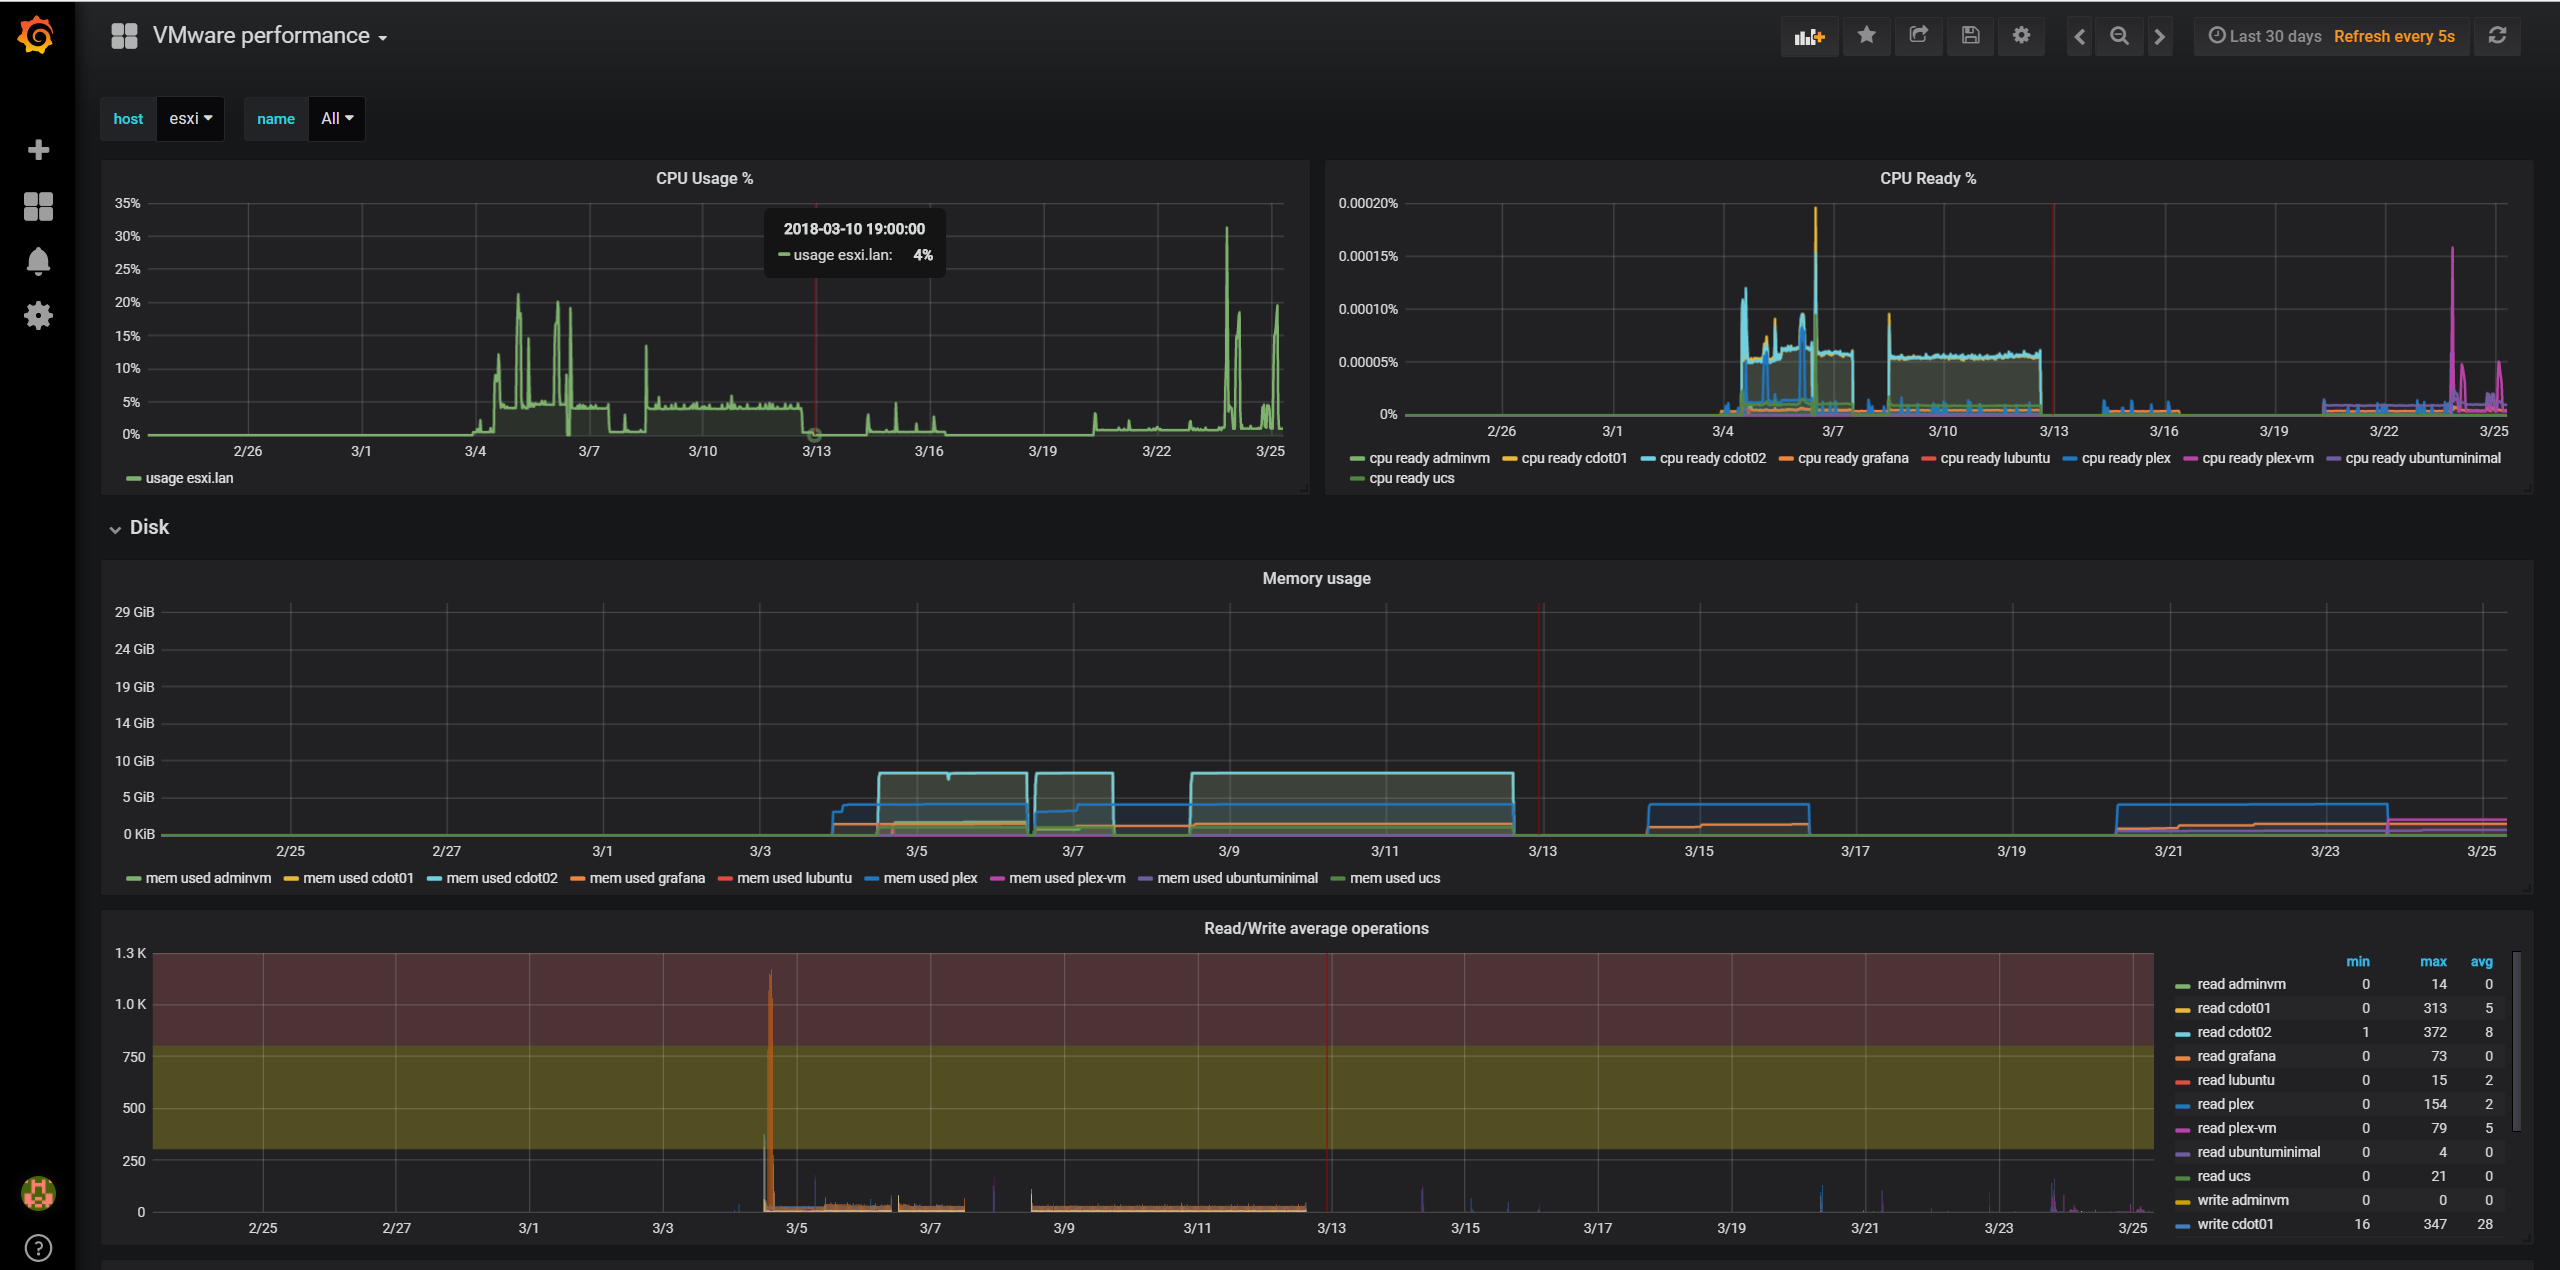
ESXi Dashboard
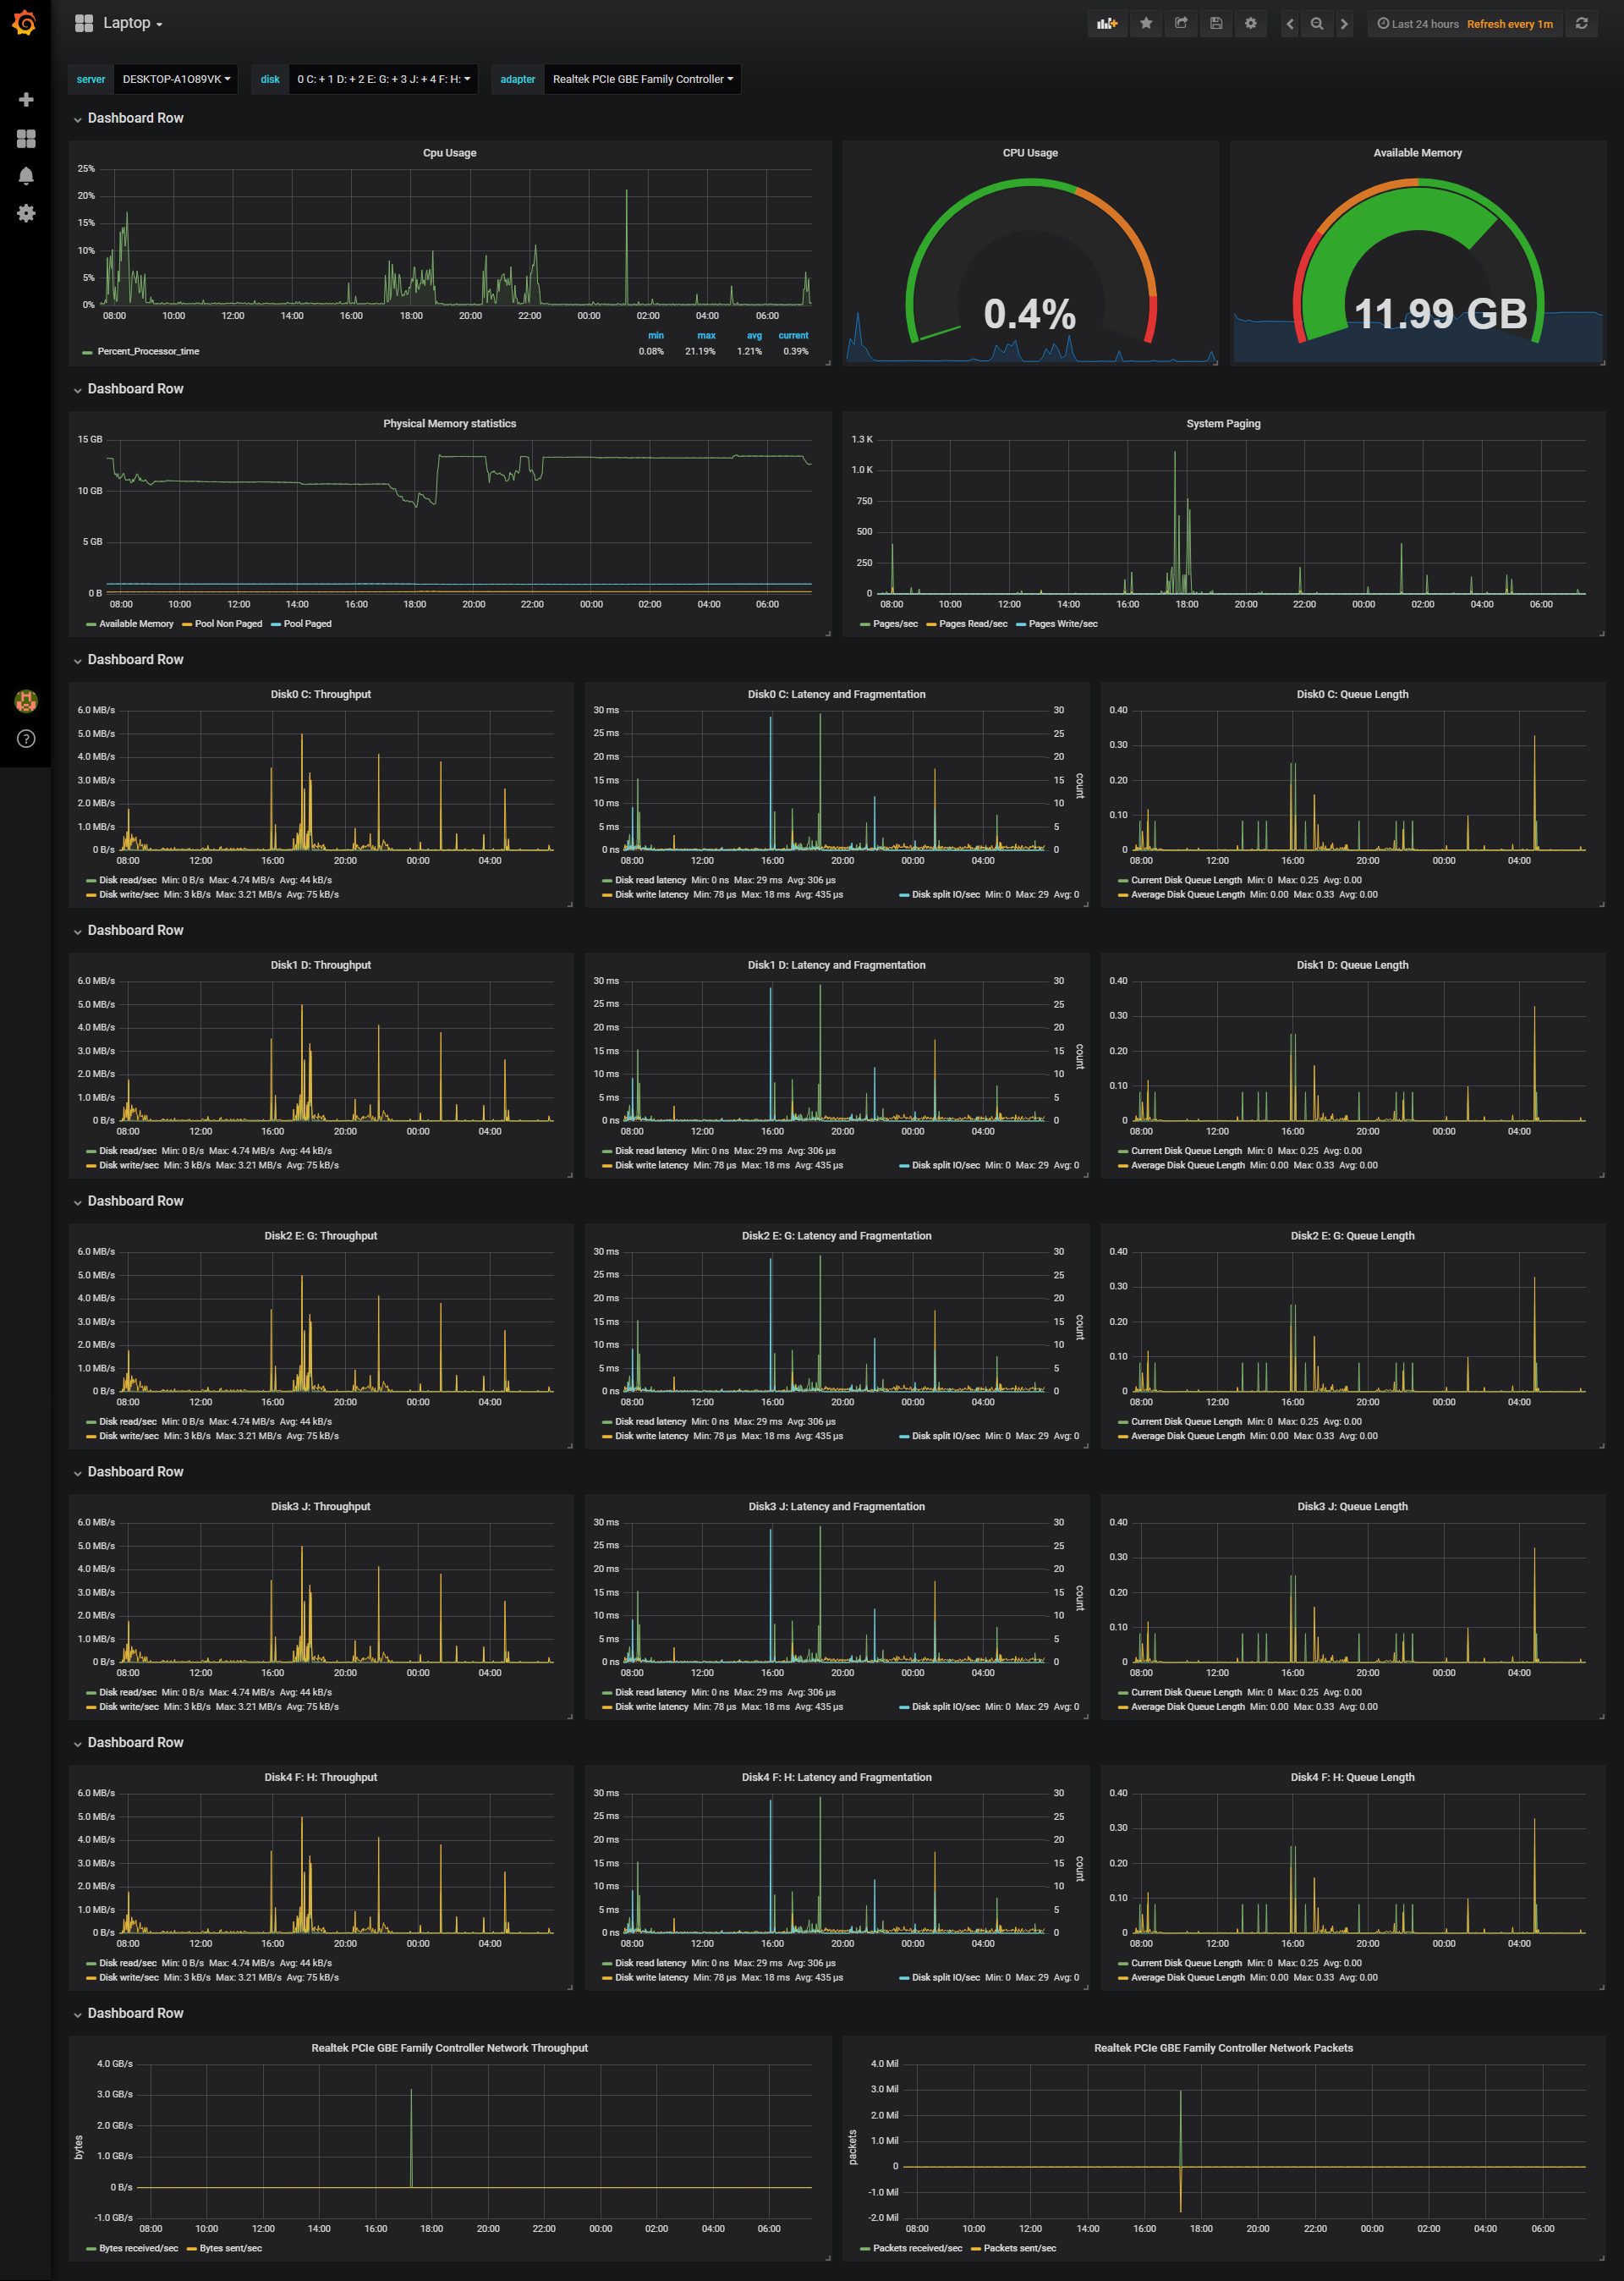
Windows
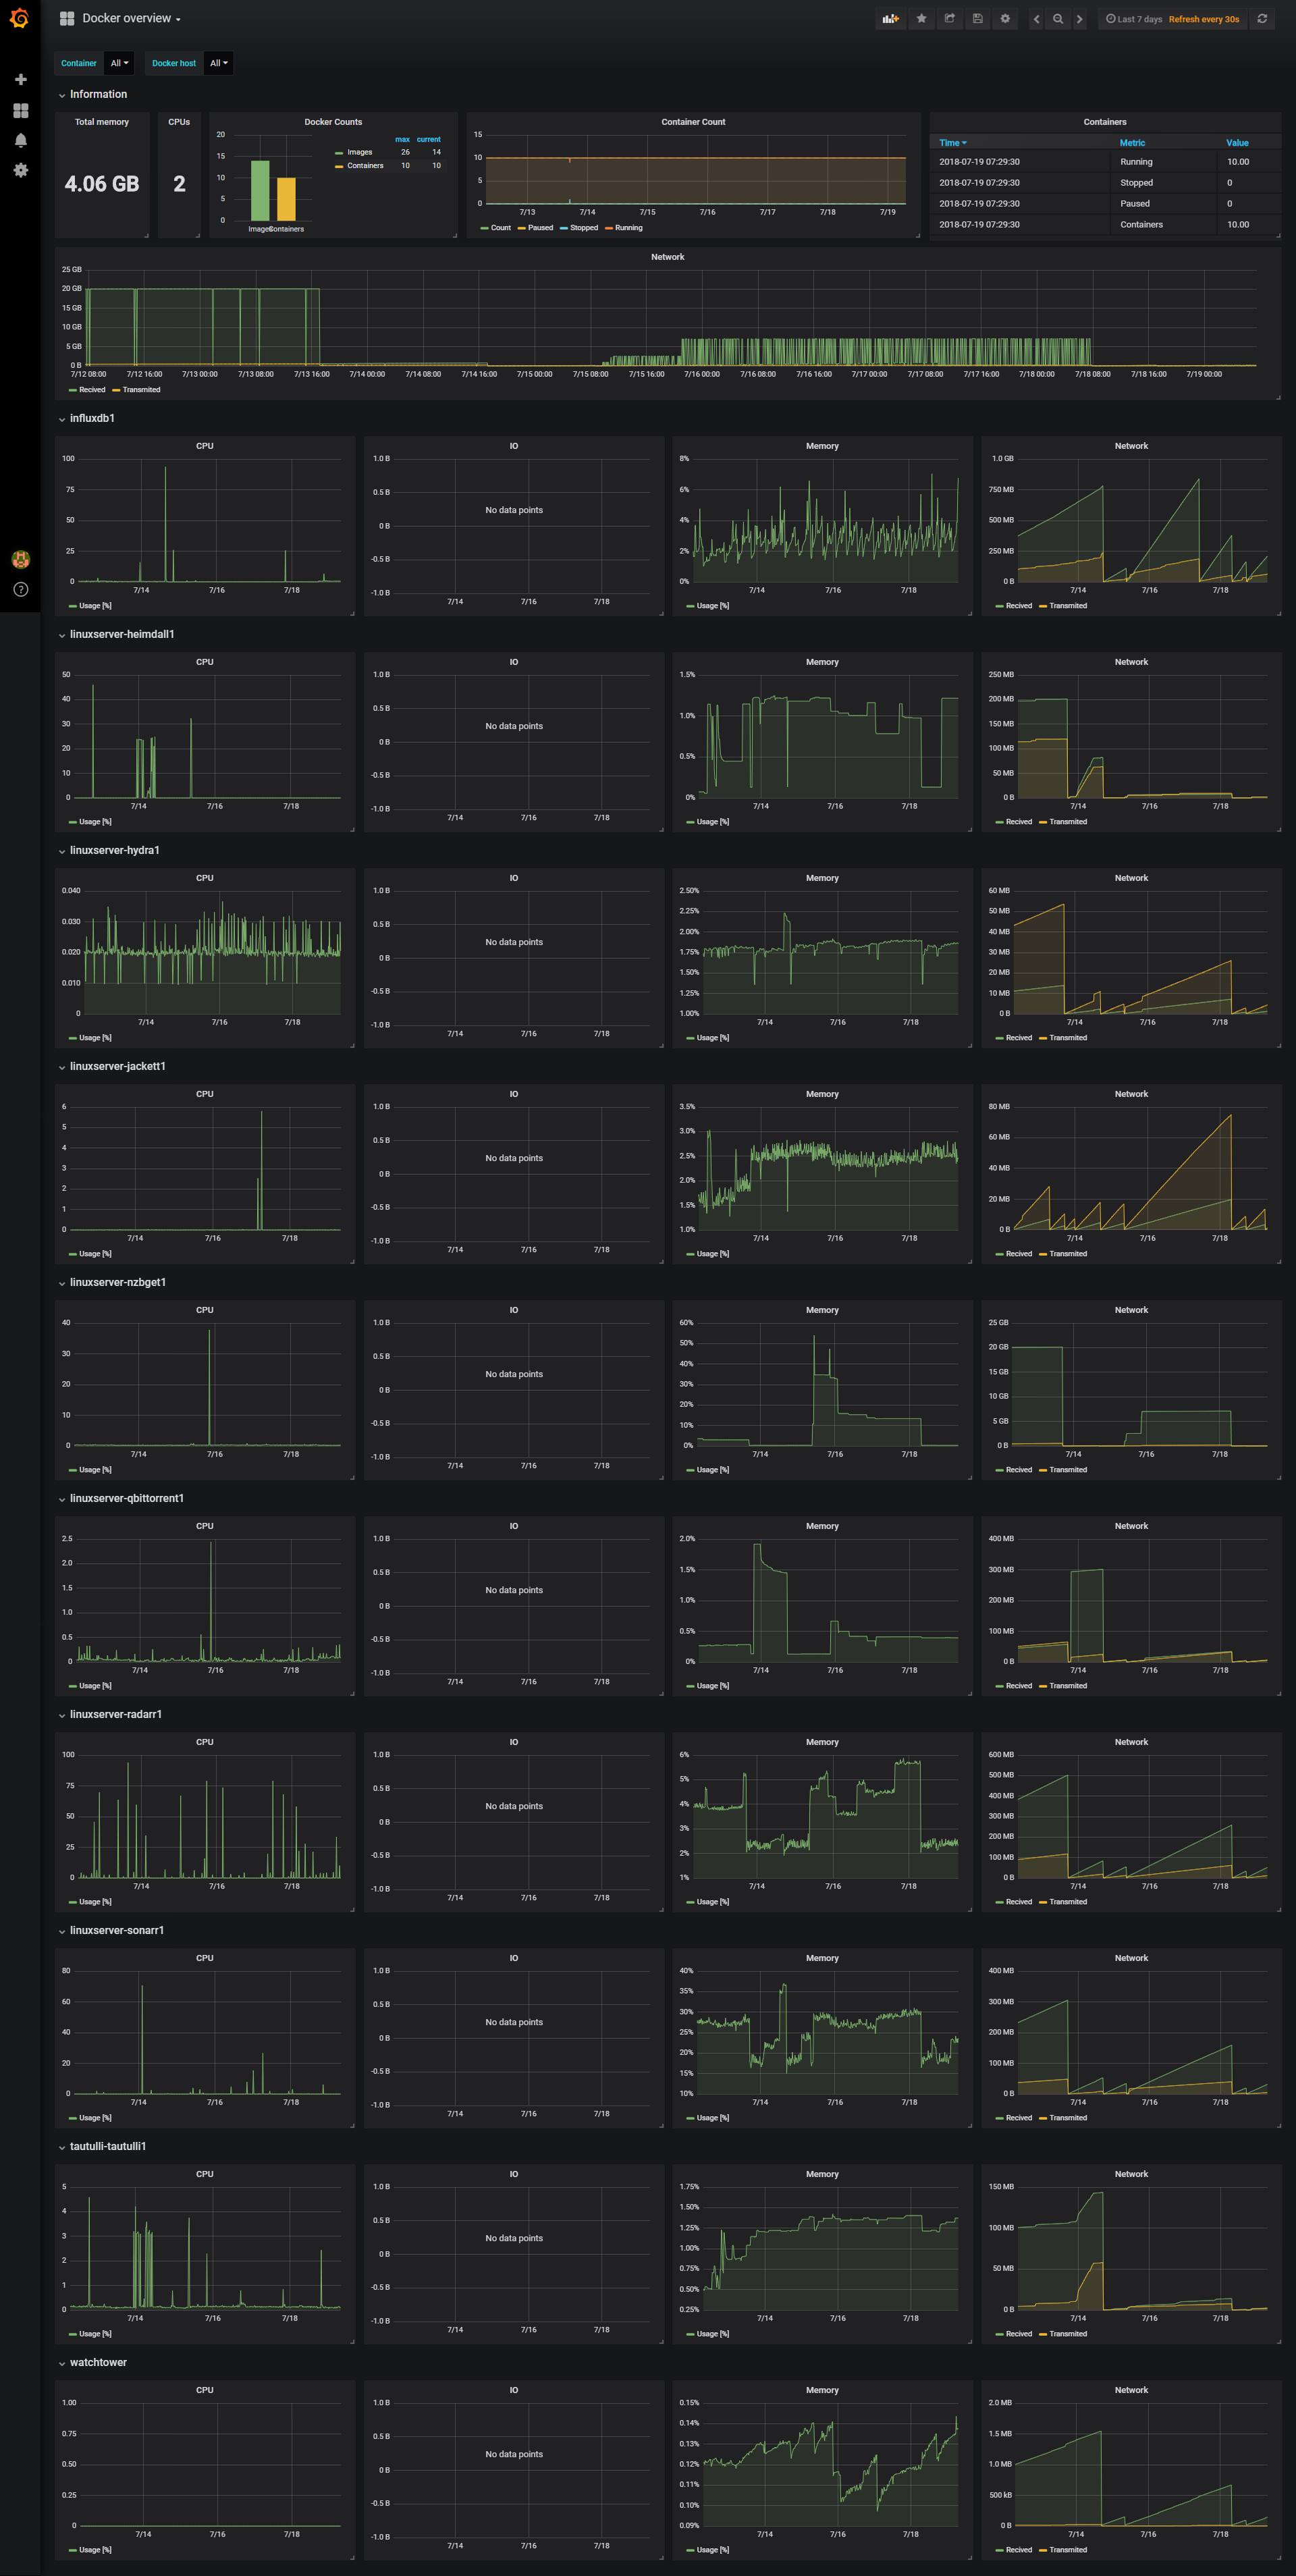
Docker Dashboard
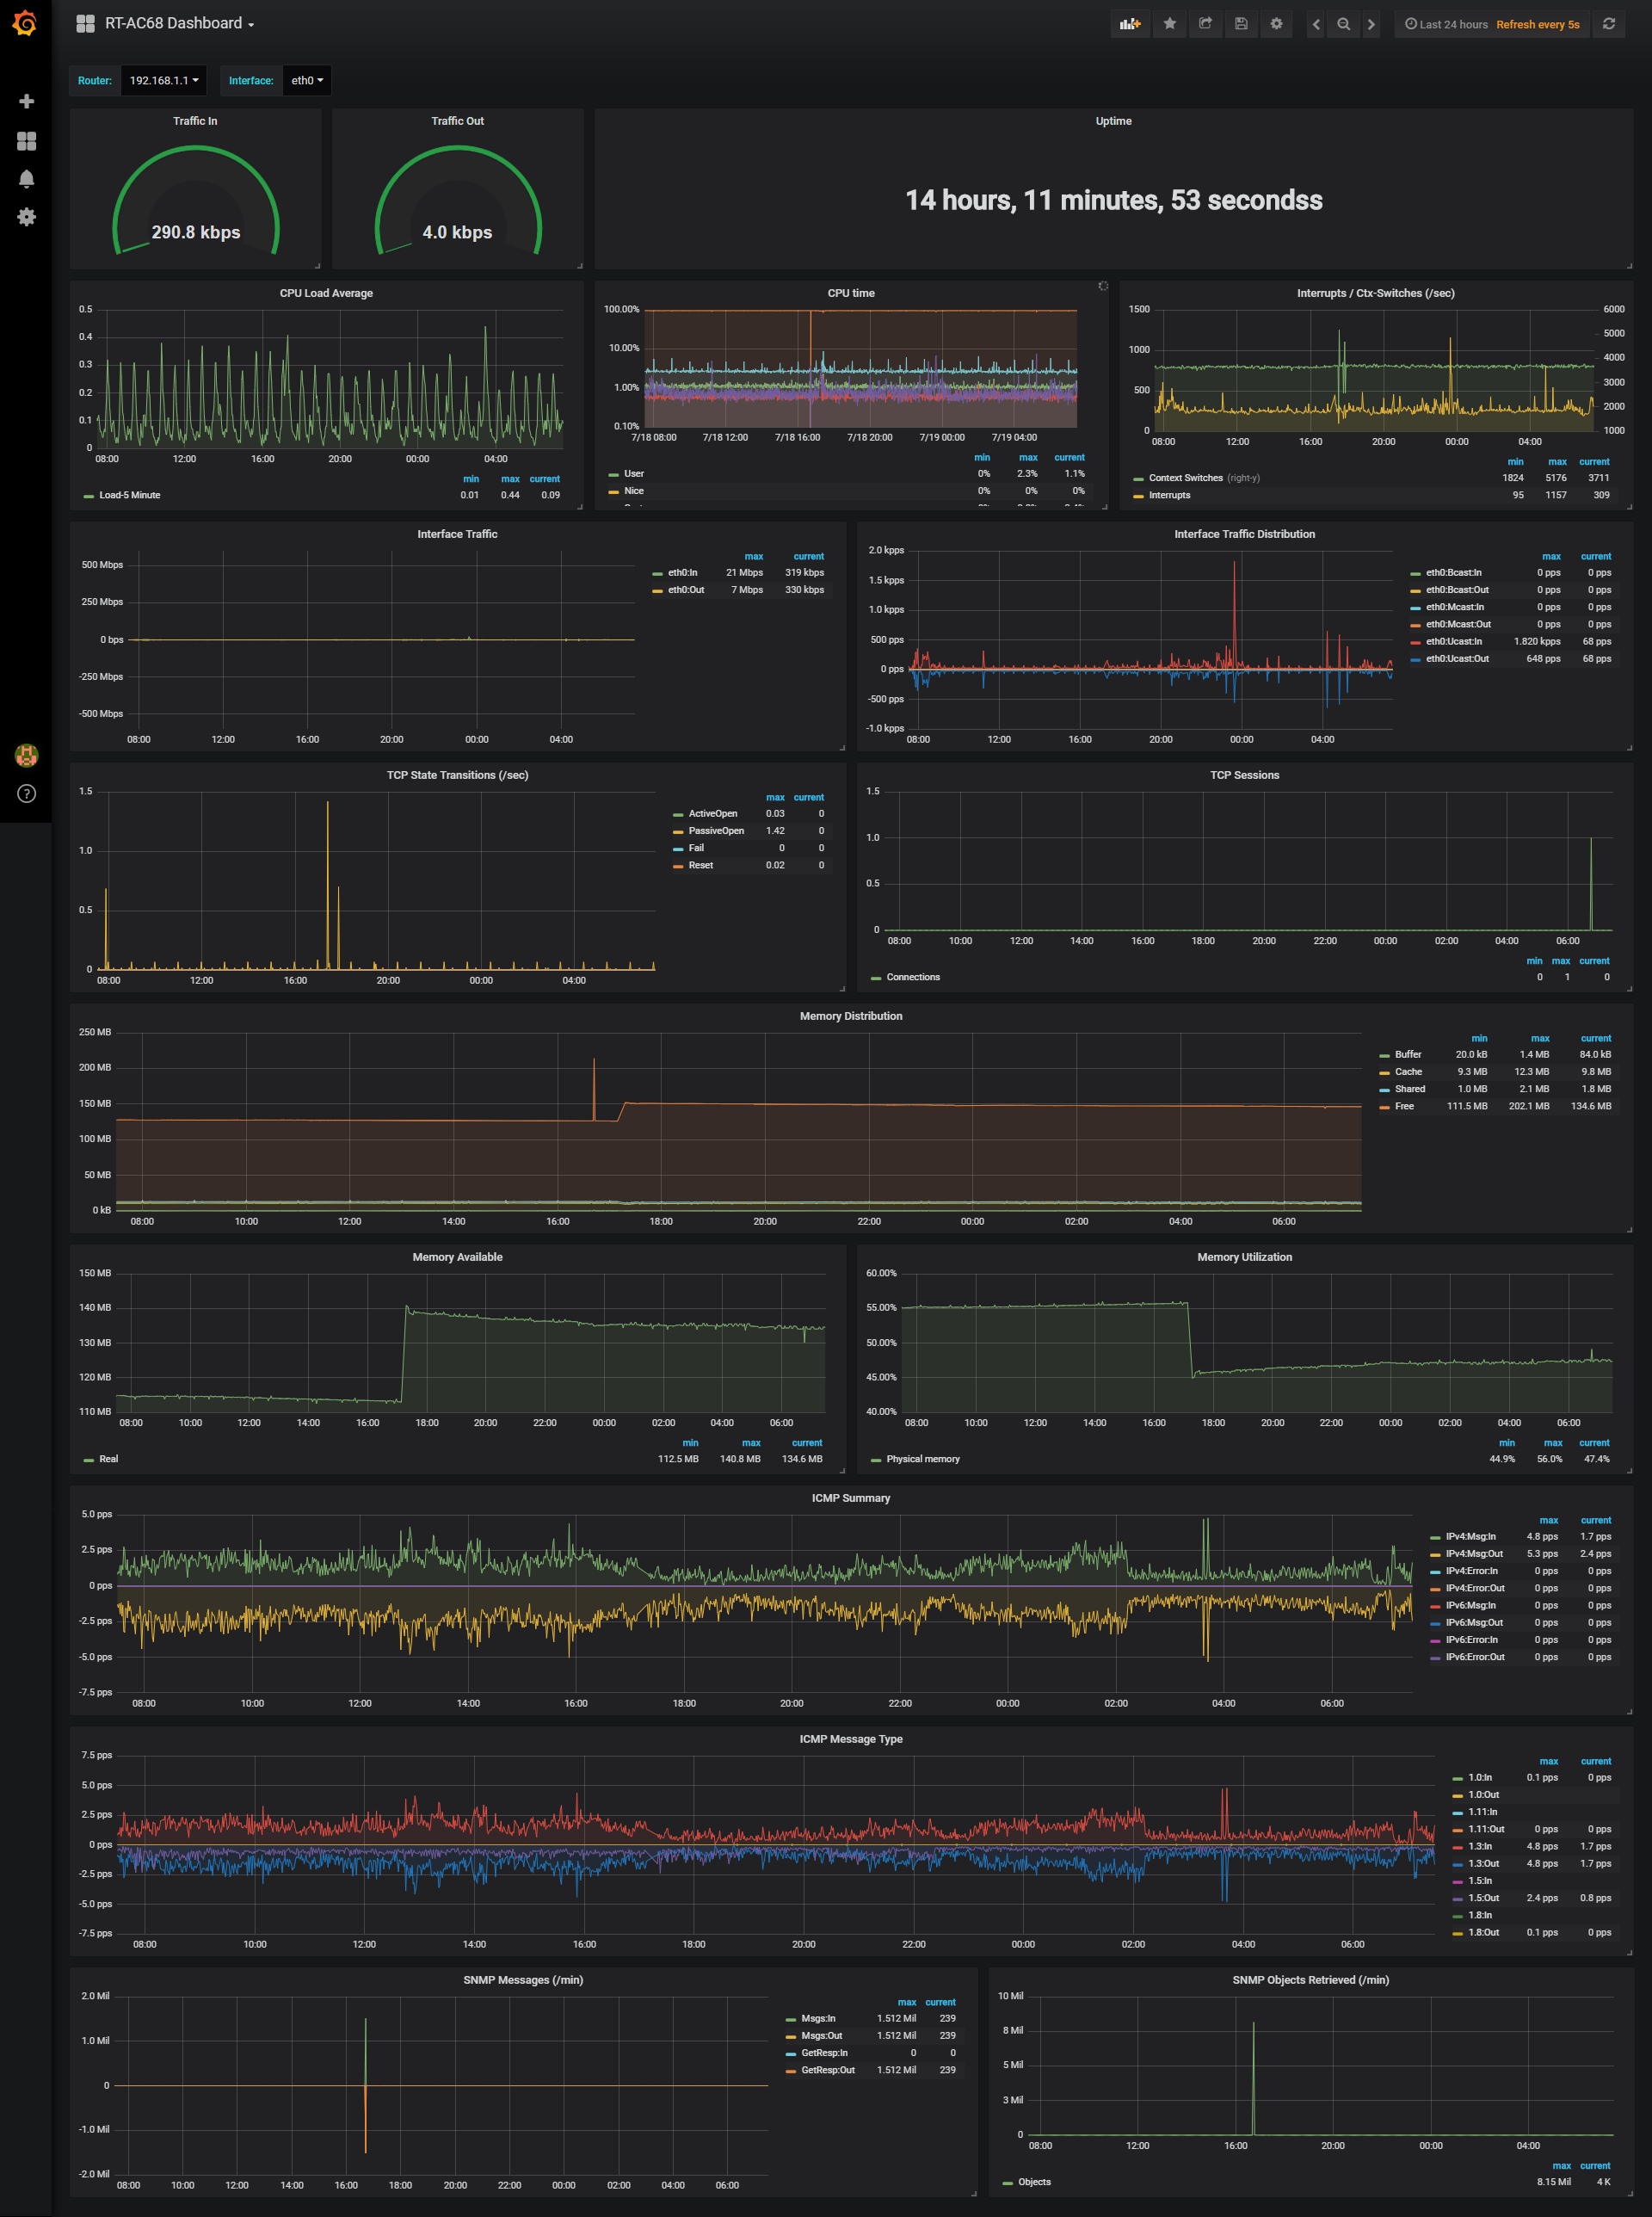
Asuswrt-Merlin Router (ASUS RT-AC68):
Raspberry Pi
Download "telegraf_pi_temp.sh" and 'chmod +x' the script. Then call it from within telegraf using "[[inputs.exec]]" (already included telegraf.conf in this repo).
PiHole
Change the address of PiHole to your PiHole's address in telegraf.conf
- Restart telegraf
Synology NAS
Based on: https://github.com/jperillo/Synology_dashboard_grafana
Make sure snmp-mibs-downloader is already installed on your telegraf host. It will download and install additional MIBs during install.
apt-get install snmp-mibs-downloader
then
download-mibs
edit /etc/snmp/snmp.conf and comment out the 'mibs:' line. Here is what mine looks like:
  GNU nano 2.7.4
File: /etc/snmp/snmp.conf
# As the snmp packages come without MIB files due to license reasons, loading
# of MIBs is disabled by default. If you added the MIBs you can reenable
# loading them by commenting out the following line.
# mibs :
Now when you do a SNMPwalk, it will automatically translate OIDs to Names. This is what it looks like against my Synology:
kumar@raspberrypi:~ $ snmpwalk -c public -v 2c 192.168.1.5
SNMPv2-MIB::sysDescr.0 = STRING: Linux DiskStation 3.10.102 SMP Fri Jan 26 06:46:44 CST 2018 x86_64
SNMPv2-MIB::sysObjectID.0 = OID: NET-SNMP-MIB::netSnmpAgentOIDs.10
DISMAN-EVENT-MIB::sysUpTimeInstance = Timeticks: (90908998) 10 days, 12:31:29.98
SNMPv2-MIB::sysContact.0 = STRING: Redacted
SNMPv2-MIB::sysName.0 = STRING: Synology DS416Play
SNMPv2-MIB::sysLocation.0 = STRING: Home
Get your MIBs (from here, for Synology Synology MIB download) and drop them in either of the below locations:
/home/$USER/.snmp/mibs or user/share/snmp/mibs
Go through the linked page above or the snmpwalk output and make a list of OIDs you want to monitor (grep is your friend here)
Add them to telegraf.conf using examples others have provided elsewhere in this thread
Restart telegraf and test with the '-test' flag. To verify everything is working as expected.
VMWare
Telegraf introduced a new vsphere plugin. I will be using this instead of a custom script going forward. This plugin and details can be found here:
https://github.com/influxdata/telegraf/tree/master/plugins/inputs/vsphere
Dashboards for the metrics can be found here:
https://github.com/jorgedlcruz/vmware-grafana
Docker
DockerHost: Synology NAS (DS416Play) Telegraf: Raspberry Pi
Since I did not want to mess around with exposing docker.sock file to a remote client, I went with exposing a TCP endpoint on docker host to a remote telegraf agent.
To do this:
1. On Docker Host (Synology):
Add the endpoint details to /var/packages/Docker/etc/dockerd.json like so:
admin@DiskStation:~$ cat /var/packages/Docker/etc/dockerd.json
{
	"hosts" : [ "tcp://synology.lan:2375", "unix:///var/run/docker.sock" ],
	"registry-mirrors" : []
}
In the above snippet, tcp://synology.lan:2375 Is the end point definition we have to add
Note: Don't change any part of the "unix:///var/run/docker.sock" definition. Synology uses to run the Docker GUI. Also, since this is a JSON file, all lines except the last line have a " , " at the end. Also note the " , " after the TCP definition.
If you want to be doubly sure, you can use https://jsonlint.com to validate the JSON contents.
Once this is done, restart the docker package from within DSM's Package center
2. On Telegraf: Add the below lines to your input plugins:
# Synology Docker
[[inputs.docker]]
  endpoint = "tcp://synology.lan:2375"
  container_names = []
3. Grafana Dashboard:
Grafana Dashboard JSON is included in this repository. Simply import it, define your data source and you should be good to go.
Plex
Plex can be monitored using Verken linked below. I have included my customized dashboard in the repo for reference.
Explore related projects
awesome-selfhosted/awesome-selfhosted
A list of Free Software network services and web applications which can be hosted on your own servers
335,428 starsimmich-app/immich
High performance self-hosted photo and video management solution.
118,568 starsStirling-Tools/Stirling-PDF
#1 PDF Application on GitHub that lets you edit PDFs on any device anywhere
96,048 starslouislam/uptime-kuma
A fancy self-hosted monitoring tool
93,389 stars