
cataseven/Statistics-Graph-Chart-Card
cataseven/Statistics-Graph-Chart-Card has 359 GitHub stars and 5 forks. GitHot measured 0 stars in 24 hours and +4 in 7 days. Last checked 2026-11-09 11:43 UTC. Last push 2026-10-30.
A highly customizable, smooth, and advanced graph chart card for Home Assistant dashboards. Shows historical sensor data with dynamic trend colors, statistics (min, max, avg), and more. The best graph chart card for your Home Assistant statistics
What you can do
- 📈 - Line, step, and bar charts with smooth Bezier curves
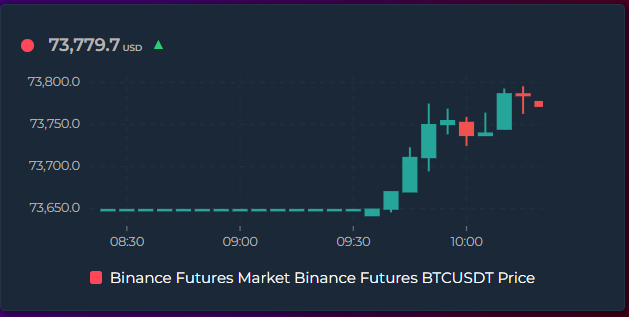
- 🕯️ - Candlestick (OHLC) charts — render any entity as trading-style candles showing the open, high, low, and close of each time bucket. Green/red up/down bodies with high–low wicks and an O/H/L/C tooltip; recolor with the Rise/Fall Colors feature. Candles snap to clean clock intervals and sit centered on the X-axis ticks
- 🔢 - Live state rows with current value, MDI icons, and configurable font sizes
- 📦 - Box Plot mode — chart_mode: box draws min / Q1 / median / Q3 / max boxes per time bucket, straight from the dense source samples. Answer "what is this room's daily temperature spread?" at a glance. Bucket width follows group_by or is picked automatically from the window
Measured star growth
- in 24h
- 0
- in 7 days
- +4
- in 15 days
- Collecting history
- in 1 month
- Collecting history
Net star changes over overlapping periods, not daily totals. Missing measurements are left blank. Stars measure attention, not software quality.
README.md
Original⭐ Support
If you like this card, feel free to ⭐ star the project on GitHub and share it with the Home Assistant community or

📊 Home Assistant - Statistics Graph Chart Card


An awesome feature-rich custom card for Home Assistant that combines a time-series graph with live state rows — all in a single card. Built with no external dependencies, fully configurable via the visual editor or YAML.
[!NOTE] Source availability — this card is distributed as a minified/protected bundle. The readable source code is not published, so the repository is not set up for external code review or pull requests. Bug reports and feature requests are very welcome in Issues — that is how every feature in this card has been shaped so far. Please factor this in when deciding whether to install. The card is free to use and installs via GitHub/HACS under a custom proprietary license — see LICENSE for the terms.
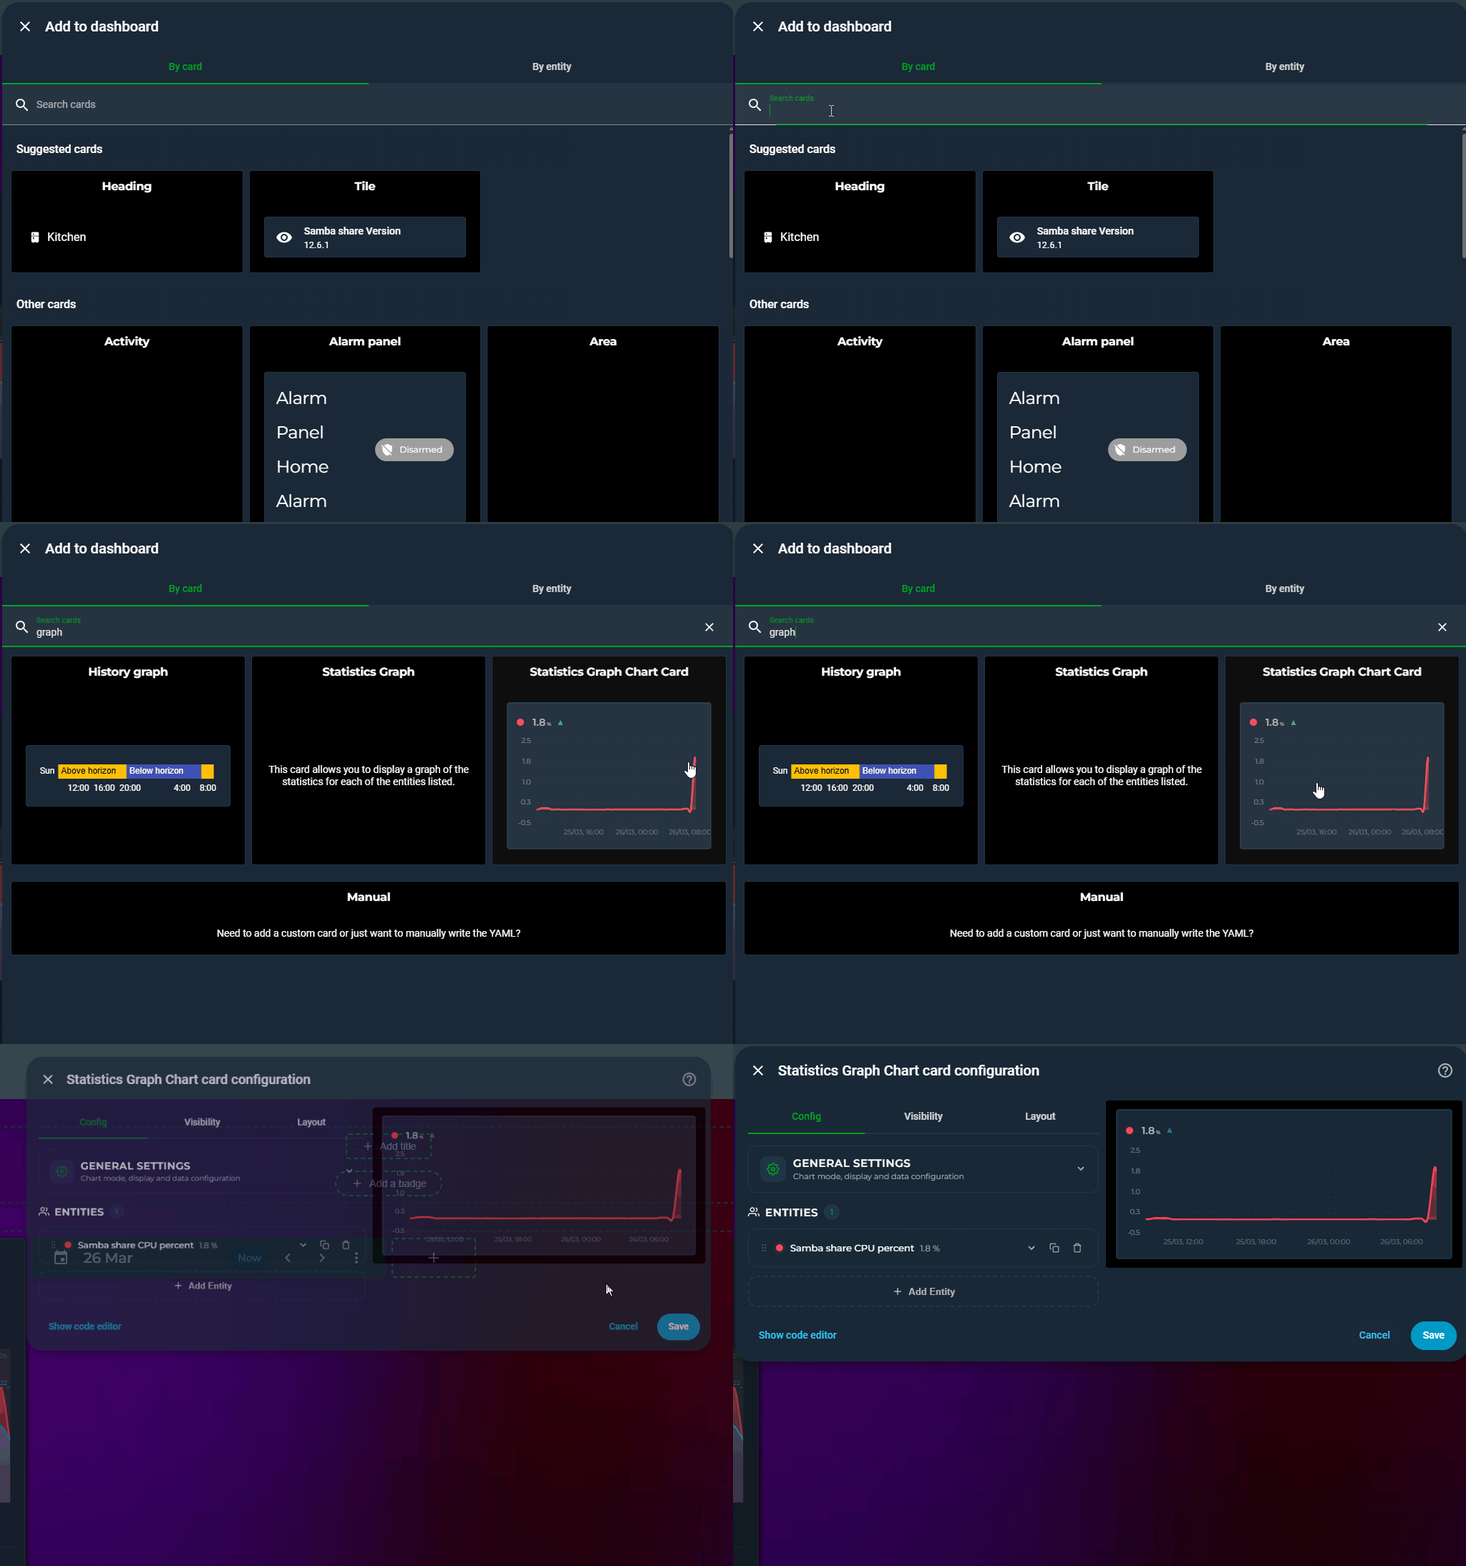
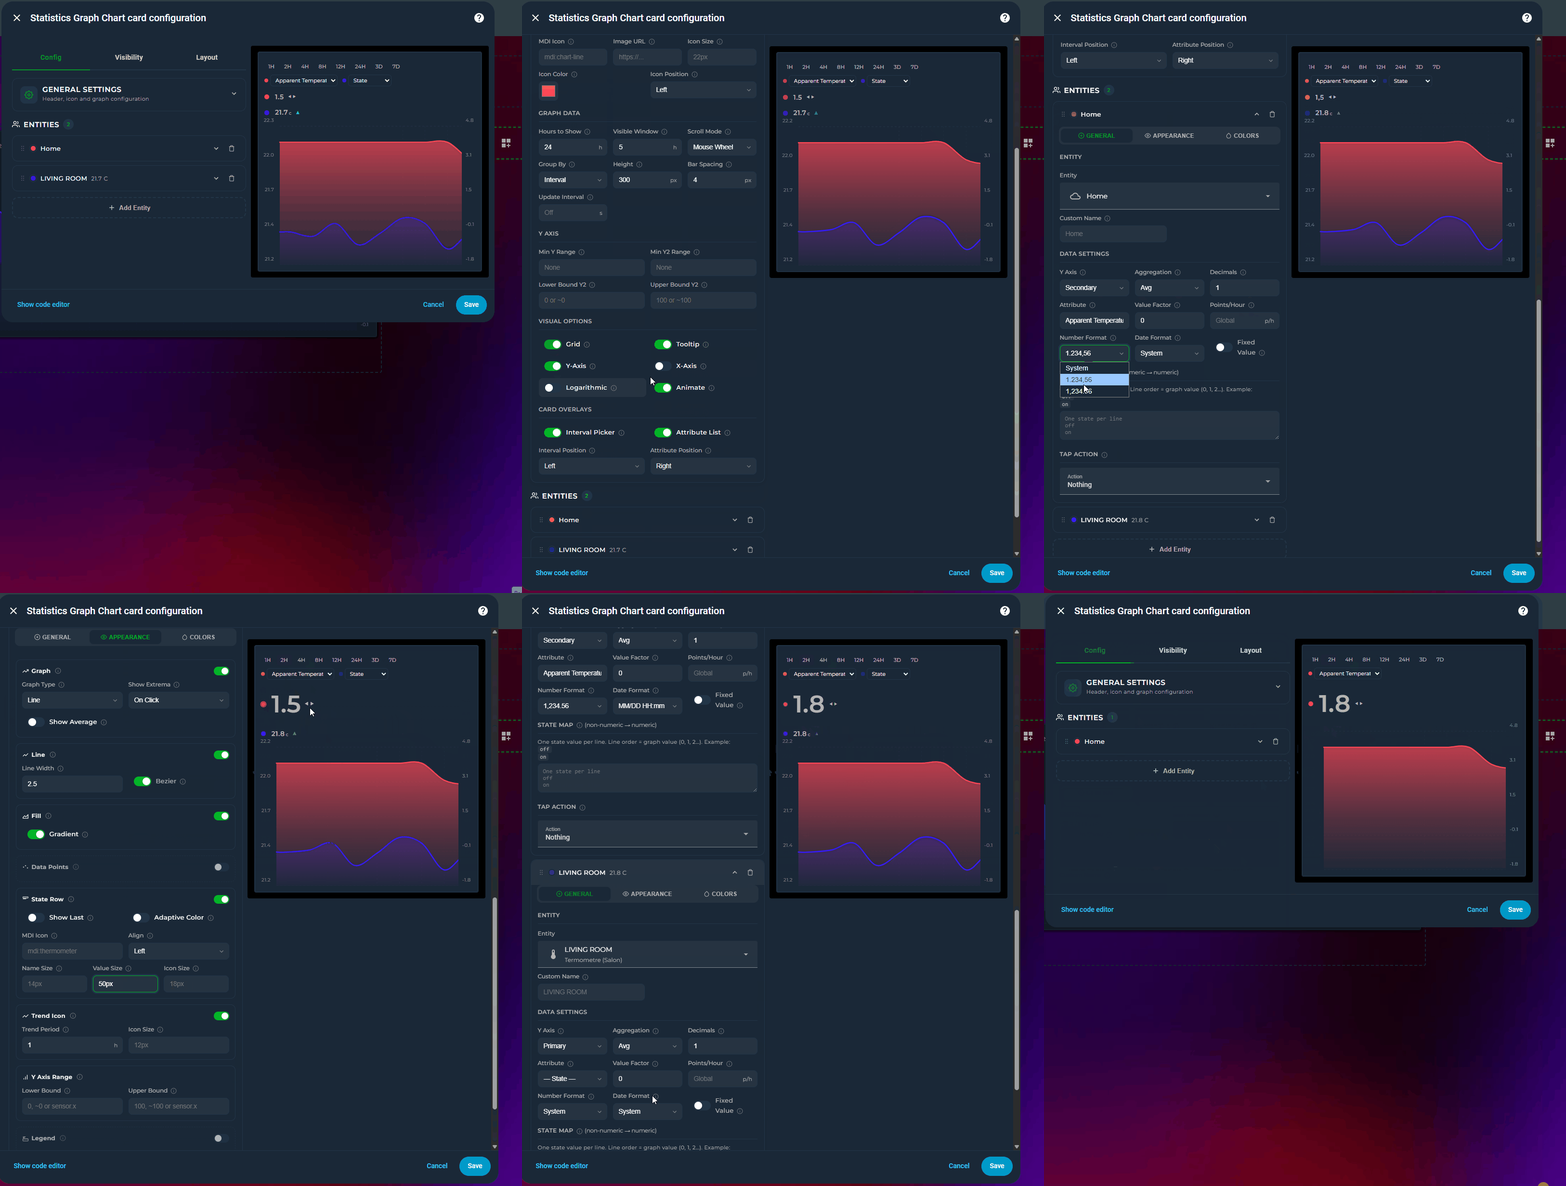
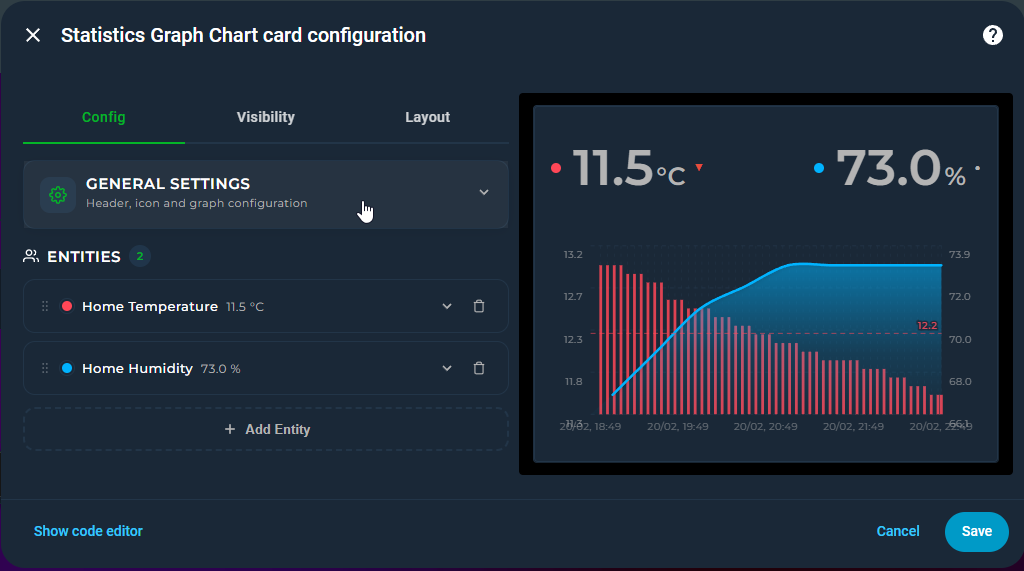
🖼️ Preview
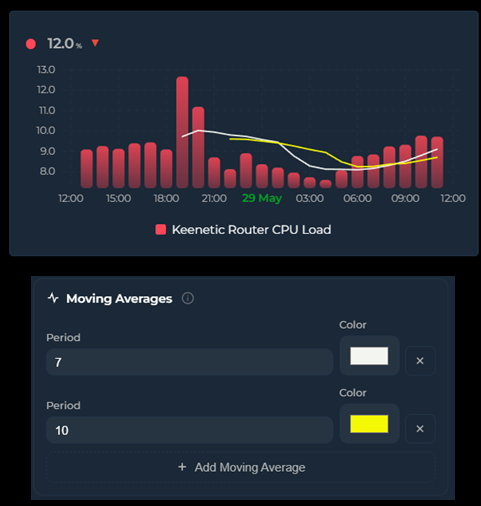
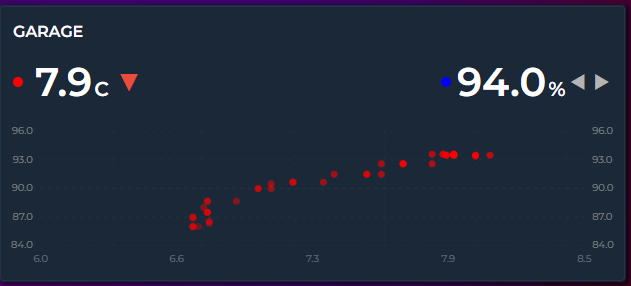
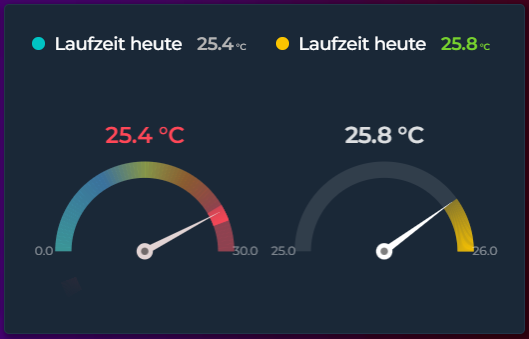
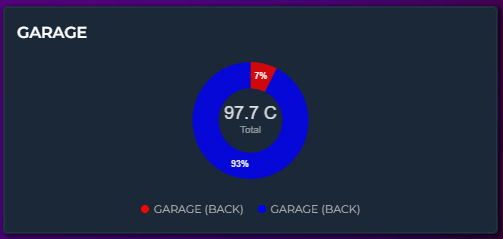
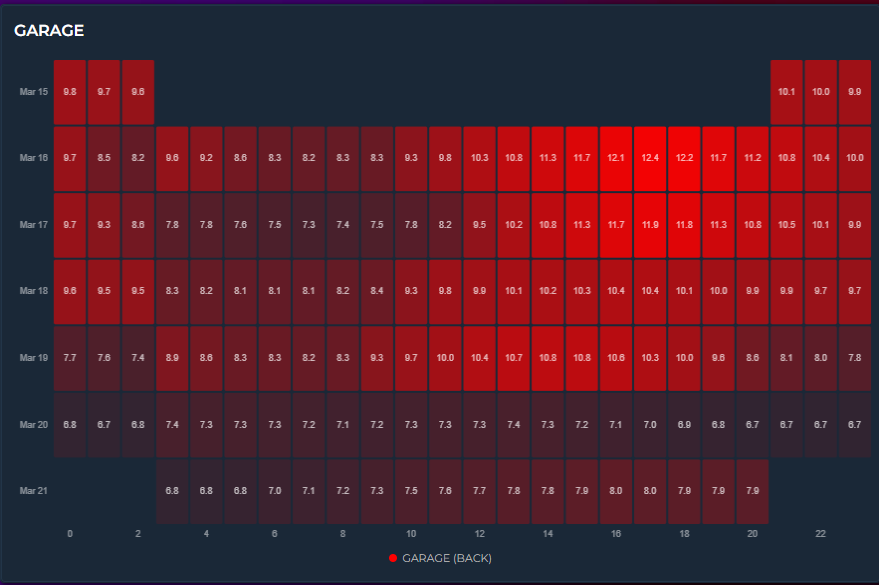
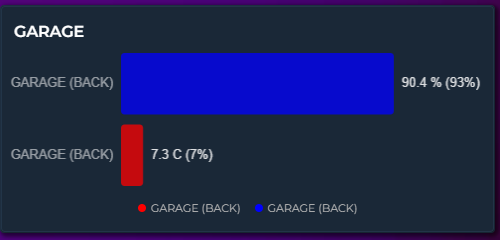
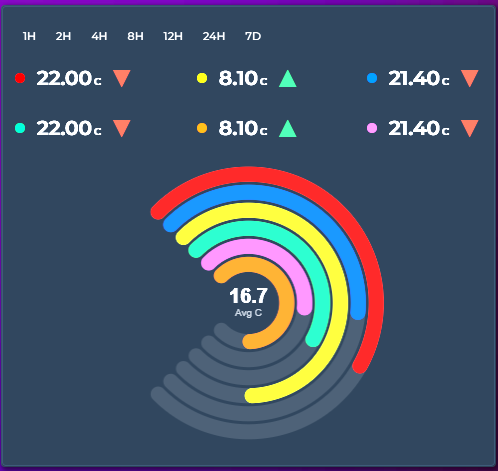
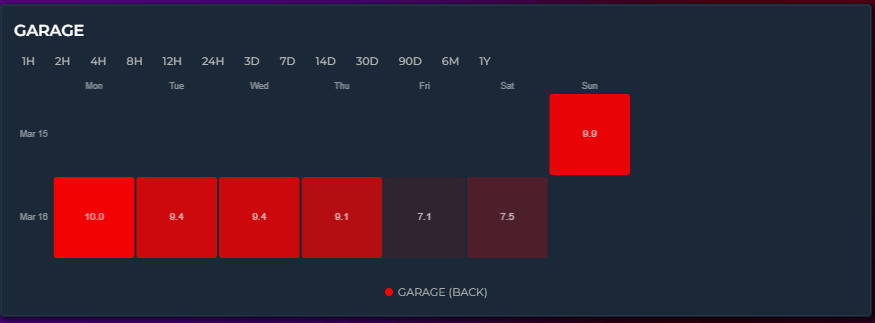
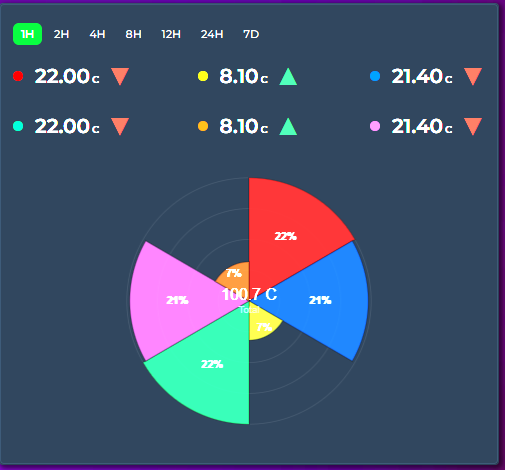
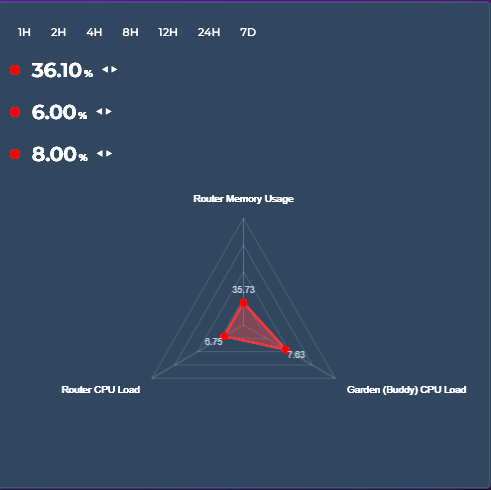
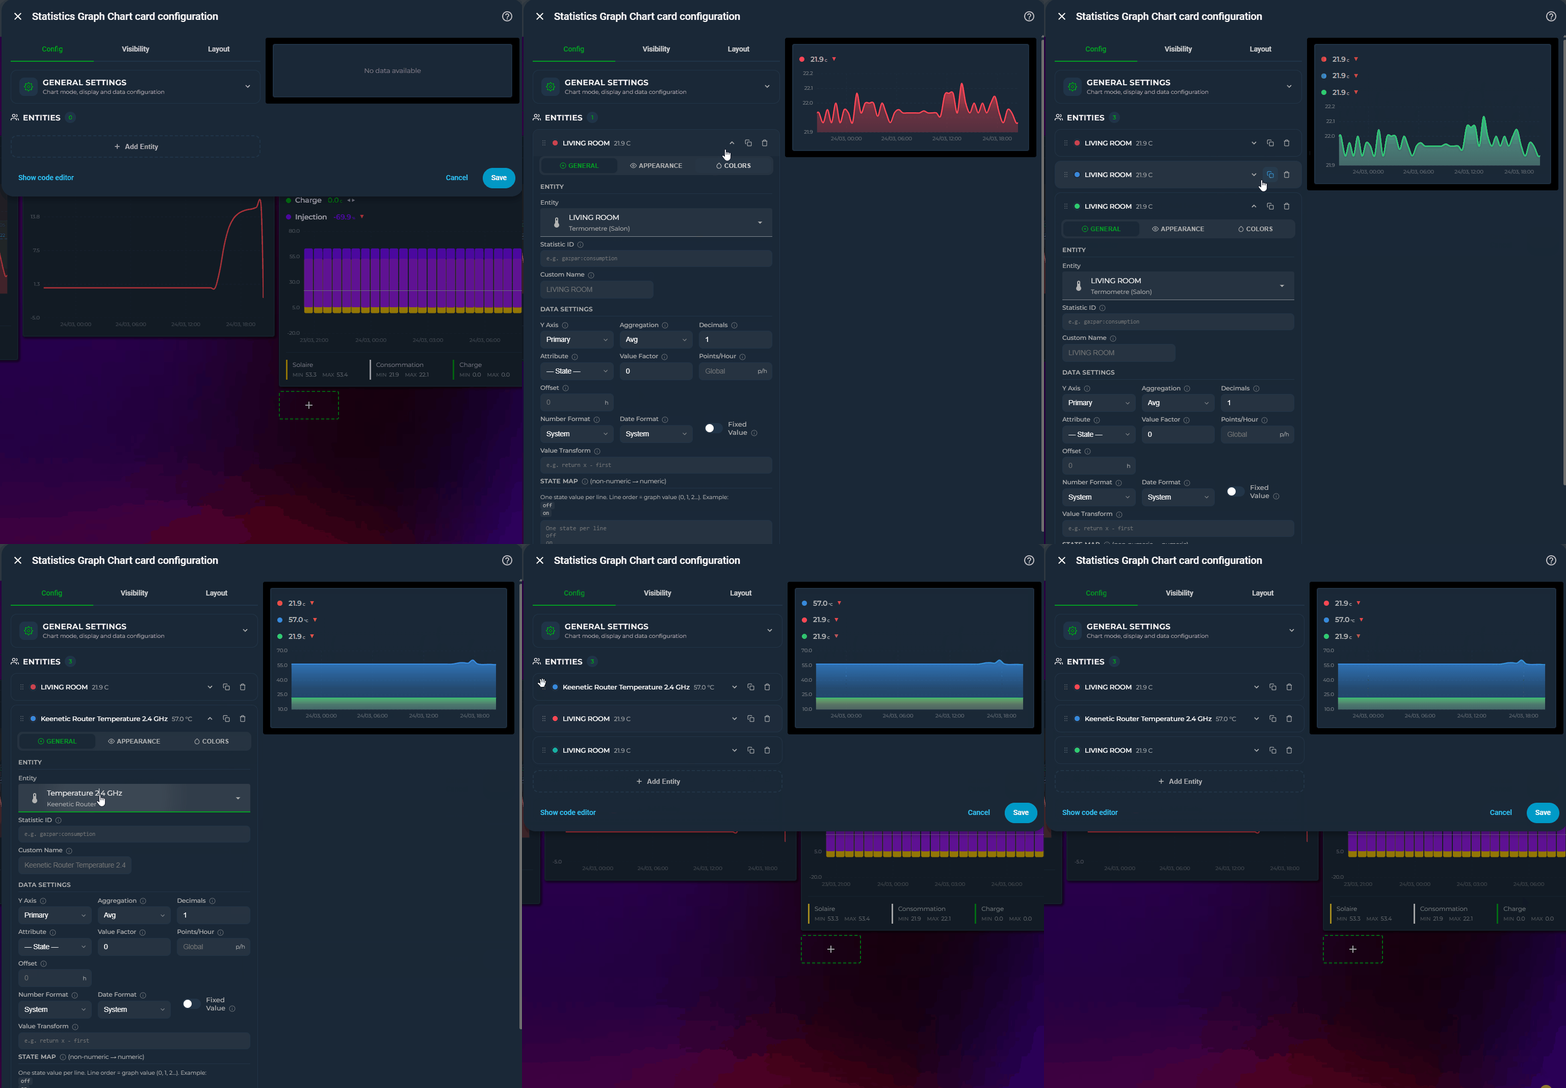
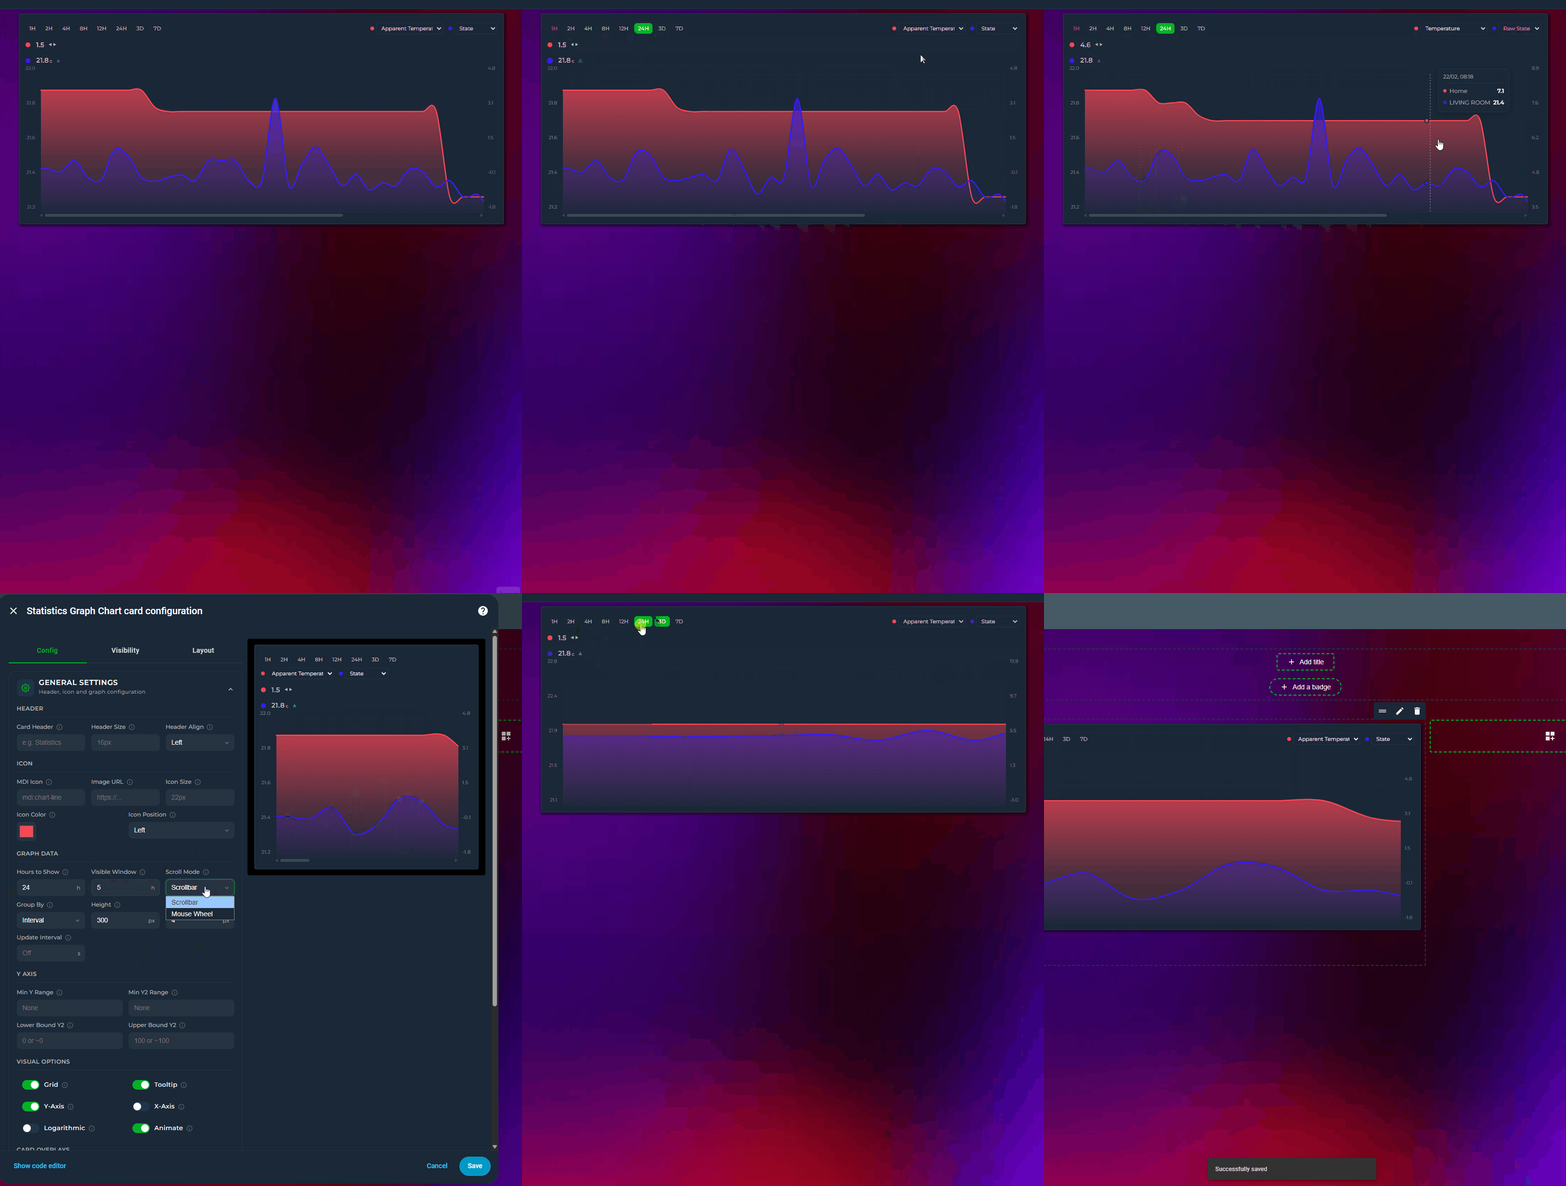
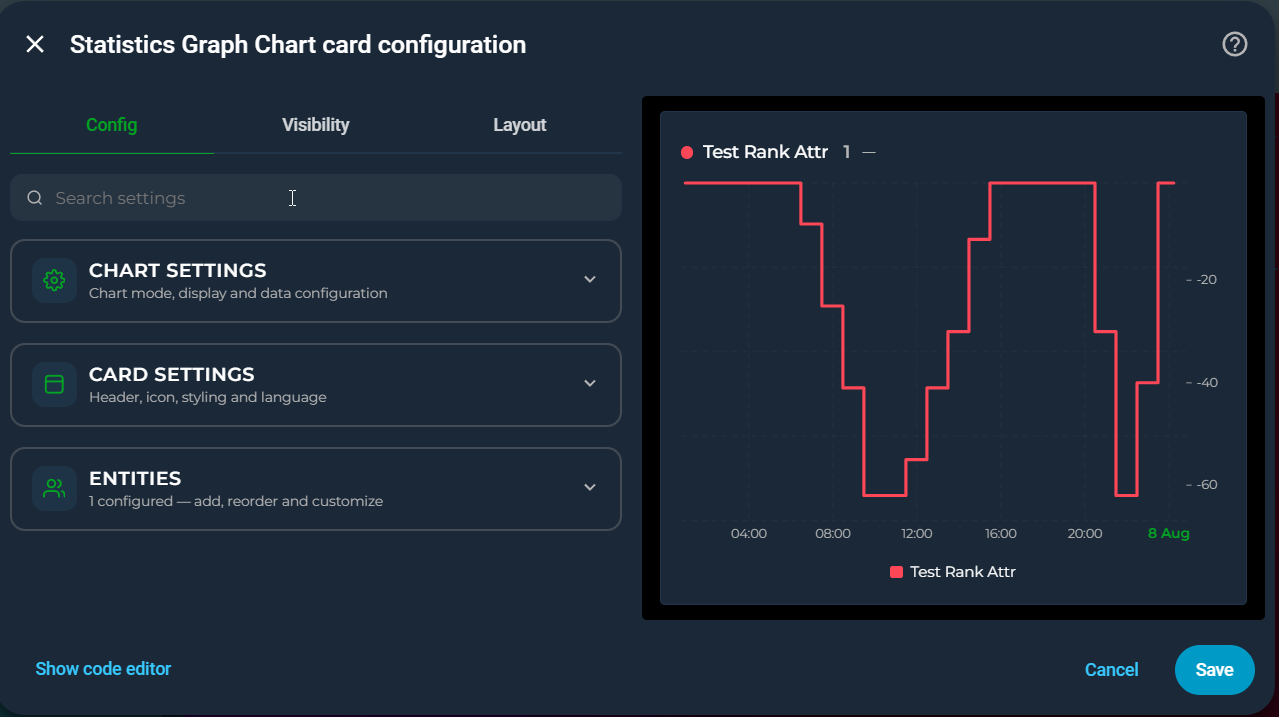
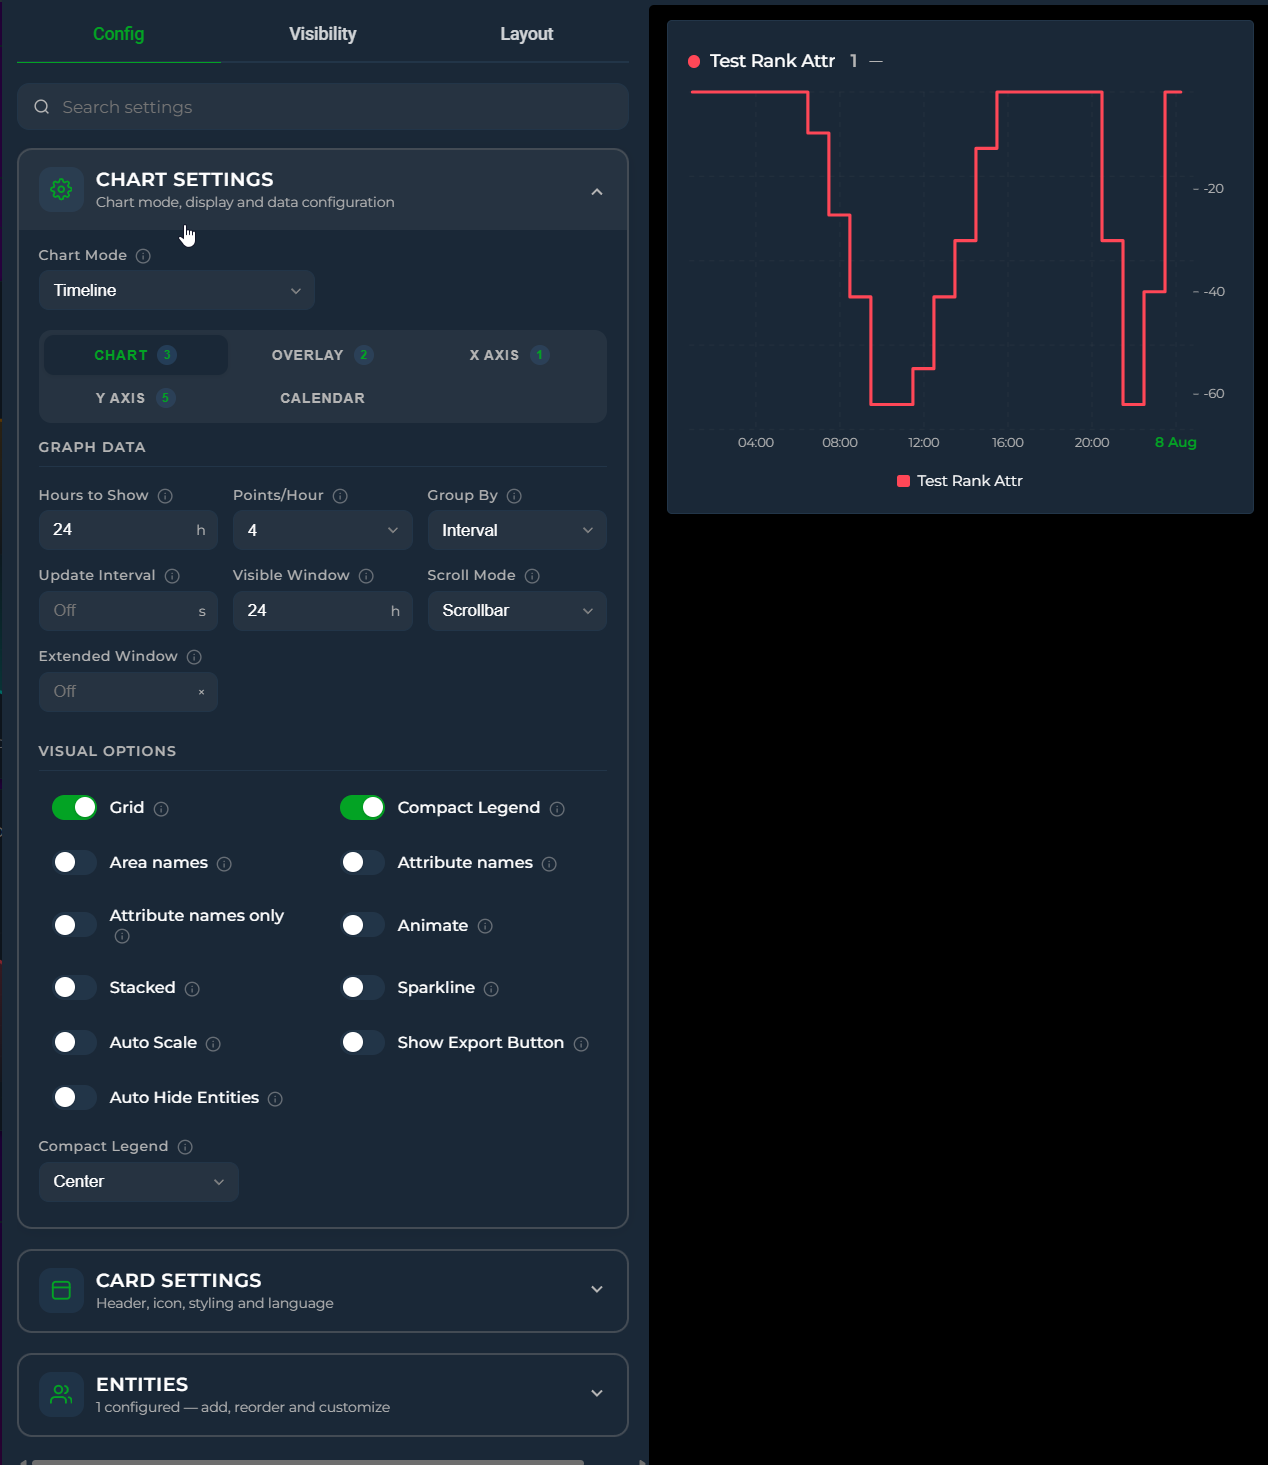
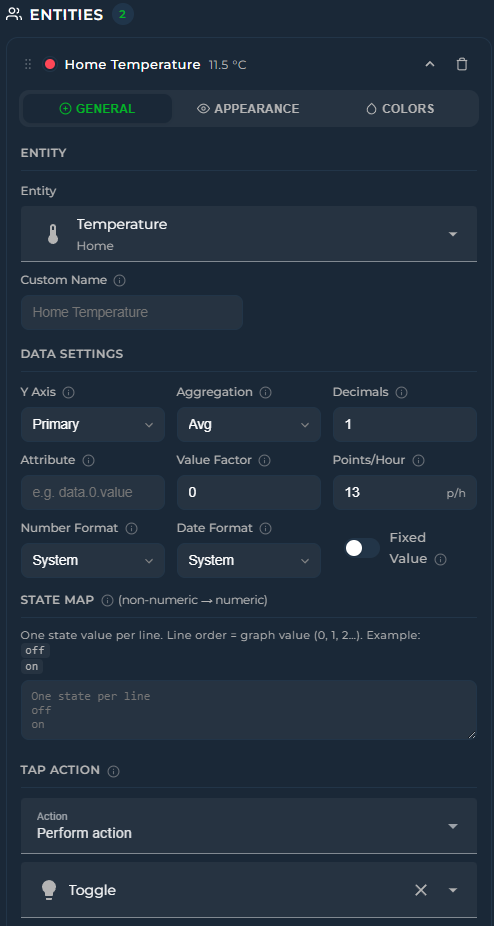
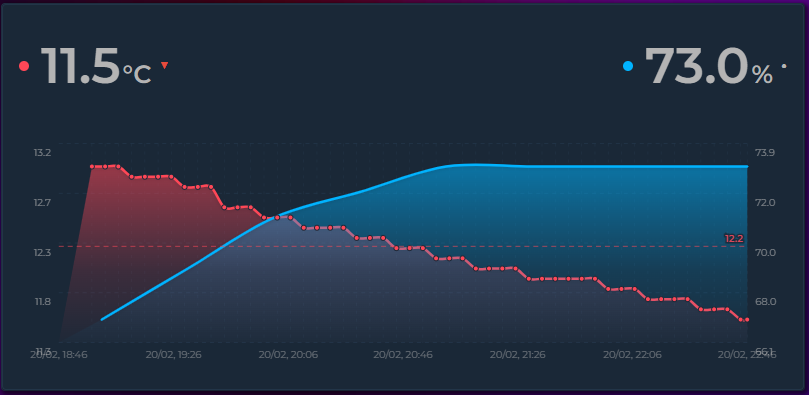
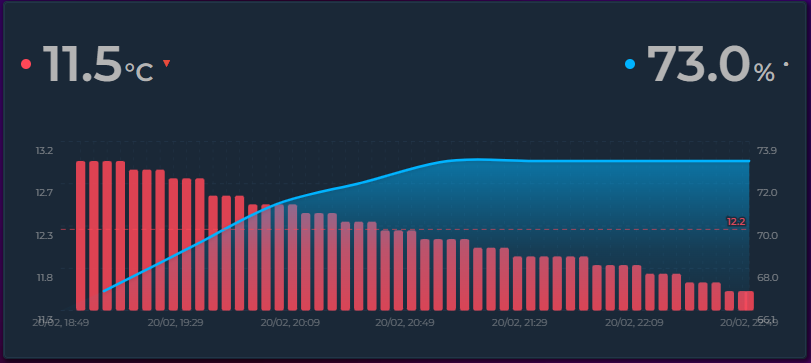
✨ Features
| 📈 | Line, step, and bar charts with smooth Bezier curves |
| 🕯️ | Candlestick (OHLC) charts — render any entity as trading-style candles showing the open, high, low, and close of each time bucket. Green/red up/down bodies with high–low wicks and an O/H/L/C tooltip; recolor with the Rise/Fall Colors feature. Candles snap to clean clock intervals and sit centered on the X-axis ticks |
| 📅 | Built-in Date Picker — navigate Day, Week, Month, Year views with arrow buttons, calendar popup, and preset ranges (Last 7/30 Days, Last 12 Months, up to Last 5 Years). Or open on a rolling window that ends now — Last 1H … Last 5Y — set as the default mode or shown as extra picker buttons. Sync multiple cards with date_picker_group — even cards without a visible picker can follow the group. Customize visible modes with date_picker_modes — lock to a single mode for a minimal nav bar |
| 🪟 | Card styling without card-mod — a styles block for plain CSS inside the card (v4.05), and dedicated options for border radius, border color & width, padding, background image (with smart /local/ path resolution), background blur (image-only — chart and header stay sharp), header color, weight, and letter-spacing directly from the editor. Combine with rgba(...) background colors for translucent cards over images |
| 🔢 | Live state rows with current value, MDI icons, and configurable font sizes |
| 🎯 | Fourteen chart modes — Timeline, State Timeline, Scatter, Pie (donut or 100 % bar), Ranking (horizontal bar), Radial Bar (concentric arcs), Polar Area (variable-radius pie), Radar (spider polygon), Heatmap (days × hours), Calendar (weekly grid), Gauge (needle dial), Box Plot (distribution boxes), Waterfall (running-total bridge), Histogram (value-frequency bars) — selectable from a single dropdown |
| 📦 | Box Plot mode — chart_mode: box draws min / Q1 / median / Q3 / max boxes per time bucket, straight from the dense source samples. Answer "what is this room's daily temperature spread?" at a glance. Bucket width follows group_by or is picked automatically from the window |
| 🪜 | Waterfall mode — chart_mode: waterfall turns each entity into a +/− step of a running total with an automatic Total bar — the classic bridge chart for energy balances and budgets. Steps default to sum; use aggregate_func: diff for cumulative kWh counters and invert: true for subtractions |
| 📊 | Histogram mode — chart_mode: histogram shows the value-frequency distribution over the visible window. Bin count is automatic (Freedman–Diaconis) or fixed via histogram_bins; multiple entities share the same bins side by side |
| 🎛️ | Gauge display — replace the state row with a half-circle gauge showing current value against min/max bounds |
| 🧭 | Gauge chart mode — chart_mode: gauge draws a needle dial per entity in a column grid. The arc fills the value range seen in the period (min → max), the needle marks the live value, and color_thresholds paint the dial. Configurable span, columns, value position/size, and per-entity needle_color |
| ✨ | Sparkline mode — ultra-compact inline graphs with no chrome, ideal for dashboard overview tiles |
| 📊 | Rise/Fall colorization — graph segments automatically change color as values climb or drop, with independent colors for rising, falling, and stable periods |
| ⏩ | Trend icon — a ▲ / ▼ / ━ indicator on each state row shows the current direction of change, calculated over a configurable time window (trend_period_hours), with a per-direction color |
| 🌐 | Locale-aware formatting — control how numbers are displayed per entity (number_format) and how timestamps appear card-wide (datetime_format), independent of your HA locale |
| 🏷️ | Custom unit per entity — override auto-detected units with unit: kWh on any entity. Essential for attributes and unitless sensors |
| 🏠 | Area names — include_area_names: true appends each entity's Home Assistant area to its label (Heating Temperature · Lounge) across the state row, legend, tooltip, stats and exports. Indispensable with integrations like Advanced History that give several entities the same friendly name. use_only_area_name: true shows the area alone — Master Bedroom under each value on a room-by-room climate card (v4.07) |
| 🏷️ | Attribute names — include_attribute_name / use_only_attribute_name label a series by the attribute it plots, so two attributes of the same entity stop sharing one name |
| 🔡 | Axis label customization — adjust font size and opacity of Y-axis and X-axis labels independently for a clean, tailored look |
| 📌 | Axis tick marks — optional small tick lines at each label position, controllable independently for X and Y axes |
| 🕐 | Dynamic Graph Hours — filter data to specific hours each day with graph_start_hour and graph_end_hour. Accepts fixed numbers or sensor entities (e.g. sensor.sunrise_hour) for sunrise-to-sunset views that adapt throughout the year |
| 🛠️ | Full visual editor — every option is configurable through the Lovelace UI without touching YAML; entities can be reordered by drag-and-drop. The editor adapts dynamically: irrelevant options hide based on the selected chart mode |
| ↕️ | Dual Y-axis support (primary + secondary) with per-axis bounds and configurable tick count |
| ↕️ | Independent Y2 axis toggle — show or hide the secondary (right) Y axis labels without affecting the primary axis. Hidden by default; enable it when you want right-side labels |
| ↕️ | Independent Y-axis — y_axis: independent gives each entity its own hidden scale based on its min/max, enabling trend comparison across sensors with wildly different units (°C, %, lux, hPa) on a single graph |
| 🎨 | Color thresholds with direction (vertical gradient or horizontal per-segment) and transition (smooth blend or hard switch). Threshold values and colors can also reference live entities (sensor.x / sensor.x.attribute) |
| 🔺 | Min / Max extrema labels — always on, on click, or never |
| ➖ | Average line — dashed reference at the mean value for the visible window |
| 〽️ | Moving averages — overlay one or more simple moving-average (SMA) lines per entity, each with its own period (in buckets), color, and width, plus an optional on-line label (MA7/MA26, or your own name). The card extends the look-back beyond the visible window automatically, so a long period (e.g. MA26) draws fully even when hours_to_show is short. Averages the close for candlesticks, otherwise the bucket value; drawn on the entity's own Y axis |
| 💬 | Tooltip with crosshair on hover |
| 🌅 | Per-entity gradient fill with same-hue fade — applies to both area charts and bar charts (with rounded corners) |
| ▦ | Grid lines — horizontal + vertical aligned to actual data points |
| 📉 | Logarithmic scale |
| 🔍 | Zoom brush — click and drag on the graph to zoom into a time range; double-click steps back one zoom level, and repeated double-clicks unwind the way back to the full window |
| 🔽 | Drill down — click a single bucket to reload the card for just that period, then click again to go deeper. Double-click steps back out one level. Unlike zooming, this refetches history at the finer resolution the shorter window allows, so it shows detail the original chart did not contain. Picking a new period from the date or interval picker returns you to it |
| 📌 | Annotations — add threshold lines, event markers, time span highlights, and comfort zone bands to the graph. Entity-driven or manual timestamps, with per-annotation opacity and Jinja2 template support. Entity-driven spans and events can also match an entity's attribute instead of its state (v4.03) |
| 🔄 | Tooltip sync — hover one card and see crosshairs on all synced cards, with optional named groups |
| 🔍 | Zoom sync — brush-zoom on one card and every other card in the group jumps to the same time window (double-click anywhere to reset them all) |
| ↔️ | Scroll sync — horizontal scrolling stays in lock-step across all cards in the same group, even when their hours_to_show differ |
| 📊 | Stacked mode — stack line/area/bar entities to show composition |
| ↔️ | Time Offset — per-entity hour offset to overlay the same sensor from different periods on one graph. Supports helper entities (e.g. input_number) for dynamic offset values |
| 〰️ | Soft bounds (~ prefix) — axis expands when data exceeds the bound |
| 🔣 | state_map for non-numeric entities (binary sensors, input selects) |
| 🔗 | Attribute reading with dot-notation nested path support |
| ⏩ | Forward-fill for sparse sensors (e.g. weather entities) |
| 🎨 | Adaptive state color — state row inherits entity line color automatically |
| 🎚️ | Interval picker — quick-select time range buttons (1H–1Y) directly on the card, no editor needed. default_interval names the button it opens on; left unset it reopens on your last pick, and a range that matches no button gets one of its own (v4.04) |
| ⚡ | Auto scale points — automatically reduces data density for longer time ranges, keeping performance smooth |
| 🔀 | Attribute switcher — per-entity dropdown on the card to switch between state and any numeric attribute on the fly |
| 🔍 | Scrollable graph — set a visible window smaller than the data range and scroll horizontally through history |
| ↔️ | Configurable icon position — place the header icon on the left or right side of the title |
| 🏷️ | Compact Legend — color-coded entity name key below the graph with configurable position (left, center, right). Click any legend item to temporarily hide that entity from the graph |
| 📊 | Per-entity legend stats — choose any combination of Min, Avg, Max, Sum, Last and Live for each entity's legend row. Click to toggle entity visibility |
| 🏷️ | Vertical axis labels — optional vertical unit labels on the left and right edges of the graph. Defaults to the entity's unit of measurement, with custom text override |
| 🕐 | Smart X-axis labels — when the time range spans multiple days, midnight ticks automatically show the date (e.g. "28 Mar") while other ticks show HH:mm. Tick density adapts to label width and font size |
| ⬇️ | Bottom state rows — place entity state rows below the graph instead of above with bottom-left, bottom-center, bottom-right alignment |
| 📏 | Grid aligned to tick marks — horizontal grid lines match Y axis tick values exactly |
| 🔀 | Value Transform — apply a JavaScript expression to every data point using x, first, min, max, avg, last, index, plus the time variables t, now, hour and weekday (v4.04) — ideal for normalize-to-zero, splitting sensors, percentage calculations, and time-of-day filters such as return t <= now ? null : x to hide a forecast's past |
| 📏 | Range Band — per-entity min/max shaded band behind the line showing value fluctuation within each data bucket |
| 🏷️ | Data Labels — print the numeric value of every visible data point right above the bar / line / point, ApexCharts-style. Font size adapts automatically to bar width; text renders in the entity color with a card-background halo for readability; on stacked bars each label sits centered inside its own segment. Per-entity opt-in via show_data_labels |
| 🕳️ | Break on Gaps — per-entity toggle to break the line at long unavailable / unknown outages instead of carrying the last known value across the gap |
| ↔️ | Dynamic Y-axis width — axis label areas auto-expand to fit longer numbers without clipping |
| ⚡ | Energy Date Sync — sync the card's time range with HA's Energy dashboard date picker or energy-period-selector-plus |
| 🔌 | External Statistics — display imported statistics that have no regular entity (e.g. gazpar:gazpar_consumption) by setting statistic_id |
| 📅 | Long-range views — group_by: week and month with native HA statistics periods, graph_start anchoring to calendar boundaries, and smart X-axis labels that adapt to the grouping mode |
| ⚡ | Change aggregation — aggregate_func: change uses HA's native change field for energy, gas, and water meters. Combine with group_by: date/week/month for accurate consumption charts |
| 🔀 | Stacked Groups — per-entity stack_group names let you create multiple side-by-side stacked bar groups on a single chart |
| 🎚️ | Per-entity stacking (v4.07) — stacked: false on an entity keeps it out of a stacked card's stacks (plain temperature lines on Y1 next to valve positions stacked as bars on Y2), stacked: true stacks chosen entities on a card that is not stacked. Unset = follow the card |
| 📑 | Chart pages (v4.08) — per-entity graph_group splits one card into several charts: entities that share a group name are drawn together on a page of their own, entities without one stay on the main page, and a strip directly under the graph switches between them — a dot per page with ‹ › beside them, centred. One fetch, one height, one date picker and zoom for all pages; the legend and the state row follow the page on screen. Works in every chart mode |
| 🏷️ | Template names — use {{ state_attr('sensor.x', 'attr') }} with Jinja2 filters (capitalize, upper, replace(), round(), etc.) for dynamic entity names |
| ↔️ | Horizontal state layout — state_layout: horizontal flows entity values side by side instead of stacking vertically |
| 🔢 | Y-axis decimals — card-level y_axis_decimals overrides per-entity decimals for axis labels only, keeping state row precision separate |
| ⏱️ | X-axis interval — x_axis_interval for manual tick spacing (1h–3M) with clean boundary snapping |
| 📅 | Show Full Period — extend the X-axis to cover a complete calendar period (day, week, month, year) with a "now" indicator line, leaving empty space after the current time. Ideal for imported data or comparing today vs yesterday |
| 🔋 | Battery icon — battery_entity displays a color-coded battery level indicator in the header or state row, with configurable low threshold |
| 📡 | Attribute Data Source — read chart data from an entity attribute array (forecast, spot prices) instead of history. Supports future timestamps for EPEX, Nordpool, Tibber, solar forecasts, and weather predictions. Also accepts numeric/categorical time fields (month_of_year, day_of_year, hour_of_day, epoch seconds/ms) so monthly summaries and hourly profiles work without artificial timestamps. Per-point values can also be computed from element fields plus other entities via data_value_expression + data_vars |
| ☀️ | Energy dashboard solar forecast — solar_forecast: true draws the solar forecast your Energy dashboard already shows (Forecast.Solar, Solcast, Open-Meteo …) as its own row, no entity or template sensor needed. Hourly kWh points, daily totals with group_by: date, one source or all of them summed via solar_forecast_source |
| 📅 | Group by Year — group_by: year for multi-year trend views with automatic bar width and X-axis labels |
| 🔄 | Invert bars — per-entity invert: true draws bars downward from zero. Combine with stacked: true for butterfly charts (energy import/export, network in/out) |
| 🔁 | Rolling date picker window — date_picker_step turns the picker into an N-unit rolling window. step: 4 + mode: week shows the last 4 weeks and prev/next jumps a full 4 weeks at a time |
| 💾 | Long-term statistics auto-routing — entities with state_class declared automatically use HA's long-term statistics for ranges beyond recorder retention. Set statistic_id explicitly or use hours_to_show > 240 to opt in for short ranges. A console warning lists entities lacking state_class when the range exceeds retention |
| 📈 | Static data carry-forward — when a sensor stops emitting state changes, the last known value is carried forward to "now" instead of leaving the chart blank. Matches the behavior of HA's built-in statistics card |
| ⚠️ | Offline sensor gaps — when HA reports a sensor as unavailable, the line breaks at that point and resumes when the sensor recovers. Makes it instantly obvious when a sensor was offline versus when its value was simply steady |
| 🎚️ | On-card Points/Hour & Group By pickers — change data resolution and bucketing right on the card; selections persist, take priority over Auto Scale, and "Auto" returns to the configured value |
| 🕐 | Multi-hour buckets — group_by: 2h / 3h / 4h / 6h / 12h (any Nh) for clean multi-hour bars between hour and date |
| 🕒 | Y-axis label formats — show durations (h:mm, mm:ss, d h:mm) or custom {expression} labels per axis; tooltips, data labels, state row and the average label follow automatically |
| 🔗 | Picker group sync — interval_picker_group, pph_picker_group, group_by_picker_group: one visible picker drives every card sharing the group; receivers don't need a picker at all. sync_group sets all four group keys at once (v4.03) |
| 🙈 | Auto Hide Entities — start with every series hidden and reveal only what you need from the legend |
| 📍 | Date picker layout — place the ‹ date › navigator and the D/W/M/Y shortcuts left / center / right, independently |
| 🥧 | Pie chart styles — pie_style presets (Classic, Thick, Donut, Thin, and Bar — the pie as one full-width 100 % bar) with optional pie_3d depth effect, pie_spacing for gaps between slices, and automatic rounded slice corners. Slice labels show the actual value with unit. Customize slice and center label fonts/colors with pie_label_font_size, pie_label_color, pie_label_outside_color, pie_center_font_size, and pie_center_color — all accept theme variables |
| 🎯 | Snap-to-data tooltips — hovering over a line graph snaps the tooltip and dot to the nearest real data point instead of interpolating fake values between samples. The crosshair line aligns with the snapped point too, so what you see is exactly what your sensor recorded |
| 🔤 | Theme-aware fonts — every canvas-rendered chart (Pie, Heatmap, Calendar, Ranking, Radial Bar, Polar Area, Radar, Gauge, axis labels) uses your active HA font (--primary-font-family) instead of generic sans-serif |
| 🧹 | Clean YAML output — the visual editor only writes fields you've actually customized. New cards start with 5 lines, not 80. Toggle a setting and it appears in YAML; revert to default and it disappears. Explicit overrides are always preserved |
| 🏷️ | Y-axis state names — when graphing entities with state_map (washing machines, alarm panels, media players), the Y-axis automatically shows the original state names (idle, running, done) instead of 0, 1, 2. Optional friendly labels supported via value, label in the editor |
| 🎨 | Custom axis colors — y_axis_color, x_axis_color, and x_axis_date_color let you color-match the axis labels and tick marks to your dashboard theme; axis_style: native makes the axes, grid and per-entity legend look exactly like Home Assistant's own charts (v4.03, legend added in v4.04) |
| ✨ | Bar hover highlight — bars brighten on mouse hover so it's obvious which bar a tooltip refers to, especially in stacked or multi-entity charts. On mobile, the highlight persists while the finger is held down via a JS-managed class (CSS :hover is unreliable on touch devices) |
| ✨ | Period highlight — on bar charts, hovering a bar shades the background band of that whole period so it's clear where each period starts and ends, even with several entities side by side. Toggle with period_highlight and recolor with period_highlight_color; works with or without the tooltip |
| 🎨 | Color templates — all color fields (color, icon_color, state_color, point_colors, axis/grid colors) accept Jinja2 {{ }} templates evaluated server-side by HA via render_template WebSocket subscriptions. Use a central sensor.entity_colors to manage all entity colors from one place. In the editor, the color picker automatically dims when a template is detected |
| 📅 | graph_start: tomorrow — sets the graph window to tomorrow 00:00 → end of day, perfect for displaying next-day spot prices (Nord Pool, EPEX, Tibber) via data_attribute. The window extends into the future automatically without requiring show_full_period |
| 📏 | Grid customization — per-axis control over grid line appearance: y_grid_style / x_grid_style (dashed, solid, dotted, long-dash), y_grid_width / x_grid_width (thickness in px), y_grid_color / x_grid_color (any CSS color or template), and y_grid_opacity / x_grid_opacity to dial the grid up or down without retyping rgba colors. All configurable from the editor's Y Axis and X Axis tabs |
| 📱 | Mobile touch improvements — tooltip appears instantly on first tap (no finger movement needed). Long-press (600ms) + drag activates brush zoom; a quick slide shows the tooltip. Bar highlights persist while the finger is held down |
| 🥧 | Pie/Radial decimals — entity decimals setting now controls the precision of percentage labels in slice labels, tooltips, and radial bar overlays — not just the value display |
| 🔮 | Forecast Horizon — per-entity forecast_horizon: N shifts each recorded data point along the X-axis. Positive values (e.g. 1) shift forward — for sensors whose current state predicts T+N hours ahead (e.g. Solcast PV forecast in 1 hour); the X-axis is extended automatically to keep the shifted line visible. Negative values (e.g. -24) shift backward — useful with attribute-based forecasts to overlay tomorrow's data onto today's chart. Independent from offset — both can be combined |
| ⏱️ | Now Line — a vertical marker showing the current moment, enabled by default. Customize now_line_color, now_line_opacity, now_line_width, and now_line_style (solid, dashed, dotted, long-dash) or disable with show_now_line: false |
| 🗂️ | Z-Index layering — per-entity z_index sets which curve is drawn in front (higher = on top, lower or negative = behind). Independent of the legend / state-row order, so you can layer overlapping lines, bars or bands without reordering your entities |
| 📆 | Weekday on the X-axis — datetime_format understands ddd / dddd, so multi-day and "last N days" views can label day boundaries with the day name (Mon / Mo / Pzt …, localized). Use dddd alone for just the day name; the intraday clock keeps showing the time |
| 📐 | Round Y-axis ticks — the Y axis picks clean round numbers (0, 500, 1000, 1500) that fit within your data range without expanding it. Enabled by default; disable with y_axis_round_ticks: false |
| 🎯 | Primary Value dropdown — primary_state_as controls what the big value in the state row shows: live state (default), last aggregated point, or Sum / Avg / Min / Max / First over the visible window. Ideal for clean header-only entities |
| 📊 | Show Range — show_range_values: true displays the visible window's min and max as a subdued (min → max) suffix next to the primary value. Perfect for compact "records" cards (show_graph: false + primary_state_as: min/max) where the range previously was only reachable via the graph tooltip |
| 📑 | Stacked name layout — name_position: below places the entity name centered below the primary value (ApexCharts-style), great for mobile and header-only entities |
| 🎨 | Card shadow & border toggles — card_shadow: false and card_border: false allow a flat borderless look or blending with decorated backgrounds |
| 👥 | Period Comparison — per-entity compare overlays a faded, dashed ghost of the same sensor from a previous period (yesterday, last week, last month, last year, or any number of hours) underneath the main series. Also accepts a list of comparisons — one ghost per entry, each reaching further back via periods_back (previous period, two periods ago, …). Calendar-aware shifting in the date picker's Month/Year modes, a Δ% delta in the tooltip, and legend clicks that toggle main + ghosts together. On State Timeline charts each comparison renders as its own time-aligned row under the main entity (v4.02), and layout: sequential draws the previous period at its real position before the live data on a backward-extended axis (v4.02) |
| 🧩 | Boolean template toggles — display toggles like show_legend, stacked, show_points, or show_state accept Jinja2 {{ }} templates as well as plain booleans, resolved live server-side — drive card chrome from an input_boolean without editing YAML |
| 🏷️ | State timeline labels toggle — state_timeline_show_labels: false hides the state labels drawn inside state_timeline segments for clean, label-free color bands |
| 🚦 | State timeline slices (v4.08) — state_timeline_bucket: 1h (or 15m, 1d, 1w, 1mo …) cuts every State Timeline row into equal time slices, each in the colour of the state that lasted longest in it — an uptime view per hour or day. With color_thresholds a slice is coloured by the share of one state (share_state) instead, slices without data are muted grey, the tooltip lists the share of each state, and state_timeline_show_share: true writes the share at the end of every row (On 99.6%) |
| 🧲 | Raw grouping — group_by: raw skips bucketing entirely and draws every recorded sample at its exact timestamp — ideal for step charts of binary/state sensors |
| 🤏 | Pinch zoom & zoom history — two-finger pinch on touch devices zooms the timeline live around the gesture midpoint; any pinch angle works (the gesture measures the true 2D finger distance) and zoom responds on an amplified curve, so small real-world pinches zoom meaningfully — pinching inward zooms out just as strongly, all the way back to the full window. Every committed zoom (brush or pinch) is pushed onto a history stack (up to 20 levels) — double-click / double-tap steps back one level at a time instead of resetting fully. Works with cross-card zoom_sync |
| 📥 | PNG / CSV export — show_export: true overlays a small download icon on the card with a three-item menu: a 2× PNG of the chart, a 2× PNG of the whole card (header, chart, state row and legend), or a wide-format CSV (ISO 8601 UTC time column, one column per visible series, Excel-friendly UTF-8 BOM). A zoomed chart exports exactly the zoomed range — export what you see |
| ➖ | Two-entity math — per-entity ref_entity + ref_op combines a series with a second entity over time (subtract / add / multiply / divide). Plot indoor − outdoor, production − consumption, or target vs actual with no template sensor; the reference is sampled as a step function so each point is combined with the value valid at that moment |
| 💶 | Cost view — per-entity price_entity multiplies a series by the value of another entity over time (spot price, tariff sensor). The price is read as a step function from the price entity's own history and applied per consumption slice before bucketing, so every bucket is an exact Σ(value × price). Ideal with aggregate_func: change on energy counters — set unit to your currency and the kWh chart becomes a cost chart |
| ⚡ | Custom auto-scale rules — card-level auto_scale_rules teaches Auto Scale your thresholds: each rule maps a visible period ("up to N hours") to a Group By and optionally a Points/Hour. The smallest matching threshold wins; periods beyond every threshold fall back to the built-in auto scale |
| 📊 | State strips (v4.03) — graph_type: state_strip on an entity draws its states as coloured bands under the X axis of a Timeline card, so device activity reads against the curves above it. Colours and names come from state_map; state_strip_height and state_strip_labels control the look Since v4.05 state_strip_titles writes each strip's name above its band, and a live enabled: "!input_boolean.x" hides strips from one helper on every card. |
| 🎛️ | Controller card (v4.03) — custom:statistics-graph-chart-controller is a chart-less one-row card holding only the date-picker bar: calendar periods, rolling windows (1H … 5Y) and a Reset button that drive every chart sharing its sync_group |
| 📍 | Crosshair pins (v4.03) — with crosshair: true a tap or click pins the tooltip in place, and crosshair_pins: 2 compares two points in time with a per-series Δ and percentage. Zoomed charts also pan with one finger |
📑 Table of Contents
| Section | Description |
|---|---|
| Installation | HACS and manual setup |
| Quick Start | Minimal YAML to get started |
| Configuration | Card-level and entity-level options |
| Chart Modes | Timeline, State Timeline, Candlestick, Scatter, Pie, Ranking, Heatmap, Calendar, Radial Bar, Polar Area, Radar, Gauge, Box Plot, Waterfall, Histogram |
| Feature Guides | Grouped guides: Time & History, Data Sources & Math, Layout & Appearance, Zoom & Tools, Multi-Card Sync, Templates |
| Examples | Ready-to-use YAML configurations |
| CSS Styling | card-mod recipes and class reference |
| Reference | Aggregation functions, date formats, bounds, tap actions |
| Visual Editor | Editor tabs, drag-and-drop, dynamic behavior |
📦 Installation
HACS (recommended)
- Open HACS
- Search from the search bar: Statistics Graph Chart Card
- Install Home Assistant - Statistics Graph Chart Card
- Hard-refresh your browser
HACS installs translations.js (the card's 16 interface languages) together with the card file and updates both at once.
Manual
- Download
Home Assistant - Statistics Graph Chart Card.jsandtranslations.jsfrom the latest release - Copy both to
/config/www/— the card loadstranslations.jsfrom the folder it sits in; without it the card works, but its labels stay in English - Add the resource in Settings → Dashboards → Resources (the card file only —
translations.jsneeds no resource entry):
url: /local/Home Assistant - Statistics Graph Chart Card.js
type: module
🚀 Quick Start
type: custom:statistics-graph-chart-card
card_header: Living Room
entities:
  - entity: sensor.temperature_living
    name: Temperature
    color: "#ff6b35"
No YAML needed? The card has a full visual editor built in. Click the pencil icon on any card in the Lovelace UI to configure everything — including rise/fall colors, trend settings, and number formats — without writing a single line of YAML. See Visual Editor for details.
⚙️ Configuration
Show card-level and entity-level option tables
🃏 Card Options
These options apply to the whole card.
| Option | Type | Default | Description |
|---|---|---|---|
chart_mode |
string | "timeline" |
Chart visualization mode. See Chart Modes. timeline | scatter | pie | ranking | radialbar | polararea | radar | heatmap | calendar | gauge | box | waterfall | histogram |
sparkline |
boolean | false |
Compact mode — strips all chrome (header, axes, grid, toolbar) and renders tiny inline graphs. See Sparkline Mode. Only available in Timeline mode. |
waterfall_total |
boolean | true |
Waterfall mode only — append the automatic Total bar (running total from zero) at the end. Set false to hide it. |
histogram_bins |
number | auto | Histogram mode only — fixed number of bins (2–80). Leave empty for automatic bin sizing via Freedman–Diaconis (clamped to 5–40). |
card_header |
string | "" |
Title shown at the top. Leave empty to hide. |
card_icon |
string | null |
MDI icon next to the title, e.g. mdi:thermometer |
card_icon_image |
string | null |
URL to a custom image. Overrides card_icon. |
card_icon_color |
string | null |
Color of the header icon (CSS color). Set to "threshold" to color dynamically based on the first entity's value and its color threshold rules. |
card_header_size |
string | null |
Font size of the title and battery icon. The battery indicator scales proportionally with this value. Accepts CSS values like 16px or 1.2em. |
card_icon_size |
string | null |
Size of the header icon, e.g. 22px |
card_icon_position |
string | "left" |
Header icon position: left or right |
card_shadow |
boolean | true |
Show the default HA card drop shadow. Disable for a flat look or when the card sits on a decorated background. |
card_border |
boolean | true |
Show the default HA card border. Disable for a cleaner borderless appearance. |
battery_entity |
string | null |
Entity ID reporting battery level (0–100%). Shows a color-coded battery icon with percentage in the header (when header exists) or state row (when no header). See Battery Icon. |
battery_low_threshold |
string/number | 20 |
Battery percentage below which the icon turns red. Accepts a number, entity ID (sensor.x), or entity attribute (sensor.x.attribute). |
align_header |
string | "left" |
Header alignment: left / center / right |
state_layout |
string | "default" |
State row layout: default (vertical stack) or horizontal. Horizontal flows entities side by side in a single row, wrapping if needed. Left/center/right placement of individual rows is per entity, via align_state. |
chart_align |
string | "center" |
Horizontal alignment of the Ranking chart within the card. center (default) keeps the chart centered. left pins it to the left edge — the name-label strip shrinks so bars start closer to the left. right mirrors the layout to the right edge — bars grow from right to left with name labels on the right. Ranking mode only. |
hours_to_show |
number | 24 |
Hours of history to load and display. Ignored whenever graph_start is set (day, tomorrow, week, month, year) — the anchored period defines the range instead. |
points_per_hour |
number | 2 |
Data points fetched per hour (global default). Integer only. The editor offers the common divisors of 60 (1, 2, 3, 4, 5, 6, 10, 12, 15, 20, 30, 60) so buckets tile an hour cleanly; YAML still accepts any integer. On a series drawn from long-term statistics the bucket is never finer than the statistics row the card requested — 5 minutes up to 7 days, 1 hour up to 90 days, 1 day beyond — so a finer value is raised to the row period (group_by: interval only; calendar and Nh groupings are unaffected). |
auto_scale_points |
boolean | false |
Automatically pick bucket size and group_by based on the visible time window. Falls back to the configured values when any entity uses offset, forecast_horizon, data_attribute or solar_forecast. See Auto Scale Points. |
auto_scale_rules |
list | null |
Custom thresholds for Auto Scale — only active when auto_scale_points: true. Each rule maps a visible period to a bucketing: up_to_hours (number, required), group_by (same values as the main group_by — interval, hour, any Nh like 2h, date [day is accepted as an alias], week, month, year, raw), and an optional points_per_hour (only meaningful for group_by: interval). The smallest matching threshold wins; periods beyond every threshold fall back to the built-in auto scale. While Auto Scale is on, the resolved rule fully overrides the main group_by (bucketing and data fetching); the main value only applies when Auto Scale is off. See Auto Scale Points. |
height |
number / auto |
150 |
Graph area height in pixels. Set to auto (or leave the editor's Height field empty) to fill the space the card is given instead — a Sections grid cell, or the whole view in a Panel view (v4.03). See Sections Auto-height. In State Timeline mode the card is as tall as its rows instead (v4.08). |
group_by |
string | "interval" |
Bucketing strategy: interval / hour / 2h / 3h / 4h / 6h / 12h (any Nh works) / date / week / month / year / raw. Multi-hour values create fixed-width buckets aligned like hour: bucket edges sit on local midnight and every N hours after it in the card's time zone (6h → 00:00, 06:00, 12:00, 18:00), also across a DST change. When set to week, month, or year, data is fetched using native HA statistics periods for accuracy and performance. See Long-Range Views. raw skips bucketing entirely — every recorded sample is drawn at its exact timestamp and points_per_hour is ignored — ideal for step charts of binary/state sensors. See Raw Grouping. Since v4.05 an entity may carry its own group_by; the chart's grid is then the finest grouping in use and coarser series are drawn as calendar cells on it (e.g. monthly bars behind daily values) — see Mixing groupings in one chart. |
update_interval |
number | null |
Auto-refresh interval in seconds (minimum 5 — lower values are raised to 5 to protect your database). Empty = HA events plus a gentle background refresh; 0 disables background polling entirely. (0 = off since v4.01) |
data_source |
string | "auto" |
Where the card reads its data from: auto (raw history for short windows, statistics for long ones; a date-picker view of a day or less within the last ~10 days counts as a short window (v4.04); a short window whose raw history does not cover its start falls back to statistics for that sensor (v4.06) — and since v4.02 it auto-detects flood-level sensors: on a window of at least 6 hours, a history response over 5,000 rows and 200 rows/hour flips that sensor to statistics, remembered in the browser for 7 days, with a one-time console note. A flagged sensor still falls back to raw history whenever you ask for finer detail than statistics can give — a window of 12 hours or less bucketed below the 5-minute statistics period (v4.03)), statistics (always route through long-term statistics when available — measured 287 rows/33 ms vs 21,995 rows/1.7 s for the same 24 h window of a websocket price feed), or history (force raw history; also opts an entity out of the auto-detection). Statistics values come from 5-minute buckets, so they are close but not tick-identical, and their averages are weighted by time (Home Assistant's mean) while raw history averages each recorded reading once — a sensor that changes rarely can therefore show a different avg on a 24-hour card (raw history) than on a 48-hour card (statistics). Also available per entity (entities[].data_source). YAML only. (v4.01, auto-detection v4.02) |
debug_fetch |
boolean | false |
Log every backend fetch to the browser console ([sgc fetch] — entities, transport (ws / rest), row count, duration, cache/inflight hits). For diagnosing database load. YAML only. (v4.01) Since v4.03 raw history is requested over the WebSocket (history/history_during_period) like Home Assistant's own history cards, so it no longer produces "invalid authentication" log entries when an access token expires mid-session; the REST history API is used only as a fallback on very old Home Assistant builds. |
extended_window_multiplier |
number | null |
(new in v3.29) Scrollback for the selected period: renders N× the period and opens scrolled to the newest part — the screen shows exactly the period you picked (same scale and buckets as without scrolling) and you can scroll back through the extra history. Follows the date picker: a Week view with 2 keeps one extra week scrollable behind the current one; the picker's header and arrows stay on the selected period. 1/empty = off. Overrides max_visible_interval while active. Timeline mode. |
bar_spacing |
number | 4 |
Gap between bar columns in pixels. Timeline mode only. |
bar_corner_radius |
number | null (auto) |
Corner radius of bars in pixels. Unset = automatic (up to 5 px, and never more than half the bar's width or height, so short bars no longer turn into ovals). 0 = square corners (negative values count as 0). In stacked charts only the outer end of each stack is rounded (up to the outer segment's own height) — the segments below stay square, so a stack reads as one bar; a stack with a single bar series keeps all four corners, unless an inverted (invert: true) series stacks against it — then both are square at the zero line and read as one bar through zero (v4.05). Timeline mode only; also in the editor's Chart tab, below Bar Spacing. (v4.03) |
stacked |
boolean | false |
Stack entities on top of each other. Timeline mode only. Each entity can override it with its own stacked (v4.07): false keeps that entity out of every stack on a stacked card, true stacks it on a card without this toggle. See Stacked Mode. |
min_bound_range |
string/number | null |
Minimum span of the primary Y axis. Also accepts an entity ID (e.g. input_number.axis_span) — the axis re-snaps the moment that helper changes, and a state that isn't a number means no minimum span. The editor field takes it too — it is free text, like the other bound fields. (entity support new in v4.04) |
min_bound_range_secondary |
string/number | null |
Minimum span of the secondary Y axis. When combined with a locked lower_bound_secondary / upper_bound_secondary, the range grows only away from the locked edge — it won't push a locked bound past zero. Also accepts an entity ID, same rules as min_bound_range. (entity support new in v4.04) |
lower_bound |
string/number | null |
Hard or soft minimum for the primary Y axis. See Bounds. |
upper_bound |
string/number | null |
Hard or soft maximum for the primary Y axis. See Bounds. |
lower_bound_secondary |
string/number | null |
Hard or soft minimum for the secondary Y axis. See Bounds. |
upper_bound_secondary |
string/number | null |
Hard or soft maximum for the secondary Y axis. See Bounds. |
y_axis_ticks |
number | 4 |
Number of tick marks (grid lines + labels) on the Y axis. |
y_axis_decimals |
number | null |
Number of decimal places for Y-axis labels. Overrides per-entity decimals for axis labels only — state row values are not affected. Leave empty for auto. |
y_axis_number_format |
string | "system" |
Controls how Y-axis tick numbers are formatted. system follows HA's locale (default); comma forces European style (1.234,56); dot forces American style (1,234.56). Independent from per-entity number_format, which still drives state row, tooltip and data label formatting. Pick the one that matches the audience of the dashboard. |
y_axis_round_ticks |
boolean | true |
Snap Y-axis tick values to clean round numbers (e.g. 0, 500, 1000, 1500) that fit within the data range without expanding it. Produces tidy, evenly-spaced labels similar to Excel's default. Disable to let tick values follow the exact data range. |
show_y_axis_label |
boolean | false |
Show vertical unit labels on the left and/or right edge of the graph. When enabled, defaults to the unit of the first visible entity on that axis that has one (a per-entity unit wins over the sensor's own unit). Hide the last entity on a side — legend click or show_graph: false — and that side's label goes with it; entities on an independent Y axis do not feed the left label (v4.03). |
y_axis_label |
string | null |
Custom text for the left (primary) vertical axis label. Overrides the auto-detected unit. Requires show_y_axis_label: true. |
y2_axis_label |
string | null |
Custom text for the right (secondary) vertical axis label. Overrides the auto-detected unit. Requires show_y_axis_label: true. |
y_axis_format |
string | null |
Custom label format for the primary axis: a duration shorthand (h:mm, h:mm:ss, mm:ss, d h:mm) or a safe {expression} template (e.g. {fixed(value/1000,1)} kW). Also drives tooltips, data labels, the state row and the average-line label for entities on this axis. See Y-Axis Label Formats. |
y2_axis_format |
string | null |
Same as y_axis_format, for the secondary (right) axis and the entities plotted on it. |
duration_unit |
string | "s" |
Unit of the raw sensor value when a duration shorthand is used: s / ms / min / h — e.g. 5400 with h:mm shows 1:30. Ignored by {expression} templates. |
axis_style |
string | "subtle" |
How the axes, grid and per-entity legend are drawn. subtle (default) is the card's own look: labels in the theme's secondary text colour with reduced opacity and a faint neutral grid. native matches Home Assistant's built-in charts: labels and date markers in --primary-text-color at 12 px, grid lines in --divider-color at full opacity, so the card follows light, dark and custom themes exactly like the core statistics-graph card. (v4.04) native also restyles the per-entity legend (show_in_legend): entity names and stat values take --primary-text-color at full strength and the values grow from 11 px to the axis labels' 12 px. There is no legend-only switch — axis_style: subtle is the way back. The compact legend (show_legend) is unchanged. Any axis or grid option you set explicitly still wins. The axis and grid half applies wherever the X Axis tab is available (Timeline, State Timeline, Scatter, Heatmap, Calendar). (v4.03, widened in v4.04) |
y_axis_font_size |
number | null |
Font size of Y-axis numeric labels in pixels. Default is 10. |
y_axis_font_opacity |
number | null |
Opacity of Y-axis labels. 0 = invisible, 1 = fully opaque. Default is 0.65. |
y_axis_color |
string | null |
Custom color for Y-axis labels and tick marks. Accepts any CSS color (hex, rgba, color name) or a CSS variable like var(--my-color). Leave empty for theme default. |
x_axis_font_size |
number | null |
Font size of X-axis time labels in pixels. Default is 10 (9 in Heatmap). Applies in Timeline, State Timeline, Scatter, Heatmap and Calendar. |
x_axis_font_opacity |
number | null |
Opacity of X-axis labels. 0 = invisible, 1 = fully opaque. Default is 0.5 in Timeline / State Timeline (0.55 in Scatter, 1 in Heatmap and Calendar). Applies in Timeline, State Timeline, Scatter, Heatmap and Calendar. |
x_axis_color |
string | null |
Custom color for X-axis time labels and tick marks. Accepts any CSS color or CSS variable. Leave empty for theme default. Applies in Timeline, State Timeline, Scatter, Heatmap and Calendar. |
x_axis_date_color |
string | null |
Custom color for X-axis date markers (the bold date dividers shown in 12+ hour views). Defaults to --primary-color so dates stand out. Set to match x_axis_color for a uniform axis. In State Timeline it colors the labels when the visible range spans more than a day, and defaults to the X label color there. |
pie_style |
string | "donut" |
Pie chart visual preset: classic (full pie), thick (wide donut), donut (default), thin (narrow ring) or bar (one full-width horizontal bar — one segment per entity in configured order, each as wide as its share of the total; with height unset the chart area is 28 px tall). Pie mode only. |
pie_spacing |
number | 0 |
Gap between pie slices in degrees (0–15). Spaced slices automatically get rounded corners. Pie mode only, donut styles only. In the bar style the value is a gap in pixels between the segments, and spaced segments get rounded corners. |
pie_3d |
boolean | false |
Adds depth and a perspective effect to the pie chart with subtle shadows and a glossy highlight on top. Works with any pie_style except bar. Pie mode only. |
pie_label_font_size |
number | null |
Font size in pixels of slice value labels (the per-slice numbers like "21.1 kWh"). Leave empty for auto-size based on chart radius. Pie mode only. |
pie_label_color |
string | null |
Color for slice value labels. Accepts any CSS color (hex, rgba, name) or CSS variable like var(--accent-color). Leave empty for auto white (high contrast against any slice color). Labels placed outside the ring (slices under 5 % of the total) use pie_label_outside_color instead. Pie mode only. |
pie_label_outside_color |
string | null |
(v4.07) Color for the value labels drawn outside the ring, at the end of a leader line, when a slice is too small to hold its number (under 5 % of the total). Accepts any CSS color (hex, rgba, name) or CSS variable like var(--primary-text-color). Leave empty for the theme text color, so these labels stay readable on the card background in light and dark themes alike. Not used by the bar style. Pie mode only. |
pie_label_format |
string | "value" |
What to show inside each pie slice: value (number with unit, e.g. "42.0 kWh"), percentage (share of the total, e.g. "23%"), or both (value followed by percentage). Precision is controlled by the entity's decimals setting — affects both value and percentage display. In the bar style a label that does not fit inside its segment is left out. Pie mode only. |
pie_center_font_size |
number | null |
Font size in pixels of the center total value shown in the donut hole. Requires show_tooltip_total: true. Leave empty for auto-size. Not used by the bar style. Pie mode only. |
pie_center_color |
string | null |
Color of the center total value and its sub-label (which inherits the same color with reduced opacity). Accepts any CSS color or variable. Leave empty for the theme default. Not used by the bar style. Pie mode only. |
x_axis_interval |
string | null |
Manual X-axis tick spacing. Values: 1h–12h, 1d, 2d, 7d, 1w, 2w, 1M, 3M. Ticks snap to clean boundaries (hour starts, midnight, Mondays, 1st of month). Leave empty for auto. |
x_axis_datetime_format |
string | null |
Custom pattern for the X-axis tick labels, independent of datetime_format (which drives the tooltip). Same tokens: YYYY YY MMMM MMM MM DD dddd ddd HH hh mm ss A a. Examples: MMM → Jan, Feb…; ddd DD → Mon 27, Tue 28…. ⚠️ mm = minutes, MM = month — a time-of-day pattern is HH:mm, not HH:MM (that prints hour:month, e.g. every label ending in :08 in August). Also available per rule inside auto_scale_rules. YAML only. (v3.34) |
datetime_format |
string | "system" |
Controls how timestamps appear on the X-axis, tooltips, and extrema labels. See Date Formats. |
show_grid |
boolean | true |
Show grid lines. Available in Timeline and Scatter modes. |
show_cell_values |
boolean | true |
Print each cell's value inside the Heatmap / Calendar boxes. Turn off for a clean colour-only grid — exact values stay available in the hover tooltip. The editor toggle sits next to Grid in the Chart tab. (v3.34) |
y_grid_style |
string | "dashed" |
Line pattern for horizontal (Y-axis) grid lines: dashed, solid, dotted, or long-dash. Also accepts a custom SVG stroke-dasharray like 6 2 2 2. |
y_grid_width |
number | 1 |
Thickness of horizontal grid lines in pixels. Accepts decimals like 0.5. |
y_grid_color |
string | null |
Color of horizontal grid lines. Accepts any CSS color, variable, or {{ }} template. Leave empty for theme default. |
y_grid_opacity |
number | 0.15 |
Opacity of horizontal grid lines, from 0 (invisible) to 1 (fully opaque). Lower values keep the grid subtle without competing with the data. |
x_grid_style |
string | "dashed" |
Line pattern for vertical (X-axis) grid lines: dashed, solid, dotted, or long-dash. |
x_grid_width |
number | 1 |
Thickness of vertical grid lines in pixels. |
x_grid_color |
string | null |
Color of vertical grid lines. Accepts any CSS color, variable, or {{ }} template — e.g. var(--divider-color) ties the grid to the active theme (the default is a neutral grey that works on light and dark themes alike). (v4.03) Everything else — picker buttons, bar highlights, trend arrows, zoom brush, band labels — now follows the theme's own variables (--text-primary-color, --primary-text-color, --success-color / --error-color, --primary-color) without configuration. |
x_grid_opacity |
number | 0.15 |
Opacity of vertical grid lines, from 0 (invisible) to 1 (fully opaque). |
show_tooltip |
boolean | true |
Show hover tooltip with crosshair |
show_tooltip_total |
boolean | true |
Controls total/summary displays across chart modes. Timeline: Total row in tooltip — the unit is appended when every visible entity shares it (e.g. "6.20 kWh"). Pie/Polar Area: total in donut center (off = full pie). Radial Bar: average in center. Ranking: percentage labels on bars and Share row in tooltip. Waterfall: Running total row in tooltip. Histogram: Share row (the bin's share of all samples) in tooltip. Not used in Scatter. |
tooltip_stacked_total |
boolean | true |
When the chart is stacked with 2+ stack groups, adds a per-group total row to the tooltip — labelled with the group name (e.g. "Apples Total") — for each named group. Independent of show_tooltip_total: with both on, the tooltip shows the per-group totals and the grand Total of all entities. Timeline mode. See Stacked Groups. |
tooltip_match_axis |
boolean | false |
Format the tooltip's date header exactly like the X-axis labels. On long-range views shows e.g. "May 26" instead of a full timestamp (ignoring datetime_format, just as the axis does). It never appends a time to a date: Month / Year / day views show the date only, intraday (hour) views show the clock only. Timeline mode. |
crosshair |
boolean | false |
Crosshair pins: a tap or click on the graph pins a crosshair at that time, the tooltip stays on screen and the pin can be dragged; once all pins are placed, a tap on empty graph area clears them. While on, a tap places a pin instead of drilling down (v4.03) |
crosshair_pins |
number | 1 |
How many pins can be placed: 1, or 2 to compare two points in time (tooltip shows A → B per series plus a Total A → B row) (v4.03) |
crosshair_delta |
boolean | true |
With two pins, add a Δ row per series (change from A to B as value and percent) and the Δ in the Total row (v4.03) |
crosshair_legend |
boolean | false |
Also show the pinned values (and the delta) next to each legend entry (v4.03) |
tooltip_order |
string | "default" |
Order of the entity rows inside the tooltip: default (configuration order, first entity on top), reverse (bottom-to-top — matches a stacked chart's visual order so the topmost stacked segment is listed first), or alphabetic (A→Z by display name). The Total row, when shown, always stays at the bottom. Timeline mode. |
period_highlight |
boolean | false |
Highlight the period under the cursor on bar charts. Hovering a bar shades a background band spanning that whole period, making it easy to see where each period begins and ends — especially with multiple entities drawn side by side. Works whether or not show_tooltip is enabled. Timeline mode, bar charts. See Period Highlight. |
period_highlight_color |
string | null |
Color of the period-highlight band. Accepts any CSS color (hex, rgba, name) or variable; you can also theme it globally with the --sgc-period-highlight-color CSS variable. Leave empty for a subtle theme grey. Requires period_highlight: true. |
show_y_axis |
boolean | true |
Show primary (left) Y axis value labels. Available in Timeline and Scatter modes. |
show_y2_axis |
boolean | false |
Show secondary (right) Y axis value labels independently. Hidden by default — enable it to show right-side labels. Only relevant when at least one entity uses y_axis: secondary; those entities stay plotted even while the axis labels are hidden. |
show_x_axis |
boolean | true |
Show X axis labels (time in Timeline, values in Scatter). Available in Timeline and Scatter modes. |
show_x_ticks |
boolean | false |
Draw small tick marks at each X-axis label position. |
show_y_ticks |
boolean | false |
Draw small tick marks at each Y-axis label position. |
graph_start_hour |
number / entity | null |
Daily start hour filter. Points before this hour each day are hidden, creating natural line breaks between days (hours are evaluated in the card's display time zone — time_zone — the same clock the X axis uses). Accepts a fixed number (6 = 06:00, 6.5 = 06:30) or a sensor entity ID (sensor.sunrise_hour) for dynamic values. Works with Date Picker: in Day mode trims the X-axis, in Week/Month/Year modes filters per day. See Dynamic Graph Hours. |
graph_end_hour |
number / entity | null |
Daily end hour filter. Points after this hour each day are hidden. Same format as graph_start_hour. Use with sensor.sunset_hour for sunrise-to-sunset views. |
graph_start |
string | null |
Snaps the graph start to a calendar boundary: day (today 00:00 — shown as Today in the editor; today is accepted as an alias), tomorrow (tomorrow 00:00 — ideal for next-day spot prices via data_attribute), week (Monday 00:00), month (1st of month), year (Jan 1st). When set to tomorrow, the window automatically extends to cover the full next day even without show_full_period. Ignored when the interval picker is active. See Long-Range Views. |
year_start_month |
number | null |
First month of the Year period, 1–12 (v4.05). Unset or 1 keeps the calendar year. 7 makes the Year run from 1 July to 30 June: the date picker's Year view, its This Year / Last Year presets and graph_start: year all use that window, the picker header reads 2026/27, the arrows step by that period and compare: last_year / previous_period line up with it. Month and week periods, group_by buckets and the X-axis are not affected. Out-of-range values are ignored. Editor: Calendar → Time Window → Year Starts In. |
show_full_period |
boolean | false |
Extends the X-axis to cover the full calendar period instead of stopping at "now". A dashed vertical line marks the current time. Works with graph_start (week/month/year) and energy_date_sync. Not required for graph_start: tomorrow — that extends automatically. See Show Full Period. (v4.03) In calendar-bucketed views (day points in a week, month…) a line or area whose last bucket is complete — a previous-period comparison, or the main series of a finished period — is drawn flat to the end of that bucket so it reaches the right edge; the live series still stops at now, and the extension is drawing only (tooltips, statistics, markers and CSV ignore it). |
card_background_color |
color | null |
Custom background color for the card. Accepts any CSS color (hex, rgba, name). Use rgba(R, G, B, A) for translucent cards. Replaces card_mod workarounds — this value persists across re-renders. |
card_padding |
string/number | null |
Inner spacing of the card. Accepts a single number (treated as px) or any CSS shorthand like 8px 16px or 0. Leave empty for theme default. |
card_border_radius |
string/number | null |
Roundness of the card corners. Accepts a number (px) or any CSS value like 12px, 1rem, 0. Leave empty for theme default. |
card_border_color |
color | null |
Custom color for the card border. Only effective when card_border is true. Accepts any CSS color or variable. |
card_border_width |
string/number | null |
Border thickness. Accepts a number (px) or any CSS value like 2px. Only effective when card_border is true. |
card_background_image |
string | null |
URL of an image to use as the card background. Local files in /config/www/ resolve via friendly paths — local/photos/sunset.jpg, photos/sunset.jpg, and /local/photos/sunset.jpg all work, as do external URLs (https://...). The image overlays the background color (use rgba(...) colors for translucent overlays that show the image through). |
card_background_blur |
number | null |
Blur amount in pixels applied to card_background_image only. The chart, header, and other content stay sharp. 0 or empty = no blur. Useful for soft, atmospheric backgrounds (try 4–12). |
card_header_color |
color | null |
Custom color for the header title text. Accepts any CSS color or variable. Leave empty for theme default. |
card_header_weight |
string/number | null |
Header text font weight. Accepts CSS keywords (light, normal, bold) or numbers (300, 400, 600, 700). Leave empty for theme default. |
card_header_letter_spacing |
string/number | null |
Header letter spacing. Accepts a number (treated as px) or any CSS value like 0.5px, normal, -0.02em. Leave empty for theme default. |
styles |
string | null |
Plain CSS applied inside the card (v4.05) — the same class names card-mod users target (.sgc-card, .sgc-title, .sgc-state-value, .sgc-plot …) plus ha-card, with no card-mod installed. The sheet is kept across re-renders and visual-editor saves; leave it out and nothing changes. A rule that collides with a card option you have set (background, border, padding, shadow, header colour) needs !important, because those options are applied inline — the same as with card-mod. Static CSS only (no templates). Editor: Card Settings → Card Styling → Custom CSS. |
show_legend |
boolean | false |
Show a compact color-coded entity name key below the graph. Click any item to temporarily toggle that entity's visibility on the graph. For per-entity stats, use the entity-level Legend toggle. Entities with show_in_compact_legend: false are left out of it (v4.07). |
auto_hide_entities |
boolean | false |
Start every entity hidden — the plot begins empty and you reveal series by clicking them in the legend. Reveals stick for the session; entities added later also start hidden. Best paired with show_legend: true. |
legend_position |
string | "center" |
Position of the compact legend: left / center / right. The legend flows inline at the chosen alignment. |
include_area_names |
boolean | false |
Append each entity's Home Assistant area to its name across the state row, legend, tooltip, stats and exports — e.g. Heating Temperature · Lounge. Every entity with an area gets it (no duplicate detection, so the legend doesn't change shape when you add or remove an unrelated entity). The area comes from the entity's area, or its device's area as a fallback; if neither resolves the name is unchanged, and a name that already contains its area isn't doubled up. An explicit name: is never modified. Comparison ghosts inherit their parent's suffix. See Area names. |
use_only_area_name |
boolean | false |
Show only the entity's Home Assistant area as its name — Master Bedroom instead of Multisensor Temperature · Master Bedroom — in the same places (v4.07). An entity whose area does not resolve keeps its normal name, an explicit name: is never modified, and comparison ghosts read Master Bedroom (previous period). For an entity whose area resolves the area is the whole label, so include_attribute_name / use_only_attribute_name do not change it (for Current temperature · Master Bedroom combine use_only_attribute_name with include_area_names). An alternative to include_area_names: the visual editor turns one off when you switch the other on, and in YAML this one wins if both are set. See Area names. |
include_attribute_name |
boolean | false |
Append the plotted attribute to each entity's name in the same places — e.g. Lounge Heating · Current temperature (v3.32). Rows that plot the entity state itself have no attribute and are left alone, as are entities with an explicit name:. Uses Home Assistant's own translated attribute name where one exists, otherwise a humanised form of the attribute key. |
use_only_attribute_name |
boolean | false |
Like include_attribute_name, but shows only the attribute — Current temperature instead of Lounge Heating · Current temperature (v3.32). The two are alternatives: the visual editor turns one off when you switch the other on, and in YAML this one wins if both are set. Combines with include_area_names to give Current temperature · Lounge. |
logarithmic |
boolean | false |
Logarithmic Y axis scale. Timeline mode only. The axis runs from the power of ten at or below the smallest positive value to the power of ten at or above the largest, with a label on every power of ten; readings of zero or below are drawn on the axis floor, and bounds of zero or below are ignored. A positive lower_bound / upper_bound is honoured as given. |
animate_graph |
boolean | false |
Draw-in animation on load (Timeline mode): lines sweep in along their length and bars grow up from the baseline. Also enables a grow-in animation on every data refresh for Pie, Radial Bar, Polar Area, Gauge, Radar, Ranking and Scatter modes — slices, arcs, bars and points sweep out from zero whenever the underlying values change. |
max_visible_interval |
number | null |
Maximum visible time range in hours. Enables horizontal scrolling. Works in Timeline and State Timeline modes. |
scroll_mode |
string | "scrollbar" |
How the scroll works when max_visible_interval is active. scrollbar (default) shows a bottom scrollbar; wheel hides it and lets the mouse wheel scroll horizontally. |
state_strip_height |
number | 16 |
(new in v4.03) Height in pixels of each state strip row drawn under the X axis. Range 6–60. |
state_strip_labels |
boolean | true |
(new in v4.03) Draw the state name inside each state-strip band (only where the band is wide enough). Set to false for clean color bands — the tooltip still names the state. |
state_strip_titles |
boolean | false |
(new in v4.05) Write each state strip's name on a small line directly above its band — the same name the legend and tooltip show, so stacked strips can be told apart without the legend. Each title adds its own height to the strip block; titles are dropped automatically when the card is too short for them. Give an entity name: "" to leave only that strip untitled. Editor: Chart → Visual Options → Strip Titles (shown when an entity uses graph_type: state_strip). |
state_strip_title_font_size |
number | null (10) |
(new in v4.05) Font size in pixels of the strip titles, 6–40. Long names are shortened with an ellipsis to the plot width. Editor: Chart → Visual Options → Title Size. |
state_strip_title_position |
string | "above" |
(new in v4.05) Where the strip name goes: above writes it on its own line over the band; left puts it in the Y-axis column beside the band — no extra height, but the name is cut to the column width with an ellipsis (≈ 5–6 characters at the default size), so keep left names short. With show_y_axis: false there is no column and left titles are not drawn. Editor: Chart → Visual Options → Title Position. |
state_timeline_corner_radius |
number | 3 |
Roundness of state_timeline segment corners, in pixels. 0 = sharp edges. Larger values produce rounder / pill-shaped segments (capped at half the row height). State Timeline mode only. Advanced users can also target the sgc-stl-cell CSS class from card_mod for per-state styling. |
state_timeline_show_labels |
boolean | true |
Show the state labels drawn inside state_timeline segments. Set to false for clean, label-free color bands — the tooltip still names each state on hover. Labels only render in segments wide enough to fit them anyway. Accepts {{ }} templates — see Template Toggles. State Timeline mode only. |
state_timeline_label_font_size |
number | 10 / 11 |
Font size in pixels (6–40) of the state label inside each state_timeline segment and of the entity name in the label column on the left (v3.32). Defaults differ when unset: 10 inside segments, 11 for entity names. Both budgets scale with it — segments show fewer characters with an ellipsis, entity names wrap onto up to three lines and rows grow to fit. The segment label additionally requires state_timeline_show_labels. State Timeline mode only. (v3.31) |
state_timeline_row_height |
number | null (auto) |
Height of each state_timeline row in pixels, 24–160. Unset = automatic: 32 px (taller only when an entity name wraps) with the colour band capped at 24 px. Set it to make the bands taller — the band fills the row minus a small margin. height does not apply in this mode. Editor: Chart → Visual Options → Row Height (shown when the chart mode is State Timeline). (new in v4.05) |
state_timeline_bucket |
string | null |
(v4.08) Cut every State Timeline row into equal time slices — one rounded block per slice in the colour of the state that lasted longest in it, an uptime view per hour or day. Sizes: Nm / Nmin (minutes), Nh, Nd, Nw and Nmo (months) with N a whole number — 15m, 30m, 1h, 6h, 1d, 1w, 1mo … — plus hour, day, week and month. Unset or any other value = the continuous bars. Slices follow the card's time zone: hours and days counted from midnight, weeks from Home Assistant's first day of the week, months from the 1st. A slice without data is muted grey. With color_thresholds on the entity, a slice is coloured by the share of its share_state instead. Slices that would be narrower than 2 px fall back to the continuous bars with a console warning. Independent of group_by. State Timeline mode only. Editor: Chart → Visual Options → Slices. See Slices. |
state_timeline_show_share |
boolean | false |
(v4.08) Write at the right end of every State Timeline row the share of time it spent in its main state — On 73%, Kitchen 41%: the entity's share_state when set, otherwise on for on/off entities, otherwise the state seen most. Measured over the chart's time window, leaving out time without data; one decimal below 1 % and above 99 %. Works with or without state_timeline_bucket. Left out when the text would need more than half of the timeline's width. No {{ }} templates. State Timeline mode only. Editor: Chart → Visual Options → Show Share. |
ranking_min_value |
number | null |
Hide entities whose absolute value falls below this threshold. Ranking mode only. Useful for energy / power rankings where idle or standby devices would otherwise crowd the chart — set to e.g. 5 to drop appliances reading under 5 W. Leave empty for no filter. |
ranking_max_value |
number | null |
Hide entities whose absolute value is above this threshold (v4.05). Ranking mode only. The mirror of ranking_min_value: use it alone to list only the devices that need attention — 20 on battery levels keeps just the ones at 20 % or lower — or together with ranking_min_value to keep a band. Compared against the absolute value. Leave empty for no filter. |
gauge_columns |
number | null |
Number of gauge columns in the grid (Gauge mode). Empty / 0 = auto (fits as many dials as the width allows). |
gauge_span |
number | 270 |
Arc sweep of each gauge in degrees, 90–360. 180 = top semicircle; 270 = classic open-bottom dial. Gauge mode only. |
gauge_value_position |
string | "below" |
Where the value is drawn relative to the dial: below (default) or above. The value sits just outside the arc, clear of the needle. Gauge mode only. |
gauge_value_size |
number | null |
Font size of the gauge value in pixels. Empty = auto-size from the gauge. Gauge mode only. |
gauge_show_minmax |
boolean | false |
Show the dial's lower/upper bound labels at the two arc ends (e.g. 0 and 30). Gauge mode only. |
show_interval_picker |
boolean | false |
Show quick-select time range buttons on the card. Default set: 1H, 2H, 4H, 8H, 12H, 24H, 7D. Customize with interval_options. |
interval_picker_position |
string | "left" |
Position of the interval picker: left / center / right |
interval_picker_group |
string | null |
Named group for interval picker sync — works exactly like date_picker_group: cards sharing the name follow the selected interval together, and receivers don't need show_interval_picker. |
interval_options |
list | null |
Which interval buttons to show. Example: ["2H", "12H", "24H", "7D"]. When not set, the default compact set (1H–24H + 7D) is used. Available labels: 1H, 2H, 4H, 8H, 12H, 24H, 3D, 7D, 14D, 30D, 90D, 6M, 1Y. When the range on screen is none of them — a hours_to_show: 36, or a default_interval left out of the list — the picker adds a button for it in the right place (36H) and shows it as the selected one, so the bar never opens with nothing highlighted (v4.04). |
default_interval |
string | null |
Which interval button the picker opens on, e.g. "24H". Leave unset for Auto — the card remembers the last button pressed on that card and restores it on reload. Set it to always start on one interval and ignore the remembered value; you can still click another button, and the next reload returns to this one. Takes the same labels as interval_options, and a label you left out of your visible set gets a button of its own. Needs show_interval_picker or an interval_picker_group; a Date Picker or Energy Date Sync window still wins. The remembered value is per card: two cards charting the same entity no longer share it. (new in v4.04) |
show_attribute_list |
boolean | false |
Show per-entity attribute dropdown selectors on the card |
attribute_list_position |
string | "left" |
Position of the attribute list: left / center / right |
show_pph_picker |
boolean | false |
Show a Points/Hour dropdown on the card itself. The pick persists per card, takes priority over Auto Scale, and Auto returns to the configured value. |
pph_picker_position |
string | "left" |
Position of the Points/Hour picker: left / center / right |
pph_picker_group |
string | null |
Named group syncing the Points/Hour selection across cards — receivers don't need the picker visible. Independent from group_by_picker_group. |
show_group_by_picker |
boolean | false |
Show a Group By dropdown on the card (Interval, Hour, 2H–12H, Date, Week, Month, Year). Persists per card; Auto returns to the configured value. |
group_by_picker_position |
string | "left" |
Position of the Group By picker: left / center / right |
group_by_picker_group |
string | null |
Named group syncing the Group By selection across cards. Independent from pph_picker_group. |
show_export |
boolean | false |
Show a small download icon overlaying the top-right corner of the card. Clicking it opens a menu — Download PNG (Chart) / Download PNG (Card) / Download CSV — exporting the current view ("export what you see": a zoomed chart exports the zoomed range). The Card variant captures the entire card — header, chart, state row, and legend. Hidden in sparkline mode. Accepts {{ }} templates — see Template Toggles. See PNG / CSV Export. |
tooltip_sync |
boolean | false |
Broadcast hovered timestamp to other synced cards. Timeline mode only. |
tooltip_sync_group |
string | null |
Named group for tooltip sync. Cards with the same name sync only with each other. Leave empty to sync with other ungrouped cards only — an empty group never matches a named one. |
drill_down |
boolean | false |
Click a single bucket on the graph to reload the card for just that bucket, at the finer resolution the shorter window allows — click a month bar to see its days, a day to see its hours. Each click pushes a level onto a stack (20 deep); double-click steps back out one level, unwinding any brush zoom first. This refetches at the finer resolution rather than magnifying the existing points. Clicking empty space, a bucket under a minute long, or a bucket that already fills the view, does nothing. Any date picker or interval picker change — including one arriving from a synced card — drops every drill level and returns to that period. Shares the click handler with Brush Zooming, so it does nothing while brush_zoom: false. Timeline mode only. Broadcasts through zoom_sync when that is on. |
show_zoom_buttons |
boolean | false |
Show small zoom in, zoom out and reset buttons in the top-right corner of the chart. Each click halves or doubles the visible range around its centre; the reset button appears only once you have zoomed or drilled in and returns the chart to its full window. Works alongside drag and double-click zooming and keeps grouped cards in step through zoom_sync. Handy on touch screens, where drag zoom needs a long press. Zooming is a view transform: it does not fetch finer data - use drill_down for that. Timeline mode only. |
zoom_sync |
boolean | false |
When you brush-zoom (or double-click to reset) on this card, the same time window is applied to all other cards sharing the group. Broadcasting requires Brush Zooming, which is Timeline-only — but State Timeline cards can receive and follow a synced window, so the option is available in Timeline and State Timeline. See Zoom Sync. |
zoom_sync_group |
string | null |
Named group for zoom sync. Cards with the same name sync only with each other. Leave empty to sync with other ungrouped cards only — an empty group never matches a named one. |
scroll_sync |
boolean | false |
Mirror horizontal scrolling across all other cards in the same group. Most useful when max_visible_interval is set so the chart is actually scrollable. Works in Timeline and State Timeline modes. See Scroll Sync. |
scroll_sync_group |
string | null |
Named group for scroll sync. Cards with the same name sync only with each other. Leave empty to sync with other ungrouped cards only — an empty group never matches a named one. |
energy_date_sync |
boolean | false |
Sync the card's time range with HA's Energy dashboard date picker or the energy-period-selector-plus custom card. When the user selects a date range, this card automatically updates to show the same period. See Energy Date Sync. |
energy_collection_key |
string | null |
Follow a specific energy date-picker collection instead of the default one — set it to the same collection_key you gave your energy-date-selection card (must start with energy_, e.g. energy_dashboard2). Lets each dashboard's picker control only that dashboard's cards. Empty = the default collection, as before. In the editor: the key input sits inline on the Energy Date Sync row (Calendar tab), like the Date Picker's Group field. (v4.02, #349) |
show_date_picker |
boolean | false |
Show a built-in date navigation bar with Day/Week/Month/Year buttons, arrow navigation, calendar popup, and preset ranges. Cannot be used together with energy_date_sync. See Date Picker. |
date_picker_position |
string | top |
Position of the date picker bar. top or bottom. |
date_picker_nav_position |
string | "left" |
Horizontal position of the ‹ period › navigator inside the picker bar: left / center / right. |
date_picker_shortcuts_position |
string | "right" |
Position of the D/W/M/Y shortcuts and the calendar icon: left / center / right. Sharing a zone with the navigator places the navigator first. |
date_picker_group |
string | null |
Named group for date picker sync. Cards with the same group name share date selection — change the date on one card and all cards in the group update together. Works even on cards without show_date_picker — a single card with a visible picker can control all other cards in the group. |
date_picker_modes |
list | null |
Which period buttons to show: day, week, month, year. Also accepts rolling modes (last_1h, last_6h, last_12h, last_24h, last_3d, last_7d, last_15d, last_30d, last_90d, last_180d, last_12m, last_2y, last_3y, last_5y) to show them as extra buttons (1H … 5Y) next to D/W/M/Y. Example: [month, year] or [day, last_7d, last_30d]. When only one mode is listed, the buttons are hidden and the navigation is centered. Default (null) = the four calendar modes (rolling ones off); a controller card defaults to D/W/M/Y + 1H, 6H, 12H, 24H, 7D, 30D. |
date_picker_reset |
bool | false |
Adds a ↺ button to the date picker bar that returns to date_picker_default_mode (or the first visible mode) and clears any custom range. A controller card shows it by default; false hides it there (v4.03) |
sync_group |
string | null |
One group name for every synced picker on the card: fills date_picker_group, interval_picker_group, pph_picker_group and group_by_picker_group that are left empty. A controller card and the chart cards it drives only need this one key (v4.03) |
date_picker_default_mode |
string | null |
Forces the date picker to always open in a specific mode regardless of the last-used state. Calendar modes: day, week, month, year. Rolling windows that end at now: last_1h, last_6h, last_12h, last_24h, last_3d, last_7d, last_15d, last_30d, last_90d, last_180d, last_12m, last_2y, last_3y, last_5y (e.g. last_7d = the last 7 days; prev/next jumps a full period). Leave empty (default) for Auto — the picker remembers the last mode you selected. Useful on shared dashboards where you always want the picker to start on, say, Month or the last 30 days. |
date_picker_step |
number | 1 |
Window width in units of the selected mode. 1 = single-unit window (legacy behavior — one day, one month, etc.). >1 turns the picker into a rolling N-unit window: prev/next buttons jump a full N units at a time. Example: 4 with week mode shows the last 4 weeks and navigates back/forward 4 weeks per click. See Date Picker → Window Step. |
annotations |
list | [] |
Reference lines and markers on the graph. Timeline mode only. See Annotations. |
show_now_line |
boolean | true |
Show a vertical line marking the current moment on the graph. Timeline mode only. |
now_line_color |
string | null |
Color of the now line. Accepts any CSS color or variable. Leave empty for theme default. |
now_line_opacity |
number | null |
Opacity of the now line (0–1). Leave empty for default. |
now_line_width |
number | null |
Thickness of the now line in pixels. Leave empty for default. |
now_line_style |
string | null |
Line pattern for the now line: solid, dashed, dotted, or long-dash. Leave empty for default. |
🔷 Entity Options
Each entry under entities supports the following options.
📋 General
| Option | Type | Default | Description |
|---|---|---|---|
entity |
string | required | HA entity ID. Can be left empty when using statistic_id. |
statistic_id |
string | null |
For imported/external statistics that have no regular entity (e.g. gazpar:gazpar_consumption). These exist only in the statistics database. Leave empty for normal entities. See External Statistics. |
name |
string | null |
Custom display name for the state row. Leave empty to show the entity's friendly_name (the default). To hide the name instead, use hide_name. Supports HA-style templates: {{ states('sensor.x') }}, {{ state_attr('sensor.x', 'attr') }} with Jinja2 filters like capitalize, upper, replace(). See Template Names. |
hide_name |
boolean | false |
Hide this entity's name in the state row (the live value row above the graph), leaving just the value. Only affects the state row — the compact legend and tooltip still show the name (use show_in_compact_legend: false to drop the entity from the compact legend altogether). Separately, the legacy name: "" (empty custom name) still hides the name everywhere (state row, legend, and tooltip) and is left untouched. Editor: State Row tab → Hide Name. |
tooltip_name |
string | null |
Override the name shown in the hover tooltip independently from name. Useful when you want a long, descriptive label in the state row but a short label — or no label at all — in the tooltip. Set to an empty string (tooltip_name: "") to hide the name in the tooltip while keeping the swatch and value visible. When unset, the tooltip falls back to name → friendly_name → entity id. |
unit |
string | null |
Custom unit label (e.g. kWh, °C, %). Overrides the auto-detected unit_of_measurement. Useful for attributes, unitless sensors, or when you want a different label. Appears in state row, tooltip, chart center, and axis labels. |
y_axis |
string | "primary" |
primary (left), secondary (right), or independent (hidden, own scale). Independent entities are scaled to their own min/max — ideal for overlaying sensors with different units for trend comparison. See Independent Y-Axis. |
aggregate_func |
string | "avg" |
Aggregation: avg / min / max / last / first / median / sum / change / delta / diff. The change option uses HA's native statistics change field — ideal for energy, gas, and water meters with group_by: date/week/month. |
damp_reset_boundary |
boolean | true |
Expert. The card automatically repairs the midnight carry-over artifact that daily-reset counters (e.g. *_today energy sensors) show when displayed with aggregate_func: max + group_by: date — without it, the first bucket of each day would inherit the previous day's peak. Set to false to disable the heuristic if it damps legitimate peaks near midnight. |
change_ignore_zero |
boolean | false |
(new in v3.28) For aggregate_func: change on counters whose integration reports a literal 0 while the device is off or restarting and then jumps back to the previous total (instead of going unavailable). Each such dip is normally counted as a meter reset, so the restored value is re-counted as new consumption — inflating daily/monthly totals massively. Enable to skip zero readings entirely; with long-term statistics the change is recomputed from the state column, bypassing the polluted sums. Counters that genuinely reset to zero and keep counting from there still work. (v4.03) On the statistics path the recomputed value can never exceed Home Assistant's own change for that row, and periodic utility meters — helpers with a meter_period, or any sensor whose state column keeps dropping between rows — use Home Assistant's change directly, because their state is a per-period counter rather than a running total. Also available as an Ignore transient zeros toggle under the Aggregation dropdown. |
price_entity |
string | null |
Multiply every value of this series by the state of another entity over time — the cost view. The price is read as a step function from the price entity's own history (long-term statistics with hourly mean on long windows), and the multiplication happens per consumption slice before bucketing, so each bucket is an exact Σ(valueᵢ × priceᵢ). Intended for aggregate_func: change on energy counters — set unit to the currency. State changes of the price entity auto-refresh the card. Not applied to fixed_value / data_attribute entities. See Cost View. |
price_attribute |
string | null |
Read the price from an attribute of price_entity instead of its state. Supports dot notation for nested paths (e.g. raw_today.0.value). Only used when price_entity is set. |
ref_entity |
string | null |
Two-entity math. Combine this entity with a second one over time — the classic case being indoor − outdoor without a template sensor. The reference is read as a step function from its own history, so every sample of this entity is combined with the reference value valid at that moment. A gap in the reference produces a gap here rather than an invented value. See Two-Entity Math. (v3.31) |
ref_op |
string | "subtract" |
How to combine with ref_entity: subtract (A−B), add, multiply, divide (A÷B), plus reverse_subtract (B−A) and reverse_divide (B÷A). The reversed forms exist because swapping the two entities is not equivalent — the main entity drives the timeline, unit, aggregation and data source, while the reference is only sampled. subtract/add/reverse_subtract combine levels sample by sample for level aggregations (avg, min, max, last, first, median). (v4.03) With a delta aggregation (change, diff, sum, delta) they are combined bucket by bucket instead: both entities are aggregated the same way first (for statistics-fed series that is Home Assistant's own per-period change), then added or subtracted per bucket (price_entity applies to both sides) — so two daily-production sensors can be summed into one monthly total. A bucket where either side has no data counts that side as 0. This bucket-wise path needs an entity: series in a bucketed chart; a statistic_id-only or attribute series still renders empty with a console warning. (v4.07) divide / reverse_divide take the same bucket-wise path when the reference is a meter (its state_class is total or total_increasing — an energy, gas or water counter): the two totals of each bucket are divided, so heat output ÷ electricity used with group_by: date is the daily COP. A bucket where the divisor is 0 or has no data stays empty, a bucket where only the divisor has data shows 0, and price_entity multiplies the main entity only. multiply, and divide by a level (a constant, an input_number, a measurement sensor or any ref_attribute), are allowed with any aggregation and combine sample by sample. An unrecognised value falls back to subtract. (v3.31) |
ref_attribute |
string | null |
Read the reference from an attribute of ref_entity instead of its state (dot notation), e.g. temperature on a weather. entity. (v3.31) |
decimals |
number | 1 |
Decimal places shown in state row and labels |
attribute |
string | null |
Read an attribute instead of state. Supports dot notation: forecast.0.temperature. In state_timeline mode, pair with state_map to plot the attribute's history (#219); with graph_type: state_strip the attribute's values are discovered automatically. |
value_factor |
number | 0 |
Multiplies value by 10^N. -3 = ÷1000, 2 = ×100 |
value_transform |
string | null |
JavaScript expression to transform each data value. Available variables: x (current value), first, last, min, max, avg (series stats), index (point position), plus the time variables t (this point's timestamp in ms), now (the current time in ms), hour (hour of day as a decimal, 0–23.99, in the card's display timezone) and weekday (1 = Monday … 7 = Sunday) (v4.04). Applied after value_factor. Returning null leaves a visible gap in the line. Example: return x - first. See Value Transform. |
data_attribute |
string | null |
Read chart data from an entity attribute array instead of history. The attribute must contain an array of objects with time and value fields. Ideal for forecast/price data (EPEX, Nordpool, weather). Calendar group_by modes (hour, date, week, month, year) regroup the array with aggregate_func when it is finer than the requested cell — quarter-hourly prices become hourly bars with group_by: hour (v3.34). See Attribute Data Source. |
data_time_field |
string | "start_time" |
Name of the time field in each array item when using data_attribute. |
data_value_field |
string | "price_per_kwh" |
Name of the value field in each array item when using data_attribute. |
data_value_expression |
string | null |
Compute each point's value with a safe arithmetic expression instead of reading a single data_value_field. The array element's own fields and any data_vars are in scope. Operators + - * / %, parentheses, and the functions min, max, abs, round, floor, ceil, sqrt, pow and coalesce (v4.08) — coalesce(a, b, …) returns its first argument that is a number, so coalesce(field, 0) counts an element without that field as 0. Not JavaScript — no other variables, property access, or calls. Falls back to data_value_field when empty or invalid. See Attribute Data Source → Computed Values. |
data_vars |
map | null |
Maps names used in data_value_expression to entity IDs (name: entity_id). Each resolves to the entity's numeric state and is re-evaluated live when that entity changes. |
data_time_unit |
string | "iso" |
How to interpret the time field. iso = string or epoch ms (default — existing behavior). epoch_seconds / epoch_ms = Unix timestamp. month_of_year (1–12), day_of_month (1–31), day_of_year (1–366), week_of_year (1–53), hour_of_day (0–23) = numeric category — perfect for monthly summaries, day-of-year datasets, and hourly profiles without generating artificial timestamps. See Attribute Data Source → Time Unit. |
data_time_year |
number | null |
Reference year used to anchor categorical time units (month_of_year, day_of_month, day_of_year, week_of_year). Empty = current year. (day_of_month is anchored to that year and the month of the visible window's start.) Has no effect for iso or epoch_* units. |
offset |
string/number | 0 |
Shifts this entity backward in time by the given number of hours. Use to overlay the same sensor from different periods. 24 = yesterday, 168 = last week, 720 = last month. Also accepts a helper entity ID (e.g. input_number.my_offset) for dynamic offset — the entity's state is read as hours. See Time Offset. |
compare |
string/number/object/list | null |
Overlay a faded, dashed ghost series of the same entity from a previous period underneath the main line. Short forms: previous_period, yesterday, last_week, last_month, last_year, a number of hours, or true (= previous_period). Also accepts an object for full styling control (period, color, opacity, line style/width, fill, points, legend, tooltip delta) — or a list of comparison objects, one ghost per entry, each reaching further back via periods_back (1 = previous period, 2 = two periods ago). Works in Timeline and, since v4.02, in State Timeline — there each comparison renders as its own extra row right under the main entity ("Sensor (yesterday)"), with faded state colors and tooltips showing the real historical time. Ignored for candlestick, fixed_value, and data_attribute entities and in sparkline mode. See Period Comparison. |
forecast_horizon |
number | null |
For forecast sensors whose current state predicts T+N hours ahead (e.g. "Solar forecast in 1 hour"). Shifts each recorded data point forward by N hours so the value lands at its target future time on the X axis. The X axis is extended automatically to keep the shifted points visible. Independent from offset — both can be combined. See Forecast Horizon. |
points_per_hour |
number | null |
Per-entity override. Inherits card-level setting if empty. The editor offers the same divisor-of-60 presets as the card-level setting; YAML accepts any integer. |
group_by |
string | null |
(new in v4.05) Grouping for this entity only: hour, 2h … 12h, date, week, month, year; unset = the card's group_by. The chart's time grid (X axis, ticks, fetch) becomes the finest grouping in use — card or any entity. An entity grouped coarser than that grid is re-aggregated into larger calendar cells drawn on the grid (e.g. monthly bars behind daily values); an entity grouped finer than the card refines the grid for the whole chart, and the card's other entities are then drawn as calendar cells of the card grouping. Put a coarse series on y_axis: secondary or independent when it dwarfs the others. raw/interval cannot be set per entity, and nothing changes while the card is grouped by raw. Editor: Entities → entity → Data → Group By. |
data_source |
string | "auto" |
Per-entity override of the card-level data_source: auto (the card decides, including the v4.02 high-frequency auto-detection), statistics (always route through 5-minute long-term statistics), or history (force raw recorder history — also opts this sensor out of the high-frequency auto-detection). Explicit values always win over auto-detection. YAML only. (v4.01) |
number_format |
string | "system" |
Controls how numbers are displayed in the state row and tooltip. system follows HA's locale; comma forces European style (1.234,56); dot forces English style (1,234.56). Useful when mixing sensors from different regional sources. |
datetime_format |
string | "system" |
Deprecated — use the card-level datetime_format instead. Entity-level values still work for backward compatibility and override the card setting when present. |
fixed_value |
boolean | false |
Draw a flat horizontal reference line at the current value instead of history |
solar_forecast |
boolean | false |
(new in v4.07) Draw the Energy dashboard's solar forecast as this row — entity / statistic_id are not required. The points are the hourly kWh values the forecast integration publishes to the Energy dashboard (Forecast.Solar, Solcast, Open-Meteo …), past hours as far as the integration returns them. aggregate_func defaults to sum and unit to kWh, so group_by: date gives daily totals; the state row shows the forecast of the current hour (primary_state_as: sum for the window total). auto_scale_points steps aside for this row like for data_attribute. Needs a solar source with a configured forecast in the Energy dashboard; otherwise the row stays empty. See Energy Dashboard Solar Forecast under Data Sources & Math. |
solar_forecast_source |
string | null |
With solar_forecast: true: the energy-production statistic (stat_energy_from, e.g. sensor.pv_a_energy) of one solar source of the Energy dashboard to draw only its forecast. Unset = every solar source that has a forecast, summed per hour. The row is named after the source (its Energy dashboard name or the friendly name of that statistic + " forecast"), or Solar forecast. |
invert |
boolean | false |
Flips the sign of the value (×−1). On Timeline it draws bars downward from the zero line — tooltip, state row and extrema labels still show positive values; use with stacked: true for butterfly charts. Because the flip happens in the shared data pipeline it works in every chart mode — in Waterfall it makes the entity a subtraction step. Editor: per-entity → Advanced tab. See Invert Bars. |
state_map |
list | null |
Map non-numeric states to numbers for graphing. Each entry takes a value plus optional label and color. See State Map. |
share_state |
string | null |
(v4.08) State Timeline mode only. The state whose share is measured for this entity: the share written by state_timeline_show_share, and with color_thresholds the share that colours each state_timeline_bucket slice. Use the state's value as Home Assistant reports it — on, home, kitchen — not its label (case matters). Unset = on when the entity has an on state; otherwise the end-of-row share uses the state seen most and the slices use the last entry of the state_map. A value that is not one of the entity's states shows 0 %. Editor: entity → Advanced → State Map → Share State. See Slices. |
auto_hide |
boolean | false |
Start this single entity hidden — the series is invisible until you reveal it from the legend (the reveal sticks for the session). Per-entity alternative to the card-wide auto_hide_entities. When auto_hide_entities is set, it takes precedence over per-entity values. |
tap_action |
object | null |
Action on tapping the state row (and the entity's slice, bar, point, cell or row in the other chart modes). See Tap Actions. When left unset (Default action in the editor), tapping the state row toggles that entity's visibility on the graph — same as clicking its legend item; action: none makes the tap do nothing. Hidden entities dim visually so you can tell what's off at a glance. |
🎛️ Appearance
| Option | Type | Default | Description |
|---|---|---|---|
graph_type |
string | "line" |
line / step / bar / candlestick / state_strip. Only available in Timeline mode — other chart modes ignore this. See Candlestick (OHLC) and State strips. |
show_graph |
boolean | true |
Show this entity on the graph |
show_in_compact_legend |
boolean | true |
(v4.07) List this entity in the compact legend — the color key under the graph that show_legend: true turns on. Set false to leave it out of that legend only; the state row, tooltip, graph and the show_in_legend statistics row behave as configured. Handy for show_graph: false rows that exist only to feed the state row, e.g. the extra values beside a pie's slices. Comparison ghosts follow the main entity unless their compare block sets the key. Supports {{ }} templates. Editor: Graph tab → Show in Compact Legend. |
show_line |
boolean | true |
Show the line edge. Timeline mode only. |
show_fill |
boolean | true |
Show the fill area below the line. Timeline mode only. |
show_range_band |
boolean | false |
Draw a min/max shaded band behind the line showing the value range within each aggregation bucket. The line shows the average while the band shows how much the value fluctuated. See Range Band. Timeline mode only. |
gradient |
boolean | true |
Fade the fill from the entity color to transparent. Only applies when show_fill is true. Timeline mode only. |
fill_opacity |
number | 0.4 |
Strength of the fill under the line, 0 (invisible) to 1 (solid). With gradient: true this is the opacity at the top, fading to an eighth of it at the bottom; with gradient: false the flat fill uses half of it. Only applies when show_fill is true. Timeline mode only. |
enabled |
boolean / string | true |
Set false to make the card behave as if this entity was never configured: nothing is fetched or drawn, comparison ghosts are not created, and no card-wide logic (auto-scale guards, Y-bounds, palette colors) considers it. Its entity id is not even validated — a template placeholder is fine. Built for shared card templates (e.g. Streamline) where some instances lack a sensor: pass a per-instance variable instead of maintaining a separate card. Since v4.05 it also takes an entity ID for a live switch: input_boolean.x shows the entity while the helper is on, "!input_boolean.x" (quoted — a bare ! is a YAML tag) hides it while the helper is on; on / true / yes / 1 count as on, unknown / unavailable / a missing helper (or any state that is not an on/off value) leave the entity shown. The live form is fetched as usual and only shown or hidden — flips are instant on every card pointing at the helper, nothing refetches, the other entities keep their colours and legend state; only the static false skips the fetch. Not Jinja-templatable (it affects data fetching); static template engines substitute it before the card sees it. The editor shows disabled rows dimmed with an Enabled toggle. (v3.30) |
show_points |
boolean | false |
Show a dot at each data point. Timeline mode only. |
point_size |
number | auto | Radius of the data point dots in pixels (0.5–20). Leave unset for automatic sizing based on line_width. Also sets the dot size in scatter and radar modes (via YAML; in scatter, set it on the first entity — the one that styles the dots). In the editor the field appears under the Data Points toggle when it is enabled. (v3.29) |
smooth |
boolean | true |
Bezier curve smoothing. Timeline mode only. |
line_width |
number | 2.5 |
Line thickness in pixels. Timeline mode only. |
line_style |
string | solid |
Line type: solid, dashed, dotted. |
z_index |
number | 0 |
Draw order / layering. Higher = drawn in front (on top of lower-numbered entities); lower or negative = behind. Default 0 keeps configuration order. Independent of the legend / state-row order, so you can bring a curve to the front or send it behind another without reordering your entities. Timeline mode. |
show_extrema |
string | "click" |
Min/Max labels: never / click / always. While a zoom is active they mark the lowest and highest point in view. Timeline mode only. |
show_extrema_min |
boolean | true |
Show the Min value label. Disable to show only the Max — useful for sensors where the minimum is always zero (solar power, rain, etc.). Timeline mode only. |
show_extrema_max |
boolean | true |
Show the Max value label. Timeline mode only. |
show_data_labels |
boolean | false |
Print the numeric value of every visible data point right above its bar / line / point — ApexCharts-style. Uses the entity's decimals and number_format settings. Text renders in the entity color with a card-background halo so it stays readable over busy charts. On a stacked: true bar chart each label is centered inside its own segment instead, in white or dark text — whichever stands out against that segment's color — and a segment too short to hold the number shows no label. For bars, font size adapts to bar width and labels shrink down to a minimum of 7 px before being skipped. Best paired with reasonable point counts; dense charts produce overlapping labels. Timeline mode only. |
data_labels_font_size |
number | null |
Override the auto-picked font size for data labels in pixels. Leave empty to inherit the default (10 px for lines, dynamic per-bar for bars). Has no effect when show_data_labels: false. Timeline mode only. |
extrema_show_timestamp |
boolean | true |
Show the time the extreme value was recorded below each label. Disable for compact display showing only the value. Timeline mode only. |
extrema_color |
string | null |
Custom font color for extrema labels. Accepts any CSS color or variable. Leave empty for theme default. Timeline mode only. |
extrema_font_size |
number | 13 |
Font size of the extrema value in pixels. Timestamp text scales proportionally. Timeline mode only. |
extrema_bg_color |
string | null |
Background color of the extrema label box. Combined with extrema_bg_opacity. Leave empty for theme default. Timeline mode only. |
extrema_bg_opacity |
number | 1 |
Opacity of the extrema label background (0 = transparent, 1 = solid). Set to 0 for floating text without a visible box. Timeline mode only. |
show_average |
boolean | false |
Draw a dashed horizontal line at the mean value. Timeline mode only. |
moving_averages |
list | null |
One or more simple moving-average (SMA) lines drawn over this entity. Each item takes period (length in buckets, required), color, and an optional width. The bucket size comes from points_per_hour / group_by, so a period of 26 means "average of the last 26 buckets". The card extends the history look-back beyond the visible window automatically, so a long period draws fully even when hours_to_show is short. Averages the close for candlesticks, otherwise the bucket value. Plotted on the entity's own Y axis. Set show_label: true on an item to print a small MA7/MA26 label at the end of its line; (v4.07) add a name (any text, e.g. "Weekly trend") to print that text instead of MA<period> — name only changes the wording, show_label still switches the label on, and a blank name falls back to MA<period>. Timeline mode only. See Moving Averages. |
break_on_null |
boolean | false |
Break the line at long sensor outages instead of carrying the last known value across the gap. When false (default), the previous known value is carried forward indefinitely — the line stays continuous even during long unavailable / unknown periods. When true, short blips stay connected but outages longer than a threshold (default min(3 × bucket, 30 minutes)) appear as visible breaks in the line. Applies in every chart mode — it changes the bucketed values themselves, not just the drawn line. Does not affect value_transform scripts that return null (those buckets are already null before this logic runs). See Break on Gaps. |
carry_forward_ms |
number | null |
Advanced override for the carry-forward threshold in milliseconds. Takes effect regardless of break_on_null. Use this when you want a specific time window instead of the default auto threshold. Applies in every chart mode. |
show_state |
string/boolean | true |
State row display: true (text), false (hidden), "gauge" (half-circle arc). See Gauge Display. |
show_color_dot |
boolean | true |
Show the colored marker next to this entity in the state row, compact legend, detail legend, timeline tooltip and all chart-mode tooltips. Set to false to hide the marker while keeping the surrounding text in place (text does not shift). Useful when you only have one entity and don't need a color marker, or when color_thresholds causes the static dot color to no longer match the dynamically-colored line / bar / value. |
show_state_last |
boolean | false |
Legacy — equivalent to primary_state_as: last. Still honored for backward compatibility. |
primary_state_as |
string | null |
What appears as the big primary value in the state row. null (default) = live HA state. last = last aggregated graph point. sum / avg / min / max / first = the chosen aggregate over the whole loaded period (a zoom does not change it), shown as a clean number with no "SUM"/"AVG" label prefix. Useful for header-only entities (show_graph: false) that just display a computed number. |
show_timestamp |
boolean | false |
When primary_state_as is min, max, first, or last, also show the time the value was recorded as a subdued suffix next to the main number. Useful for record-tracking cards (coldest day, peak solar, strongest wind, etc.). Format follows the card's datetime_format (or HA locale when set to system). Has no effect for sum / avg (no single timestamp applies). |
show_range_values |
boolean | false |
Show the visible window's min and max as a subdued (min → max) suffix next to the primary value. Best paired with show_graph: false + primary_state_as: min/max for compact "records" cards (coldest day, peak solar, etc.) where the range otherwise lives only in a tooltip the user can't reach. Available for any aggregate (Last, First, Min, Max, Sum, Avg). When show_range_band: true is enabled on the entity, it uses the more accurate per-bucket band data; otherwise it falls back to the aggregate min/max over the visible window. Has no effect for live State (primary_state_as: null). |
name_position |
string | null |
Controls how the entity name and primary value are arranged in the state row. null (default) = name to the left of the value (inline). below = value shown larger with the name centered underneath (ApexCharts-style, great for header-only entities and mobile layouts). |
show_second_state_as |
string | null |
Show a secondary stat value next to the primary state. Options: min, max, avg, sum, first, last. Displays with the same styling as the primary value, with a small label prefix. |
show_trend_icon |
boolean | true |
Show a ▲ / ▼ / ━ trend direction icon next to the state value. The icon indicates direction only — it is not affected by color_thresholds or rise_fall_colors, but each direction has its own color option (trend_up_color, trend_down_color, trend_stable_color). Never drawn in state_timeline mode. |
trend_period_hours |
number | 1 |
Time window (in hours) for trend direction calculation. Set 0 for full range. |
show_in_legend |
boolean | false |
Show a statistics row below the graph for this entity. Which stats are shown is controlled by legend_stats. |
legend_stats |
list | ["min","avg","max"] |
Which statistics to display in the legend row. Any combination of min, avg, max, last, sum, live (v3.32). Requires show_in_legend: true. All of them except live describe the range on screen: while a zoom is active they are recalculated from the visible range, and stepping back out restores the whole-period values. live is the entity's state right now. |
lower_bound |
string/number | null |
Y axis minimum / gauge minimum. See Bounds. |
upper_bound |
string/number | null |
Y axis maximum / gauge maximum. See Bounds. |
align_state |
string | "left" |
State row position and alignment. Top variants: left / center / right (above the graph). Bottom variants: bottom-left / bottom-center / bottom-right (below the graph). |
stack_group |
string | null |
Named group for stacked bars/lines. Entities with the same group name stack on top of each other; different groups sit side by side. Leave empty to stack all entities together (default). Only has an effect on an entity that is stacked — by the card's stacked: true or by its own stacked: true (v4.07); on its own it does nothing. See Stacked Groups. |
stacked |
boolean | null (inherit) |
(v4.07) Per-entity override of the card-level stacked. Leave it unset to follow the card. false on a stacked card takes this entity out of every stack: it is drawn as a plain line, area or bar from the zero line, in a bar slot of its own beside the stacked columns, with its own Y range. true on a card without stacked: true stacks this entity with the other entities that also set stacked: true — grouped as always by stack_group, y_axis, graph_type, group_by and invert. Comparison ghosts follow their main entity. Supports {{ }} templates. Editor: Graph tab → Stacked dropdown (Inherit / On / Off). See Stacked Mode. |
graph_group |
string | null |
(v4.08) Name of the chart page this entity is drawn on. Entities that share the same name are drawn together on one page; entities without a name stay on the main page; every further name makes another page, in the order the names first appear in entities. With two or more pages a strip sits directly under the graph — a dot per page with ‹ › beside them, centred (hover a dot for its group name); click or tap an arrow or a dot to switch (a mouse drag inside the plot zooms as always; it does not turn pages). The compact legend, the statistics legend and the state row list the page on screen; the pickers, zoom, pins, bounds, annotations and sync are shared by all pages; CSV export writes every page, the chart PNG the one on screen. Works in every chart mode. Not the same as stack_group, which only decides which bars stack on each other — entities on different pages are never drawn together, so they cannot stack. A card without graph_group is unchanged. Not templatable. Editor: Graph tab → Graph Group. See Chart pages. |
icon |
string | null |
MDI icon in the state row, e.g. mdi:thermometer |
icon_size |
string | null |
State row icon size, e.g. 18px |
name_size |
string | null |
State row name font size, e.g. 14px |
state_size |
string | null |
State row value font size, e.g. 13px |
trend_icon_size |
string | null |
Trend icon font size, e.g. 12px |
trend_up_color |
string | null |
Color of the ▲ (rising) trend icon. Leave empty to follow the theme success color. Editor: State Row tab → Trend Icon → Up Color. |
trend_down_color |
string | null |
Color of the ▼ (falling) trend icon. Leave empty to follow the theme error color. Editor: State Row tab → Trend Icon → Down Color. |
trend_stable_color |
string | null |
Color of the ━ (stable) trend icon. Leave empty to follow the theme secondary text color. Editor: State Row tab → Trend Icon → Stable Color. |
🎨 Colors
| Option | Type | Default | Description |
|---|---|---|---|
color |
string | "#ff4757" |
Line and fill color. Use threshold to drive from color thresholds. Accepts {{ }} Jinja2 templates for dynamic server-side color resolution (e.g. {{ state_attr('sensor.entity_colors','entities')['Temperature'] }}). See Color Templates. |
point_colors |
string | null |
Color of data point dots. Use threshold for per-point threshold color. Accepts {{ }} templates. |
icon_color |
string | null |
State row icon color. Use threshold for dynamic color. Accepts {{ }} templates. |
state_color |
string | null |
State row value text color. Use threshold for dynamic color. Accepts {{ }} templates. |
state_adaptive_color |
boolean | false |
Automatically tint the state value, icon, and the colored dot with the entity's line color. When color_thresholds are defined, all three follow the threshold-resolved color as the value crosses each band — they stay in sync. Quick alternative to setting state_color and icon_color manually. |
rise_fall_colors |
object | null |
Color by rise/fall direction. See Rise/Fall Colors. |
color_thresholds |
object | null |
Color by value. See Color Thresholds. |
needle_color |
string | null |
Gauge mode — color of the needle. Use threshold to color it from color_thresholds at the current value, or any CSS color / {{ }} template. Leave empty to follow the value color (threshold-resolved, or the entity color). |
🎯 Chart Modes
Timeline, Candlestick, Scatter, Pie, Ranking, Heatmap, Calendar, Radial Bar, Gauge, Polar Area, Radar, State Timeline, Box Plot, Waterfall, Histogram
The chart_mode option at the card level controls the overall visualization. Each mode takes over the entire graph area.
Timeline (default)
Classic time-series chart. Entities can individually be line, step, bar, or candlestick. Interval bars and candles align to clean clock boundaries and sit centered on the X-axis ticks. All Timeline-specific options (axes, grid, stacked, scroll, annotations, offset, zoom) are available.
Candlestick (OHLC)
Set graph_type: candlestick on any entity to draw it as trading-style candles instead of a line or bar. Each candle summarizes one time bucket:
- Body — spans the bucket's open (first value) and close (last value)
- Wick — the thin line spanning the bucket's high (max) and low (min)
- Color — green when the value rose over the bucket (close ≥ open), red when it fell
Hovering a candle shows its Open / High / Low / Close in the tooltip. Candles align to clean clock intervals (e.g. :00 / :15 / :30) and stay centered on the matching X-axis tick, so they don't drift as time advances.
Custom colors: the green/red defaults can be overridden with the entity's existing Rise/Fall Colors feature — turn it on and the Rising color paints up candles while the Falling color paints down candles. No separate candlestick color options are needed.
type: custom:statistics-graph-chart-card
entities:
  - entity: sensor.btc_price
    graph_type: candlestick
    # Optional — recolor up/down candles via the Rise/Fall Colors feature:
    rise_fall_colors:
      enabled: true
      increase: "#26a69a"   # up candle (close ≥ open)
      decrease: "#ef5350"   # down candle (close < open)
hours_to_show: 2
points_per_hour: 12   # 12 → one candle every 5 minutes
Tip: each candle covers exactly one data bucket. Use points_per_hour (history) or group_by: date / week / month (long-range statistics) to choose how much time a candle spans. Fewer, wider candles give clearer wicks; very high point counts produce thin single-sample candles with little or no wick.
State strips (new in v4.03)
Set graph_type: state_strip on an entity to draw it as a band of coloured states under the X axis instead of as a curve — on the same time scale as the lines above it. This is the way to see why a curve moved: when the air conditioner ran, when a door was open, when someone was home.
type: custom:statistics-graph-chart-card
hours_to_show: 24
entities:
  - entity: sensor.room_temperature
  - entity: sensor.outdoor_temperature
  - entity: binary_sensor.air_conditioner
    name: AC
    graph_type: state_strip
- Any number of strips. Each one gets its own row under the axis, in configuration order.
- Colours. Binary and select-style entities are coloured automatically, one colour per state. To choose your own, give the entity a
state_mapwith acolor:per state — the same option the State Timeline chart mode uses. A strip may also read an attribute (attribute: connected_toon a device tracker, a Wi-Fi band, an HVAC action): its values are discovered from history and coloured automatically, and astate_mapfixes their colours and labels. - Reading values. Hovering the chart adds the strip's state to the tooltip next to the numeric values (AC on), and the strip's current state also appears in the state row. Strips never take part in the Y axis, the totals, stacking or auto-scaling — they carry states, not numbers.
- Space. Strips are drawn inside the card's existing height, so the curve area shrinks a little for each row. Raise
height(orstate_strip_height, default 16 px) to taste. - Titles (v4.05).
state_strip_titles: truewrites each strip's name on its own line above the band — the same name the legend and tooltip use — so several stacked strips read without the legend.state_strip_title_font_size(default 10) sets the size, long names get an ellipsis, and titles are dropped before the rows are when the card is too short.name: ""leaves a single strip untitled.state_strip_title_position: leftmoves the name into the Y-axis column beside the band instead — the layout does not change at all, but the name is cut to the column width (keep it short; needs the Y axis). - Live edge. A strip stops at now: the last known state is never drawn into the future, even with
show_full_period: true.
Card-level state_strip_height and state_strip_labels control the row height and the state names drawn inside the bands; since v4.05 both, together with the title options, have fields in the editor under Chart → Visual Options whenever an entity uses graph_type: state_strip. Strips need per-state history, so they always read raw recorder history and are never bucketed or downsampled; on group_by: month / year views (where the X axis is slotted rather than linear) they are not drawn.
Hide strips from one helper (v4.05)
Several cards, one global switch: give the strip entities a live enabled that follows an input_boolean, and every card hides them in the same moment.
type: custom:statistics-graph-chart-card
hours_to_show: 24
entities:
  - entity: sensor.bathroom_air_temperature
  - entity: sensor.bathroom_floor_probe
  - entity: binary_sensor.bathroom_pwm
    name: PWM
    graph_type: state_strip
    enabled: "!input_boolean.dashboard_hide_valves"
  - entity: binary_sensor.bathroom_valve
    name: Valve
    graph_type: state_strip
    enabled: "!input_boolean.dashboard_hide_valves"
While the helper is on the strips, their legend entries, state-row items and tooltip rows disappear and the plot takes the strip height back; switch it off and they return — no reload, no new database query, and the other entities keep their colours. enabled: input_boolean.x (without !) is the positive form. Editor: Entities → entity → General → Enabled Follows.
Scatter
Plots the first entity on the X axis and the second on the Y axis to reveal correlations. Exactly 2 entities required.
chart_mode: scatter
entities:
  - entity: sensor.temperature
    color: "#ff4757"
  - entity: sensor.humidity
    color: "#378ADD"
Points are matched by timestamp (5-minute tolerance). Older dots are faded, newer dots are vivid. X/Y axes show entity value ranges, not time.
Pie Chart
Centered chart showing proportional shares. Slice labels show the actual value with the unit (or percentage in Ranking mode).
Style presets — choose how the pie ring looks:
- Classic — full pie with no center hole
- Thick — wide donut ring, plenty of fill
- Donut (default) — standard donut with a center hole
- Thin — narrow ring, modern minimal look
- Bar — not a ring at all: one full-width horizontal bar, one rounded-corner segment per entity in configured order, each as wide as its share of the total. A compact composition strip to put above a timeline of the same period — see the second example below
3D effect — set pie_3d: true to add depth, perspective and a subtle highlight on top. Works with any preset except Bar.
Slice spacing — set pie_spacing (in degrees, 0–15) for visible gaps between slices. Spaced slices automatically get rounded corners. Only applies to donut styles, not Classic. In the Bar style the same number is a gap in pixels between the segments.
Center total — when show_tooltip_total: true, the total value appears in the donut hole. Disable to make Classic a true full pie. Not shown in the Bar style.
Label and color customization — fine-tune the look of slice labels and the center total to match your theme:
pie_label_font_size— slice value label size in pixels (leave empty for auto)pie_label_color— slice value label color (CSS color orvar(--…); auto = white)pie_label_outside_color— color of the labels drawn outside the ring with a leader line, for slices under 5 % of the total (auto = theme text color)pie_center_font_size— center total size in pixels (leave empty for auto)pie_center_color— center total color; the small "Total" sub-label inherits this with reduced opacity
All five accept theme variables, so pie_label_color: var(--accent-color) updates with your active theme.
Past dates — using a date picker to scroll back to a period with no data shows an empty ring with a friendly "No data" message instead of returning today's value.
chart_mode: pie
height: 200
pie_style: donut       # classic | thick | donut | thin | bar
pie_spacing: 4         # 0-15 degrees, gap between slices
pie_3d: true           # depth/perspective effect
pie_label_font_size: 14
pie_label_color: var(--primary-text-color)
pie_center_font_size: 32
pie_center_color: var(--accent-color)
show_tooltip_total: true  # center total
entities:
  - entity: sensor.hvac_energy
    aggregate_func: sum
    color: "#E24B4A"
  - entity: sensor.lighting_energy
    aggregate_func: sum
    color: "#EF9F27"
  - entity: sensor.kitchen_energy
    aggregate_func: sum
    color: "#1D9E75"
100 % bar — pie_style: bar draws the same shares as one slim horizontal bar instead of a ring: segments in your entity order, each as wide as its share, rounded outer corners, pie_spacing as a pixel gap, labels per pie_label_format (left out of segments too narrow for them), and the pie's tooltip (name, value, unit, share) and tap action on every segment. Leave height unset for the compact 28 px strip, or set it to centre the strip in a taller area. Cumulative energy counters contribute their consumption over the visible period with aggregate_func: change; the center total and pie_3d do not apply. 10.8 kWh from the grid, 9.6 kWh from solar and 3.6 kWh from the battery give segments of 45 %, 40 % and 15 %:
chart_mode: pie
pie_style: bar               # one full-width horizontal bar, 28 px tall
pie_label_format: percentage # value (default) | percentage | both
show_legend: true
entities:
  - entity: sensor.grid_import_energy     # 10.8 kWh -> 45%
    name: Grid
    aggregate_func: change
    color: "#E24B4A"
  - entity: sensor.solar_self_consumed    # 9.6 kWh -> 40%
    name: Solar
    aggregate_func: change
    color: "#EF9F27"
  - entity: sensor.battery_discharged     # 3.6 kWh -> 15%
    name: Battery
    aggregate_func: change
    color: "#1D9E75"
Ranking
Horizontal bars sorted by value (highest first). Each bar shows name, proportional width, value, unit, and share percentage.
chart_mode: ranking
height: 200
entities:
  - entity: sensor.bedroom_temp
    color: "#E24B4A"
  - entity: sensor.living_room_temp
    color: "#378ADD"
  - entity: sensor.kitchen_temp
    color: "#EF9F27"
v4.05 — ranking_min_value and ranking_max_value trim the list. ranking_min_value: 5 drops idle appliances reading under 5 W from a power ranking; ranking_max_value: 20 on battery sensors lists only the ones at 20 % or lower; set both to keep a band. Both compare against the absolute value, and the card says so when every entity falls outside the range. Editor: Chart Settings → Chart → Ranking → Min Value / Max Value.
Heatmap
Days × hours color grid. Each cell represents one hour of one day, colored by intensity. Only the first entity is used.
chart_mode: heatmap
hours_to_show: 168
height: 250
entities:
  - entity: sensor.temperature
    color: "#ff4757"
The color range can be controlled three ways:
- Automatic — min/max derived from data
- Manual bounds — set entity
lower_bound/upper_boundfor a fixed color scale - Color thresholds — enable
color_thresholdsfor multi-color heatmaps (e.g., blue → green → red)
Calendar
GitHub-contribution-style weekly grid. Each cell = one day. Only the first entity is used.
chart_mode: calendar
hours_to_show: 720
height: 200
entities:
  - entity: sensor.energy_daily
    aggregate_func: sum
    color: "#1D9E75"
Radial Bar
Concentric progress arcs — each entity is a ring showing its value as a percentage of a defined range. The center displays the average.
chart_mode: radialbar
height: 250
entities:
  - entity: sensor.living_room_temp
    color: "#ff4757"
    lower_bound: 0
    upper_bound: 40
  - entity: sensor.bedroom_temp
    color: "#378ADD"
    lower_bound: 0
    upper_bound: 40
  - entity: sensor.garage_temp
    color: "#2ecc71"
    lower_bound: 0
    upper_bound: 40
Set lower_bound / upper_bound per entity to define the 0–100% range. If not set, the entity's historical min/max from the current time window is used. Supports color thresholds for dynamic ring colors.
Gauge
A needle dial per entity, arranged in a column grid. Unlike the Gauge display (which replaces a single state row), chart_mode: gauge is a full chart mode — every entity becomes its own dial.
chart_mode: gauge
height: 240
gauge_columns: 2              # grid columns (empty = auto)
gauge_span: 180               # arc sweep in degrees (90-360)
gauge_value_position: below   # below | above
gauge_value_size: 18          # px (empty = auto)
gauge_show_minmax: true       # show the 0 / max labels at the arc ends
entities:
  - entity: sensor.living_room_temp
    name: Living Room
    lower_bound: 0            # dial start (Min)
    upper_bound: 30           # dial end (Max)
    needle_color: "#e2d4d4"
    color_thresholds:
      enabled: true
      values:
        - { value: 0,  color: "#47fff3" }
        - { value: 15, color: "#eaff47" }
        - { value: 25, color: "#ff4757" }
  - entity: sensor.bedroom_temp
    name: Bedroom
    color: "#378ADD"
How it reads:
- Dial scale comes from each entity's
lower_bound/upper_bound(default0-100), relabeled Gauge Range -> Min / Max in the editor. - The arc fills the value range seen in the period — from the period minimum to the period maximum, not from the dial start. With
lower_bound: 0,upper_bound: 30and a day that ranged 24-30, the arc spans 24 -> 30. - The needle marks the live value — the entity's current
hassstate (falls back to the last data point when there is no live state). - Color thresholds paint the dial — the bright band and the faint background zones follow
color_thresholds. With Last Color enabled, the whole dial uses a single color taken from the current value instead of a per-step gradient. needle_colorsets the needle color independently (see Entity Colors) —threshold, a CSS color, or empty to follow the value color.gauge_show_minmaxprints the bound labels at the two arc ends; the hover tooltip shows the current value plus the period Peak and Low.
Each gauge is independent, so you can mix ranges, colors, and thresholds across entities in the same card. Columns wrap automatically (gauge_columns) and the value sits above or below each dial (gauge_value_position) so it never overlaps the needle.
Polar Area
Equal-angle slices with variable radius — larger values produce bigger slices. Like a pie chart but comparing magnitudes instead of shares.
chart_mode: polararea
height: 250
entities:
  - entity: sensor.living_room_temp
    color: "#ff4757"
  - entity: sensor.bedroom_temp
    color: "#378ADD"
  - entity: sensor.garage_temp
    color: "#2ecc71"
Includes concentric grid circles for reference. Percentage labels appear on slices ≥ 4%. The center shows the total.
Radar
Spider/polygon chart where each entity forms one spoke. The filled polygon reveals the overall sensor profile at a glance.
chart_mode: radar
height: 300
entities:
  - entity: sensor.temperature
    name: "Temperature"
    lower_bound: 0
    upper_bound: 40
  - entity: sensor.humidity
    name: "Humidity"
    lower_bound: 0
    upper_bound: 100
  - entity: sensor.co2
    name: "CO₂"
    lower_bound: 400
    upper_bound: 2000
  - entity: sensor.pm25
    name: "PM2.5"
    lower_bound: 0
    upper_bound: 50
Requires at least 3 entities. Each entity's value is normalized to its lower_bound / upper_bound range. Polygon grid rings provide reference levels. Colored dots at each vertex show the exact position, with value labels nearby. Supports color thresholds for per-dot colors.
State Timeline
Displays horizontal colored bars showing state changes over time — one row per entity, plus an extra row per comparison when compare is set. Entity names appear on the left, state labels inside each segment when wide enough. Hover for a tooltip showing state name, duration, and time range. Works with binary_sensor, input_boolean, input_select, and any entity with a state_map. Since v4.02, per-entity compare works here too — each comparison draws its own time-aligned row directly under the main entity's row; see Period Comparison.
type: custom:statistics-graph-chart-card
chart_mode: state_timeline
hours_to_show: 24
state_timeline_corner_radius: 3       # 0 = sharp, higher = rounder
entities:
  - entity: binary_sensor.window_living_room
    name: Living Room
    tap_action:                        # tap a row to open more-info or run an action
      action: more-info
    state_map:
      - value: "off"
        label: "Closed"
        color: "#e74c3c"
      - value: "on"
        label: "Open"
        color: "#5dade2"
v4.05 — the rows are 32 px tall by default and the colour band inside them never exceeds 24 px, whatever height says (it does not apply in this mode). state_timeline_row_height: 60 makes every row 60 px with the band filling it; range 24–160. v4.08 — the card is exactly as tall as its rows: height (the default 150 px, or height: auto) no longer leaves empty space under the last row. In a Sections grid with a fixed number of grid_options.rows the card still fills its cell.
v2.28 additions:
- Corner radius is configurable via
state_timeline_corner_radius(0–20 px, default 3). Set to0for sharp edges or use higher values for pill-shaped segments. - Horizontal scroll works via
max_visible_interval+scroll_mode, just like in regular Timeline. Load a week of history (hours_to_show: 168) but only show 24 hours on screen at once (max_visible_interval: 24) — the chart scrolls to reveal the rest. - Tap action is supported on each row. Because each row in state_timeline belongs to a single entity (comparison rows added by
comparebelong to their main entity) and its segments fill the row, tapping a row naturally means "do something with this entity". If the entity has atap_actionset it fires; otherwise a standard more-info dialog opens. - Attribute history (#219) — set an entity's
attributetogether with astate_mapto plot the recorded history of a categorical attribute instead of its main state. Ideal for values HA already records as attributes — a Wi-Fi band, a media remote'scurrent_activity, an HVAC action, a router/AP name — without creating a template sensor. The attribute's values are mapped throughstate_map, so the samelabelandcolorfields apply. Numeric attributes with nostate_mapare unaffected.
# Plot a TV remote's current activity instead of the remote's on/off state
- entity: remote.living_room_tv
  name: Activity
  attribute: current_activity
  state_map:
    - value: "Youtube"
      label: YouTube
      color: red
    - value: "Netflix"
      label: Netflix
      color: "#E50914"
v3.25 addition:
- Segment labels toggle — card-level
state_timeline_show_labels: falsehides the state labels drawn inside the segments for clean, label-free color bands; the hover tooltip still names each state. Defaulttrue— and labels only render in segments wide enough to fit them anyway. In the editor the checkbox sits next to Corner Radius in state_timeline mode. Accepts{{ }}templates — see Template Toggles. - Row labels wrap instead of being cropped — the entity-name column is measured against the actual text (not estimated from character counts), so it is exactly as wide as the longest name needs, capped at about a third of the card. A name that still doesn't fit wraps onto up to three lines, left-aligned, with the row growing to match — so a long friendly name stays fully readable even on a narrow card, a More Info dialog or a phone, and a short one gives all its space back to the timeline. Only a name too long for three lines is ellipsized, and it keeps the full text as a hover tooltip. The label is also clipped to its own column, so it can never paint past the edge of the card. (v3.31)
- Label size —
state_timeline_label_font_sizesets the font size in pixels (6–40) for both the state label inside each segment (default 10) and the entity name in the label column on the left (default 11) (v3.32). Both budgets follow it: a bigger segment label shows fewer characters with an ellipsis instead of spilling out, and a bigger entity name re-wraps across up to three lines with the row growing to fit. The editor field sits next to Show State Labels and, since it now also drives the entity-name column, stays available for the whole of State Timeline mode even with that toggle off (v3.32).
Slices — an uptime view per hour or day (v4.08)
A State Timeline row draws every state change where it happened. Over a day or a week that turns a busy sensor into a crowd of thin stripes. state_timeline_bucket cuts every row into equal time slices instead — one rounded block per hour, day, week… — each in the colour of the state that lasted longest in it. It answers the questions an uptime card answers: did the washing machine run in that hour, was the NAS online all day, which room was busiest each day?
type: custom:statistics-graph-chart-card
chart_mode: state_timeline
hours_to_show: 24
state_timeline_bucket: 1h            # one slice per hour; unset = the continuous bars
entities:
  - entity: binary_sensor.washing_machine_running
    name: Washing machine
    state_map:
      - value: "off"
        label: Idle
        color: "#757575"             # grey
      - value: "on"
        label: Running
        color: "#43a047"             # green
An hour turns green when the machine was Running longer than Idle in it — more than half of the hour when the sensor reported all along — and grey otherwise. Hover a slice to see the share of each state, e.g. Running 73% and Idle 27%.
Sensors with more states work the same way: each slice takes the colour of the state that lasted longest in it. A presence sensor that reports the room you are in shows, day by day, the room you spent the most time in:
type: custom:statistics-graph-chart-card
chart_mode: state_timeline
hours_to_show: 168                   # the last 7 days
state_timeline_bucket: 1d            # one slice per day
state_timeline_show_share: true      # e.g. "Living room 41%" at the end of the row
entities:
  - entity: sensor.presence_room
    name: Where was I?
    state_map:                       # value as Home Assistant reports it, then label and colour
      - value: kitchen
        label: Kitchen
        color: "#e53935"
      - value: living_room
        label: Living room
        color: "#1e88e5"
      - value: bedroom
        label: Bedroom
        color: "#8e24aa"
      - value: office
        label: Office
        color: "#fdd835"
For an uptime gradient, give the entity color_thresholds: each slice is then coloured by the share (0–100 %) of one state — the entity's share_state — and takes the colour of the highest threshold that share is above.
type: custom:statistics-graph-chart-card
chart_mode: state_timeline
hours_to_show: 168                   # the last 7 days
state_timeline_bucket: 6h            # four slices a day
state_timeline_show_share: true      # e.g. "Connected 99.6%" at the end of the row
state_timeline_corner_radius: 6      # rounder slices
entities:
  - entity: binary_sensor.nas_online
    name: NAS
    share_state: "on"                # the state whose share is measured (default: on)
    color_thresholds:
      enabled: true
      values:
        - value: 0                   # 95 % or less → red
          color: "#e53935"
        - value: 95                  # above 95 % → amber
          color: "#fb8c00"
        - value: 99                  # above 99 % → green
          color: "#43a047"
- Slice sizes — a whole number followed by
mormin(minutes),h(hours),d(days),w(weeks) ormo(months):15m,30m,1h,2h,6h,12h,1d,2d,1w,1mo,3mo…hour,day(ordate),weekandmonthwork too, and case and spaces don't matter. Mind thatmis minutes — months aremo. Unset, empty or any other value keeps the continuous bars exactly as before. - Aligned to the clock and the calendar in the card's time zone — minute and hour slices are counted from midnight (
6h→ 00:00, 06:00, 12:00, 18:00), day slices start at midnight, week slices on Home Assistant's First day of the week, month slices on the 1st. The first and last slices are cut at the edges of the chart's time window, so with a rollinghours_to_showthe first one is usually partial. With the date picker the slices fill the period on screen — the Day view with1hgives one slice per hour of that day. - Colour — the state that lasted longest in the slice, in its
state_mapcolour; on a tie, the state listed first. A state without acolor:there — and every state of an entity without astate_map, such as a plain binary sensor — gets a colour of its own from the card's state palette (the one state strips use), because slices carry no labels; give a state acolor:to choose it. Withcolor_thresholdsenabled on the entity, the slice takes the colour of the highest threshold itsshare_stateshare is above —transitionanddirectiondon't apply to slices. share_state(per entity) — the state whose share is measured, written as Home Assistant reports it (on,home,kitchen), not as its label; case matters. Unset =onwhen the entity has anonstate, as every binary sensor and input boolean does; for other entities the end-of-row share uses the state seen most and the threshold colours use the last entry of thestate_map. A value that is not one of the entity's states shows 0 % — an easy way to spot a typo.- No data — time without a recorded state does not count towards the colour or the end-of-row share: before the sensor's history starts (Home Assistant's recorder keeps 10 days of state history unless
purge_keep_dayssays otherwise), or the part of the window still in the future, such as the rest of today in the Day view. A slice with no data at all is drawn muted grey.unavailableandunknownare not gaps: the state before them carries on. Add- value: unavailableto thestate_mapto count them as a state of their own, with a colour of its own. - Tooltip — hovering a slice lists every state in it with its share of the slice, largest first, then No data for any part without data, and the slice's time range (dates only for day, week and month slices). These shares are of the whole slice and add up to 100 %; the colour and the end-of-row share count only the time with data.
- Too many slices — when the slices would be narrower than 2 px (
15mover a month, say), the rows stay continuous and the browser console says so; pick a larger slice or a shorter window. - Row share —
state_timeline_show_share: truewrites the share of each row's main state over the chart's time window at the right end of the row:On 73%,Living room 41%. The main state is theshare_statewhen set,onfor on/off entities, otherwise the state seen most. One decimal below 1 % and above 99 % (99.6%), whole numbers in between. It works with and without slices, and is left out on a card too narrow for it (the text may take at most half of the timeline's width). - Everything else keeps working — a zoom followed through
zoom_sync, horizontal scrolling withmax_visible_interval,comparerows (sliced too, with their own row share),tap_actionand live updates.state_timeline_corner_radiusrounds the slices as well — a large value gives the pill look of an uptime card. Slices carry no text, sostate_timeline_show_labelsonly affects the continuous bars. - Not
group_by— the slice size comes fromstate_timeline_bucketalone;group_bydoes not slice a State Timeline. - Editor — Slices and Show Share are in Chart → Visual Options (State Timeline mode), right below Corner Radius and Row Height; Share State is on the entity's Advanced tab, under the State Map box. A slice size set in YAML that is not in the list (e.g.
4h) is listed as written. card_mod— a slice is.sgc-stl-cell.sgc-stl-slice(plus.sgc-stl-nodatawhen it has no data); the end-of-row share is.sgc-stl-share.
Box Plot (new in v3.21)
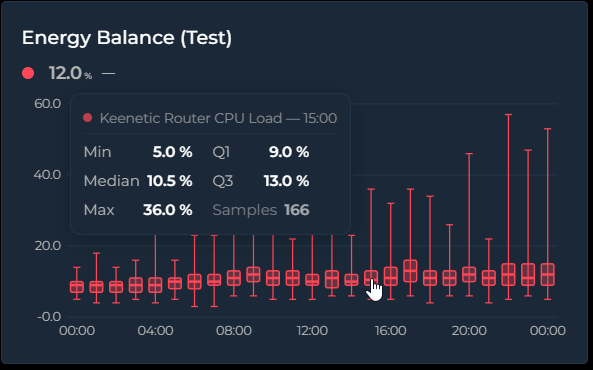
Set chart_mode: box to draw the value distribution per time bucket as classic
box-and-whisker plots. Each box summarizes every source sample that fell into its bucket:
- Whiskers — the thin line and caps spanning the bucket's minimum and maximum
- Box — spans Q1 → Q3, the middle 50% of the samples
- Median line — the thick line inside the box
Samples come straight from the dense source data, independent of points_per_hour, and pass
through the same per-entity transforms as every other mode (value_factor, invert,
value_transform, state_map, aggregate_func: diff). Hovering a box shows Min / Q1 / Median /
Q3 / Max and the sample count in a compact two-column tooltip.
Box Plot vs Candlestick — they look like cousins, but the body means something different. A candlestick body is open → close of the bucket: direction matters, color tells you up/down, and the order of values is essential — it's a momentum chart. A box plot body is Q1 → Q3 with the median inside: order is irrelevant, there is no open/close and no direction. "Where did it go?" → candlestick. "What was typical, and how much did it spread?" → box plot.
type: custom:statistics-graph-chart-card
chart_mode: box
card_header: Living Room — Daily Temperature Spread
hours_to_show: 720        # 30 days
group_by: date            # one box per day
entities:
  - entity: sensor.living_room_temperature
    name: Living Room
    decimals: 1
Tip: the bucket width follows group_by (hour, 2h … 12h, date, week, month,
year). With the default interval the card picks automatically from the window: ≤ 2 days → one
box per hour, ≤ 1 month → per day, ≤ 6 months → per week, longer → per month. The newest 60
buckets are shown when the window produces more.
Waterfall (new in v3.21)
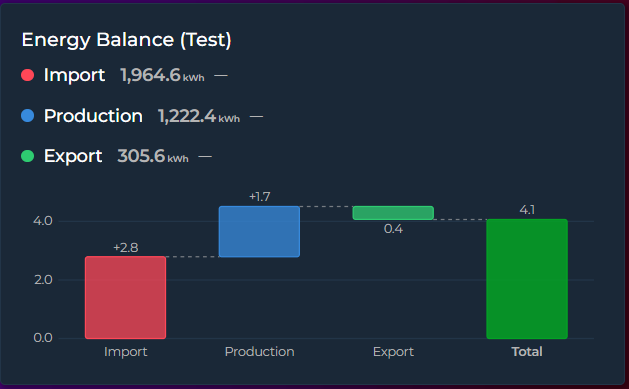
Set chart_mode: waterfall to turn each entity into one +/− step of a running total — the
classic bridge chart for energy balances, budgets, or any "these parts add up to this total"
story:
- Steps — one bar per entity; the step value is the entity's aggregate over the visible window (default
sum— steps are meant to add up) - Total — an automatic summary bar from zero to the running total (hide with
waterfall_total: false) - Connectors — dashed guide lines carry each bar's end level to the next bar
Colors: an explicit entity color always wins; otherwise positive steps use the theme success
color, negative steps the error color, and Total the primary color. The tooltip shows the step
value and the running total after it (the running-total line follows show_tooltip_total).
type: custom:statistics-graph-chart-card
chart_mode: waterfall
card_header: Energy Balance (30 days)
hours_to_show: 720
entities:
  - entity: sensor.grid_import_energy
    name: Grid Import
    aggregate_func: diff      # cumulative kWh counters need diff!
  - entity: sensor.solar_energy_produced
    name: Solar Production
    aggregate_func: diff
  - entity: sensor.grid_export_energy
    name: Grid Export
    aggregate_func: diff
    invert: true              # exported energy leaves the house → negative step
Tip: for total_increasing counters (energy meters) always use aggregate_func: diff — a
plain sum would add the meter reading over and over instead of the consumption. invert: true
makes a step subtract from the bridge.
Histogram (new in v3.21)
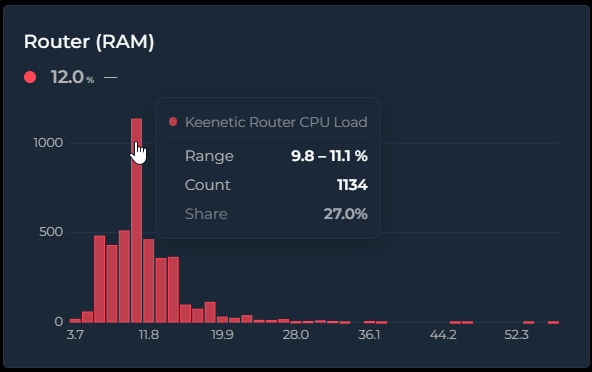
Set chart_mode: histogram to show the value-frequency distribution over the visible window:
the X axis is value ranges (bins), the Y axis is how often the value landed in each range. Time is
discarded entirely — it answers "what value does this sensor usually sit at, and how often?".
Histogram vs Bar — a bar chart's X axis is time: each bar is the value of one time slot ("CPU was 62% at 14:00"). A histogram's X axis is value ranges and Y is the count: "CPU spent most of this month in the 55–65% band". Bar tells you what happened when; histogram tells you what's typical and how often. Technically the bar chart draws the
points_per_hourdisplay series, while the histogram counts the dense source samples.
type: custom:statistics-graph-chart-card
chart_mode: histogram
card_header: Room Temperature Distribution
hours_to_show: 168        # one week
entities:
  - entity: sensor.living_room_temperature
    name: Living Room
    decimals: 1
Tip: bin count is automatic (Freedman–Diaconis, clamped to 5–40) — override it with
histogram_bins: 20 (2–80). X-axis labels sit centered under the bars and show each bin's
midpoint value. Multiple entities share the same bins side by side, so their distributions are
directly comparable; the tooltip shows the bin range, the count, and the share (the share line
follows show_tooltip_total).
Chart Mode Compatibility
Not all card options apply to every mode. The visual editor hides irrelevant options automatically.
| Feature | Timeline | State Timeline | Scatter | Pie | Ranking | Radial Bar | Polar Area | Radar | Heatmap | Calendar | Gauge | Box Plot | Waterfall | Histogram |
|---|---|---|---|---|---|---|---|---|---|---|---|---|---|---|
| Y / X axes | ✅ | X only | ✅ | — | — | — | — | — | Own axes | Own axes | Dial | Own axes | Own axes | Own axes |
| Grid | ✅ | — | ✅ | — | — | — | Grid circles | Polygon grid | — | — | — | Own grid | Own grid | Own grid |
| Stacked | ✅ | — | — | — | — | — | — | — | — | — | — | — | — | — |
| Offset | ✅ | — | — | — | — | — | — | — | — | — | — | ✅ | ✅ | ✅ |
| Period compare | ✅ | ✅ | — | — | — | — | — | — | — | — | — | — | — | — |
| Annotations | ✅ | — | — | — | — | — | — | — | — | — | — | — | — | — |
| Zoom brush | ✅ | — | — | — | — | — | — | — | — | — | — | — | — | — |
| Scroll | ✅ | ✅ | — | — | — | — | — | — | — | — | — | — | — | — |
| Sparkline | ✅ | — | — | — | — | — | — | — | — | — | — | — | — | — |
| Range Band | ✅ | — | — | — | — | — | — | — | — | — | Arc = range | Box = spread | — | — |
| Entity limit | ∞ | ∞ | 2 | ∞ | ∞ | ∞ | ∞ | 3+ | 1 | 1 | ∞ | ∞ | ∞ | ∞ |
| Entity graph_type | line/step/bar/candlestick | — | — | — | — | — | — | — | — | — | — | — | — | — |
| lower/upper_bound | Y axis range | — | — | — | — | 0–100% range | — | Normalization | Color scale | Color scale | Dial Min/Max | — | — | — |
📚 Feature Guides
🕒 Time, History & Comparison — Date Picker | Energy Date Sync | Show Full Period | Long-Range Views | Week Start | Time Offset | Period Comparison | Forecast Horizon
📅 Date Picker
A built-in date navigation panel that lets users browse historical data by Day, Week, Month, or Year — without leaving the dashboard.
Setup
type: custom:statistics-graph-chart-card
show_date_picker: true
date_picker_position: top
entities:
  - entity: sensor.temperature_living
    color: "#ff6b35"
Navigation
The date picker bar shows the current period label with arrow buttons to move forward/backward:
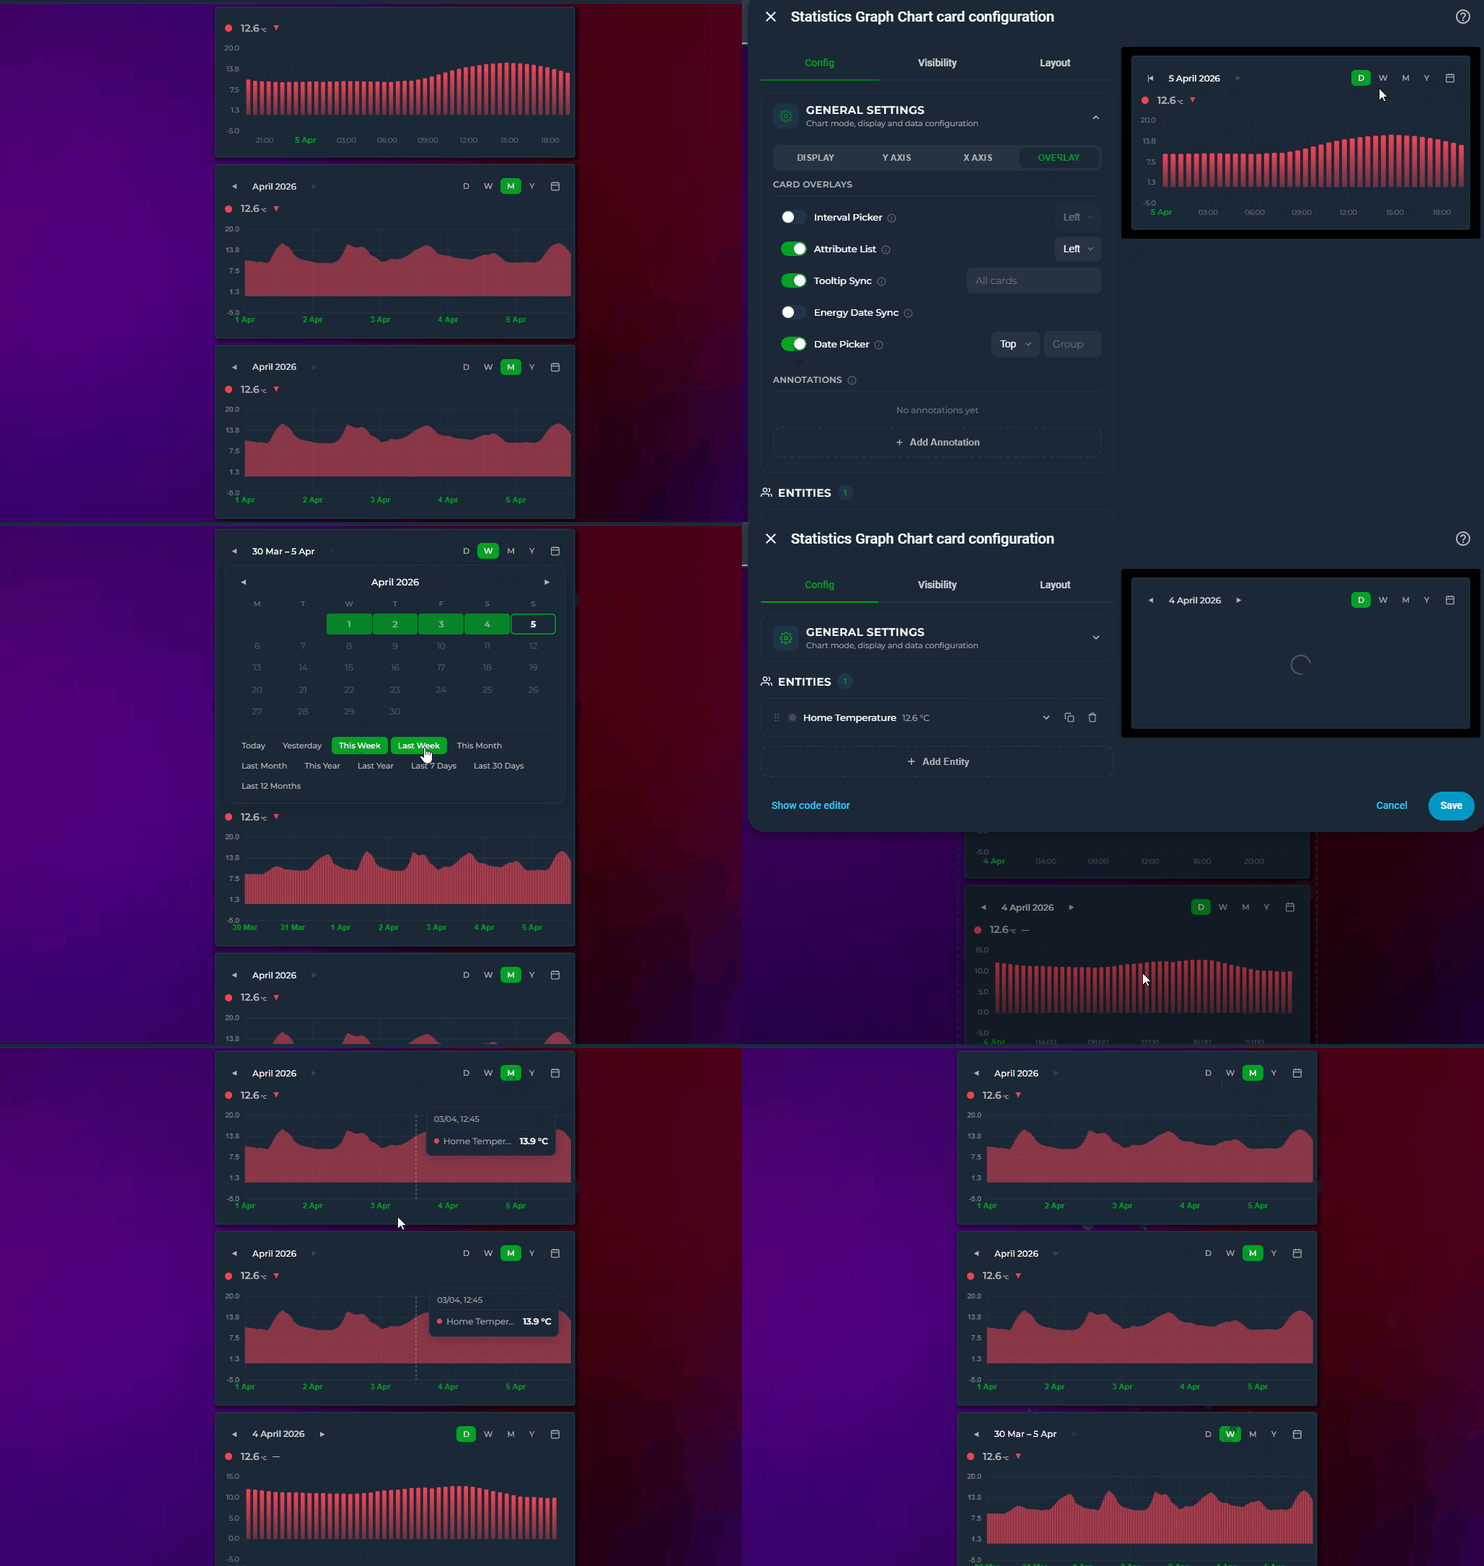
- D / W / M / Y — switch between Day, Week, Month, and Year views
- ◀ ▶ — navigate to the previous/next period
- 📅 — open the calendar popup for direct date selection
Layout: the ‹ period › navigator and the D/W/M/Y + 📅 shortcuts can each sit left / center / right:
date_picker_nav_position: center
date_picker_shortcuts_position: right
Calendar & Presets
Click the calendar icon to open a panel with:
- Calendar grid — click two dates to select a custom range
- Quick presets — Today, Yesterday, This/Last Week, This/Last Month, This/Last Year, Last 7 Days, Last 30 Days, Last 12 Months, Last 2 / 3 / 5 Years (v4.04)
The calendar stays open after selection so you can adjust the range. Click the 📅 icon again to close it.
Group Sync
Cards with the same date_picker_group share their date selection. You don't need a visible date picker on every card — only one card needs show_date_picker: true. Other cards in the same group will follow along automatically.
# Card 1: Has the visible date picker — this is the "controller"
show_date_picker: true
date_picker_group: bedroom

# Card 2: No visible picker — just follows Card 1
date_picker_group: bedroom

# Card 3: Also follows Card 1
date_picker_group: bedroom
Changing the date on Card 1 updates all three cards. Cards 2 and 3 show no picker UI but their data range follows the group selection.
This is ideal for dashboards where you want one date picker controlling multiple charts without repeating the picker bar on every card.
The same mechanism exists for the other on-card controls: interval_picker_group for the Interval Picker, and pph_picker_group / group_by_picker_group for the on-card Points/Hour and Group By pickers — each group is independent.
Customizing Modes
Control which period buttons appear with date_picker_modes:
# Show only Month and Year
date_picker_modes:
  - month
  - year

# Lock to Month — buttons hidden, navigation centered
date_picker_modes:
  - month
When only one mode is listed, the D/W/M/Y buttons are hidden entirely and the navigation (◀ label ▶) is centered for a minimal look. The 📅 calendar icon stays visible on the right.
Scrollback (Extended Window) (new in v3.29)
The arrows jump period by period — for a quick peek into the recent past without leaving the current view, add extended_window_multiplier:
show_date_picker: true
extended_window_multiplier: 2   # render 2× the period, scroll back through the extra half
The card renders N× the selected period but opens showing exactly the period you picked, at its own scale and bucket density — then you can scroll horizontally into the extra history (scrollbar or mouse wheel, per scroll_mode). It follows the picker: on a Week view one extra week sits behind the current one; switch to Day and it's one extra day. The picker's header and arrows stay on the selected period — scrolling is a peek, the arrows remain the navigation. Also works without the date picker (extends hours_to_show or graph_start periods the same way).
With forecast data (data_attribute entities or forecast_horizon data whose points reach into the future — weather, prices): the chart opens with the current period in view (right edge at "now"), with the forecast reachable by scrolling right and history by scrolling left. This also works together with graph_start: normally graph_start cuts the window at the period's end, but with the multiplier active the forecast tail is rendered and scrollable, and the viewport spans the full selected period (so the scale doesn't creep as the day progresses). show_full_period is the exception — it keeps its "whole period, cut at its end" contract.
Controller card — pickers without a chart (v4.03)
A Statistics Graph Chart Controller is a one-row card that contains only the date-picker bar and drives every chart card that shares its group. Add it from the card picker (Statistics Graph Chart Controller), or turn any card into one with chart_mode: controller. It fetches no data and needs no entities.
# the controller
type: custom:statistics-graph-chart-controller
sync_group: home
card_header: Period
date_picker_modes: [day, week, month, year, last_1h, last_6h, last_12h, last_24h, last_7d, last_30d]   # the default set
date_picker_default_mode: last_24h    # optional: open here on every load

# a chart it drives — no picker of its own, just the same group
type: custom:statistics-graph-chart-card
sync_group: home
entities:
  - entity: sensor.living_room_temperature
- One bar, one active state — calendar periods (D/W/M/Y with ◀ ▶, the calendar popup with presets and custom ranges) and rolling windows (
1H,6H,12H,24H,7D,30D…) share the bar. Choose the buttons withdate_picker_modes;date_picker_nav_position/date_picker_shortcuts_positionalign them. - Reset — the ↺ button returns to
date_picker_default_mode(or the first visible mode) and clears a custom range. A controller shows it by default (date_picker_reset: falsehides it); a normal chart card gets it withdate_picker_reset: true. - Rolling hours are exact —
1H,6Hand12Hcount elapsed hours, so a window that crosses a daylight-saving change is still 1, 6 or 12 hours long. - Late joiners — a chart card that loads after the controller asks for the current period when it connects, so it never starts out of step. The selection is remembered per group in the browser.
sync_groupfills the picker group keys that are left empty (date_picker_group,pph_picker_group,group_by_picker_group, andinterval_picker_groupon chart cards), so one name is enough on both sides. Chart cards in a controlled group should not show a date picker of their own — if one does, both are masters and the last click wins.- The controller can also host the Resolution and Group By pickers (Overlay tab in the editor, or
show_pph_picker: true/show_group_by_picker: true). Reset clears those overrides too. - A controller that has no remembered selection yet (first use in a browser, or the editor preview) asks its group for the current period before it broadcasts anything, so opening the card picker never resets a live dashboard.
- Layout: the card reports one row (
rows: auto, full width in Sections view by default); override withgrid_options. Chart-only options are ignored. - Cards still running an older card version ignore the
1H/6H/12Hmodes when a controller selects them (they keep their own mode and follow the offset only).
Editor — the controller's editor shows the Calendar tab (Sync Group, Reset Button, Visible Modes, Default Mode, Window Step, alignment), the Overlay tab reduced to the Resolution / Group By pickers, and the Card Settings panel. On a regular card, Chart Mode → Controller does the same.
Rolling windows (Last 1H … Last 5Y)
Alongside the calendar modes, the picker offers rolling windows that always end at now: last_1h, last_6h, last_12h, last_24h, last_3d, last_7d, last_15d, last_30d, last_90d, last_180d, last_12m, last_2y, last_3y, last_5y. Unlike Day / Week / Month / Year (which snap to calendar boundaries), these show the last N up to the current moment, and the ◀ ▶ arrows jump a full N back/forward (e.g. the previous 7 days).
Use them two ways:
# Always open on the last 7 days
show_date_picker: true
date_picker_default_mode: last_7d
# Offer rolling buttons in the picker bar (shown as 24H / 7D / 30D …)
show_date_picker: true
date_picker_modes:
  - day
  - last_7d
  - last_30d
- As Default Mode (
date_picker_default_mode) a rolling window is forced as the starting view on every load. - As Visible Modes (
date_picker_modes) the rolling options appear as extra buttons —1H,6H,12H,24H,3D,7D,15D,30D,90D,180D,12M,2Y,3Y,5Y— next to D/W/M/Y. Calendar modes are on by default; rolling buttons are off until you add them. In the editor the two families are shown under separate Calendar periods / Rolling windows headings, and on the picker bar a thin divider separates the D/W/M/Y buttons from the rolling ones so the two aren't mistaken for each other. (v3.30) - The label reads e.g. Last 7 days at the current window, switching to a date range (
May 16 – May 23) once you navigate back. - The multi-year windows
last_2y,last_3yandlast_5yare anchored to the same day and time two, three or five calendar years back, so the arrows step a full 2 / 3 / 5 years. Pair them withauto_scale_points: trueso the card buckets by month instead of trying to draw every interval, and expectlast/first/diff/maxaggregates to read from daily rows past roughly a year (the card logs a one-off console note when that happens). (v4.04)
Window Step
date_picker_step controls how many units make up one "window". Default 1 = the legacy behavior (each click moves one day, one week, one month, etc.). When you set it higher, the picker becomes a rolling N-unit window and prev/next buttons jump a full N units at a time.
# Last 4 weeks, prev/next jumps 4 weeks
show_date_picker: true
date_picker_step: 4
date_picker_modes:
  - week
# Last 30 days, prev/next jumps 30 days
date_picker_step: 30
date_picker_modes:
  - day
The label adapts automatically: step > 1 shows the date range (Mar 11 – Apr 7), step = 1 keeps the existing single-period labels (April 2026, Apr 1 – Apr 7).
Editor: General Settings → Calendar tab → Date Navigation → Window Step (appears next to Visible Modes when the date picker is enabled)
Behavior
| Period | X-axis range | Live updates |
|---|---|---|
| Today | 00:00 → end of day | ✅ Active |
| Yesterday | 00:00 → 23:59 | ❌ Paused |
| This Week | Monday 00:00 → end of week | ✅ Active |
| Last 7 Days | 7 days ago → now | ✅ Active |
| Custom range | Start → End | Depends on whether end is today |
Editor
General Settings → Calendar tab → Date Navigation → Date Picker toggle. Position and Group options appear on the same row. The Group field is always editable — even when the Date Picker toggle is off — so you can assign a group to cards that don't show their own picker. When enabled, a Visible Modes section appears below with D/W/M/Y checkboxes plus the rolling options (24H / 3D / 7D … 12M / 2Y / 3Y / 5Y), and a Default Mode dropdown that also lists the rolling windows. The Date Nav and Shortcuts dropdowns control where the navigator and the mode buttons sit in the bar.
Notes
- Cannot be used together with
energy_date_sync— enabling one disables the other - Date picker state is persisted in
localStorageand restored on page reload - When viewing the current period, the X-axis extends to the end of the period with empty space after the current time
- Cards with only
date_picker_group(noshow_date_picker) use their normalhours_to_showuntil a sync event arrives from a card in the same group
🏷️ Area names
Append each entity's Home Assistant area to its label. Handy when a card mixes rooms, and essential with integrations like Advanced History that hand several entities the same friendly name (three Heating Temperature sensors, one per room, otherwise indistinguishable):
type: custom:statistics-graph-chart-card
include_area_names: true   # default false
entities:
  - entity: sensor.lounge_heating    # friendly_name: "Heating Temperature"  (area: Lounge)
  - entity: sensor.office_heating    # friendly_name: "Heating Temperature"  (area: Office)
  - entity: sensor.fridge            # friendly_name: "Fridge Temp"          (area: Kitchen)
  - entity: sensor.lounge_lamp       # friendly_name: "Lounge Lamp Power"    (area: Lounge)
Legend result:
Heating Temperature · Lounge
Heating Temperature · Office
Fridge Temp · Kitchen
Lounge Lamp Power              ← already says "Lounge", not doubled up
Only the area name (v4.07)
When every sensor on the card stands for one room, the entity name is noise: what you want to read under each value is just the room. use_only_area_name: true replaces the label with the area alone — the value on top, Master Bedroom below it — in the state row, legend, tooltip, stats, exports and the pie, ranking and other summary charts:
type: custom:statistics-graph-chart-card
use_only_area_name: true   # default false
entities:
  - entity: sensor.bedroom_multisensor_temperature   # friendly_name: "Monitorbug-Morty Multisensor Temperature"  (area: Master Bedroom)
  - entity: sensor.theatre_rack_temperature          # no area of its own — its device is in Theatre Room
  - entity: sensor.garage_temperature                # no area
State row result:
21.4 °C            24.1 °C         14.2 °C
Master Bedroom     Theatre Room    Garage Temperature   ← no area, keeps its own name
The rules below apply unchanged: the area comes from the entity or, failing that, its device; an explicit name: is never touched; a comparison ghost reads Master Bedroom (previous period). The "name already contains its area" rule has nothing to do here — Master Bedroom Humidity simply becomes Master Bedroom, so two entities in the same room get the same label; give one of them a name: if you need to tell them apart. The area is the whole label, so the Attribute names options do not touch it (an entity without an area still follows them); for Current temperature · Lounge use use_only_attribute_name together with include_area_names. use_only_area_name and include_area_names are alternatives: the visual editor turns one off when you switch the other on, and in YAML use_only_area_name wins if you set both.
Rules
- Every entity that has an area gets it — there is no duplicate detection. A rule that only fired on collisions would make your legend change shape whenever an unrelated entity was added or removed; if you switch this on, you want the areas.
- The area is taken from the entity's own area registry entry; if it has none, the card falls back to the entity's device area. If neither resolves, the name is left unchanged.
- A friendly name that already contains its area (e.g. Lounge Heating Temperature in the Lounge) isn't doubled up.
- An explicit
name:(including template names) is your own label and is never modified. - Applies to the state row, legend, tooltip, stats, exports and the editor's entity list, so every surface agrees.
- Comparison ghosts inherit the parent's label — Heating Temperature · Lounge (previous period), or Lounge (previous period) with
use_only_area_name. - Off by default. Resolution is a couple of registry key-lookups per configured entity, so the cost is negligible.
Editor
General Settings → Chart tab → Visual Options → the Area names and Area names only (v4.07) toggles (next to the legend options). Switching one on turns the other off.
🏷️ Attribute names (v3.32)
When a card plots two attributes of the same entity, both series carry that entity's friendly name — so the legend and the tooltip show the same label twice and there is no way to tell which line is which:
entities:
  - entity: climate.lounge_heating
    attribute: current_temperature     # legend: "Lounge Heating"
  - entity: climate.lounge_heating
    attribute: temperature             # legend: "Lounge Heating"   ← identical
Two card-level options qualify the label with the attribute, everywhere the name appears — state row, legend, tooltip, stats and exports:
include_attribute_name: true      # "Lounge Heating · Current temperature"
use_only_attribute_name: true     # "Current temperature"
| Options | Label |
|---|---|
| neither | Lounge Heating |
include_attribute_name |
Lounge Heating · Current temperature |
use_only_attribute_name |
Current temperature |
use_only_attribute_name + include_area_names |
Current temperature · Lounge |
use_only_area_name (v4.07) |
Lounge |
use_only_area_name + either attribute option |
Lounge — the area is the whole label |
Details:
- Only rows that actually plot an attribute change. An entity graphed on its own state has no attribute name, so it is left exactly as it was — which means you can turn these on for a whole card without touching its ordinary series.
- An explicit
name:always wins, as everywhere else in the card. - The attribute label comes from Home Assistant's own translated attribute name when your HA version provides one, so a German dashboard reads Zieltemperatur. Otherwise the attribute key is humanised:
current_temperature→Current Temperature. The runtime attribute picker uses the same label, so the dropdown and the chart always name an attribute the same way (v3.32). - With
ref_entity, both halves of the combined name are qualified —Current Temperature - Target Temperaturerather than one attribute minus a bare entity name. - Rows using
data_attribute(an attribute array such as a forecast) are never renamed afterattribute:, since that is not what they plot. - If you switch attributes with the runtime attribute picker, the label follows.
- The two options are alternatives, not a stack. In the visual editor, switching one on turns the other off; in YAML,
use_only_attribute_namewins if you set both. - It cooperates with
include_area_names: the "name already contains its area" rule is evaluated against the label you will actually see, soLounge Heatingkeeps its area suppressed whileCurrent temperaturecorrectly gains· Lounge. - With
use_only_area_namethe area is the label: an entity whose area resolves readsLoungewhatever the attribute options say, while entities without an area still follow them. For the attribute and the room, combineuse_only_attribute_namewithinclude_area_names—Current temperature · Lounge(v4.07).
Editor
General Settings → Chart tab → Visual Options → the Attribute names and Attribute names only toggles, next to Area names and Area names only.
⚡ Energy Date Sync
Syncs the card's time range with Home Assistant's Energy dashboard date picker or the energy-period-selector-plus custom card.
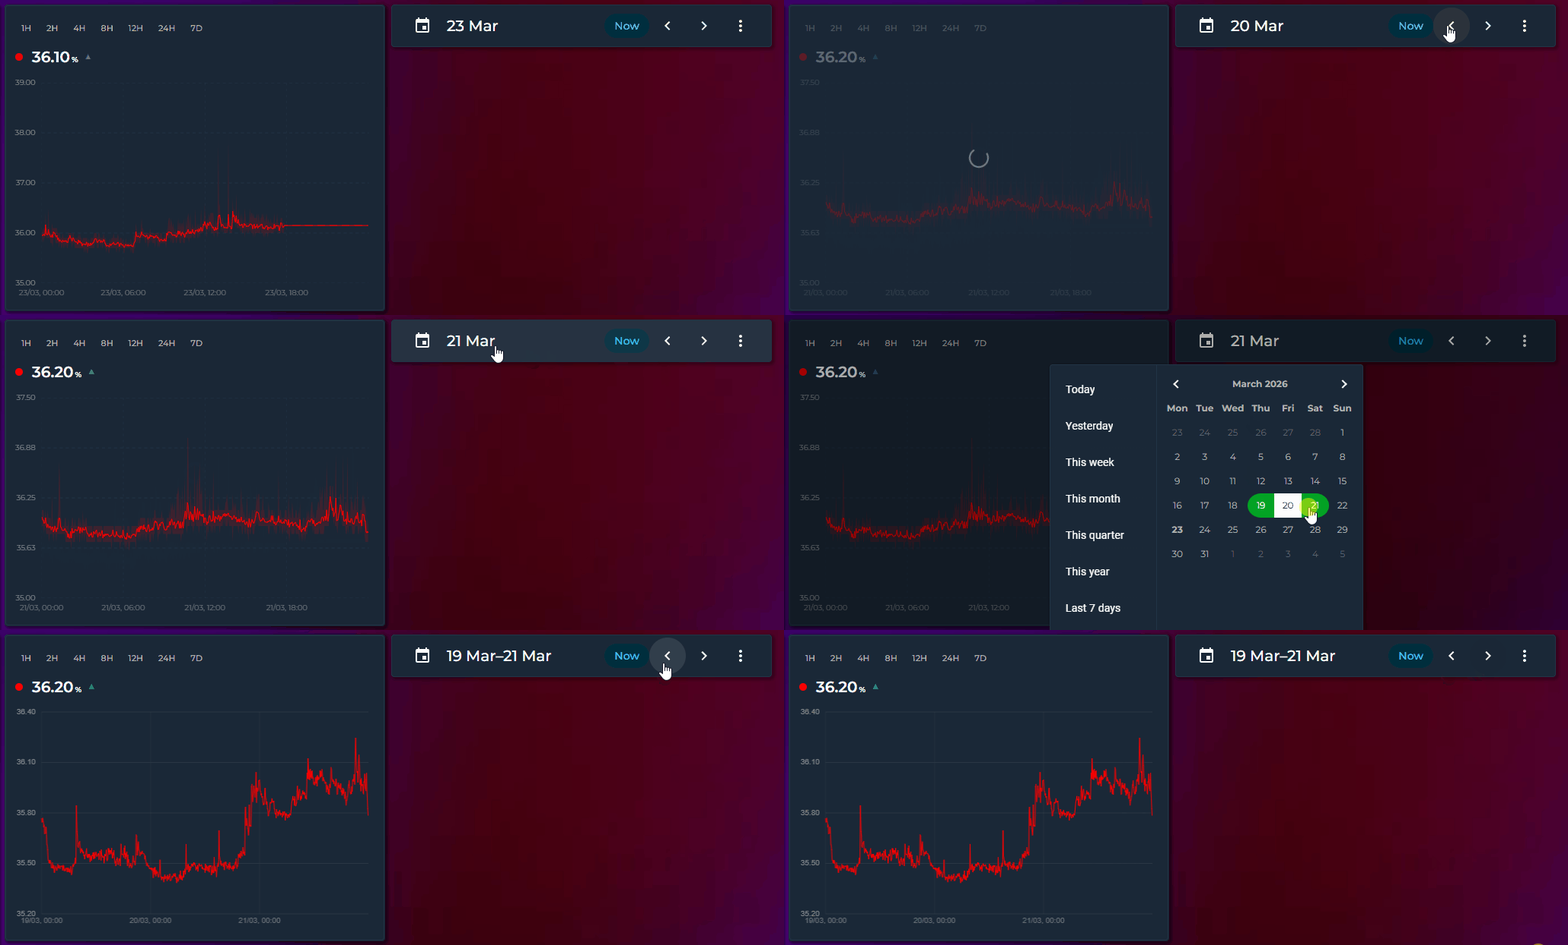
Setup
type: custom:statistics-graph-chart-card
energy_date_sync: true
entities:
  - entity: sensor.energy_consumption
    color: "#ff4757"
    aggregate_func: sum
  - entity: sensor.solar_production
    color: "#2ecc71"
    aggregate_func: sum
Place the card on the same dashboard as an Energy date picker. When the user selects a day, week, month, or custom range, this card automatically updates to show the same period.
Behavior
| Date selection | X-axis range | Live updates |
|---|---|---|
| Today | 00:00 → current time | ✅ Active — graph updates in real time |
| Yesterday | 00:00 → 23:59 | ❌ Paused — historical data is frozen |
| This week | Monday 00:00 → current time | ✅ Active |
| Last week | Monday 00:00 → Sunday 23:59 | ❌ Paused |
| This month | 1st 00:00 → current time | ✅ Active |
| Custom range | Start → End (clamped to now if end is in the future) | Depends on whether end is today |
Compatible with
- HA's built-in Energy dashboard date picker (DAY / WEEK / MONTH / YEAR)
- energy-period-selector-plus custom card
- Any card that uses HA's energy data collection system
Editor
Chart Settings → Calendar tab → Date Navigation → Energy Date Sync toggle, with the Key input next to it for energy_collection_key (v4.02).
Notes
- When
energy_date_syncis active, it overrideshours_to_showand the interval picker selection - Running several dashboards with separate
energy-date-selectioncards? Bind each card to its own picker withenergy_collection_key— same key as that dashboard's selection card (HA requires the key to start withenergy_) (v4.02) - Period changes made in the Energy dashboard are picked up instantly — no polling, no refresh delay
- If the Energy panel hasn't loaded yet, the card retries every 2 seconds for up to 60 seconds
📅 Show Full Period
Extends the X-axis to cover a complete calendar period, leaving empty space after the current time. A dashed vertical "now" line marks where live data ends.
graph_start_hour: 0
hours_to_show: 24
show_full_period: true    # X-axis: 00:00 → 23:59, empty after now
The end of the period is determined by graph_start:
graph_start |
X-axis extends to |
|---|---|
| off | End of today (next midnight) |
week |
End of week (next Monday 00:00) |
month |
End of month (1st of next month) |
year |
End of year (Jan 1st next year) |
With Energy Date Sync
show_full_period also works with energy_date_sync: true. When the energy date picker selects a current period (today, this week, this month), the X-axis extends to the full period end. Past periods display in full as before.
energy_date_sync: true
show_full_period: true    # energy picker "This Month" → X-axis: Apr 1 → May 1
This is especially useful for:
- Imported data (energy, gas) that arrives with a few days delay — the graph shows the gap instead of filling it with the last known value
- Day comparison with offset — today's card shows a partial day with empty space; yesterday's card (offset: 24) shows a complete day
- Weekly/monthly dashboards — see the full period at a glance with the "now" marker
- Energy dashboard — combine with
energy_date_syncto see the full billing period - Solar forecast rows (
solar_forecast: true) — a synced or date-picker window without it ends at now and is then stretched to the last forecast hour; with it the card stays on the selected period and the forecast is clipped to it
Editor: General Settings → Calendar tab → Time Window → Show Full Period checkbox
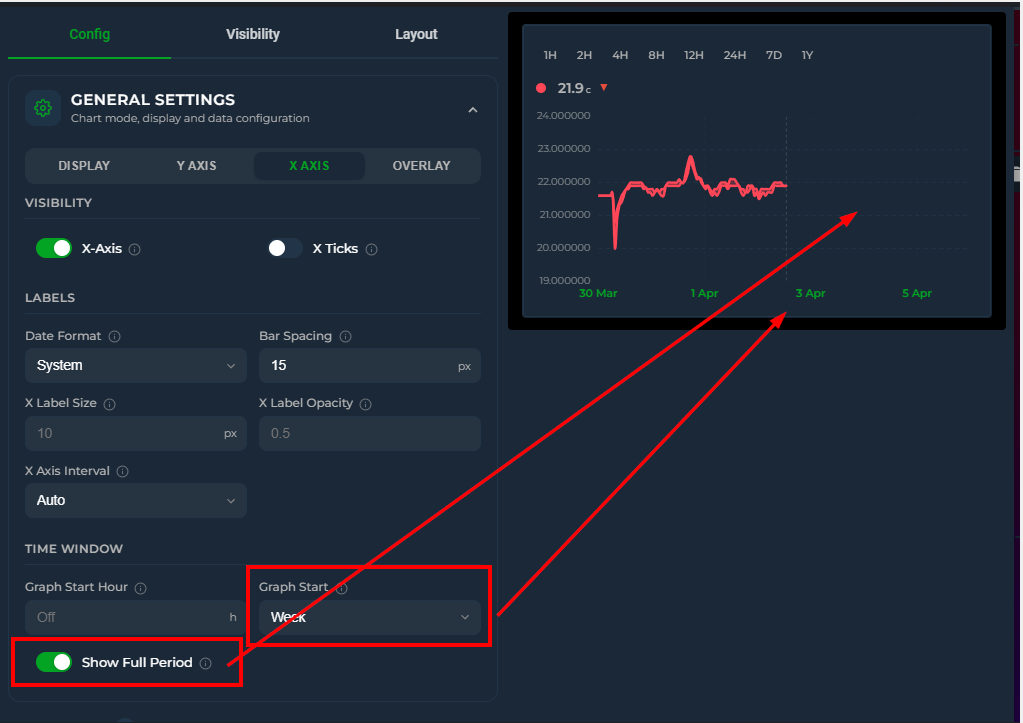
📅 Long-Range Views
Visualize data over weeks, months, and years with calendar-aware grouping and native HA statistics.
Weekly, Monthly, and Yearly Grouping
group_by: week
graph_start: month         # this month's weeks
aggregate_func: change     # consumption per week
graph_type: bar
group_by: month
graph_start: year          # start from Jan 1
group_by: year
hours_to_show: 87600       # ~10 years
aggregate_func: change     # annual consumption
graph_type: bar
When group_by is set to date, week, month, or year, the card fetches data using native HA statistics periods (period: 'day', 'week', 'month'). Year mode fetches monthly data and aggregates client-side. This enables Home Assistant's native change column for counters (a change series on a sensor without that column — state_class: measurement — reads hourly rows instead, like diff, max, first and last on such sensors (v4.06)) and bypasses the database retention limit — you can display a full year of data even if your recorder purge is set to 10 days.
Mixing groupings in one chart (v4.05)
A daily series and a monthly total of the same sensor — or a daily temperature line with monthly energy bars — can share one chart. Each entity may carry its own group_by; the chart's time grid is the finest grouping in use, and every series grouped coarser than that grid is drawn as calendar cells on it:
type: custom:statistics-graph-chart-card
graph_start: year
group_by: date
entities:
  - entity: sensor.heat_pump_energy
    name: Monthly
    graph_type: bar
    aggregate_func: change
    group_by: month            # monthly cells on the daily grid
    y_axis: secondary          # kWh on the right axis
  - entity: sensor.outside_temperature
    name: Temperature
    aggregate_func: avg        # daily mean, drawn on top
- The monthly bars span their whole calendar month (real spans on the daily axis, not equal-width slots); a window that starts mid-month gets a partial first cell. List the coarse entity first so it draws behind the finer ones.
- The tooltip shows the day's values and the containing month's total; stacking never mixes different grids.
- The grid follows the finest grouping:
group_by: monthon the card withgroup_by: dateon one entity gives a daily grid where the other entities become monthly cells — the same chart asdateon the card withmonthon them. Onlyraw/intervalcannot be set per entity, and nothing changes while the card is grouped byraw. - Y axis: a monthly total is ~30× a daily value in the same unit, so give it
y_axis: secondary(its ticks sit at the same heights as the left axis, both zeros on the shared baseline) orindependent(private hidden scale). Editor: Entities → entity → Data → Group By.
Auto-Routing to Long-Term Statistics
Even in interval mode with short ranges (hours_to_show ≤ 24), the card auto-routes to long-term statistics in three cases:
- Any entity declares
statistic_idexplicitly — the user vouches that the entity has long-term statistics available. Useful for entities that exist only in the statistics database (Gazpar, Linky, etc.) or for forcing the route. hours_to_show > 240(≈ 10 days, the typical recorder retention) — statistics is the only source that can serve the range, so the card switches automatically.- Missing recorder coverage (v4.06) — when the raw history of a
data_source: autosensor does not reach the start of the window (no recorded state at or before the window start, or a recorded state followed by a gap of at least 2 hours / a quarter of the window during which the long-term statistics show the value moving), that sensor is read from 5-minute statistics for that refresh. A sensor that simply did not change stays on raw history;data_source: historyopts out.
In both cases the route is conditional on every relevant entity having long-term statistics available — meaning a state_class of measurement, total, or total_increasing, or an explicit statistic_id. If any entity in the card lacks LTS, the route falls back to the regular history API to keep that entity working.
When the requested range exceeds 10 days but some entities lack LTS, a console warning is printed once listing the offending entities and explaining how to enable state_class in HA.
Date picker, synced picker groups and the Controller card (v4.04) — a picker view of a day or less (Day, 24H, 12H, 6H, 1H, today so far, or a short custom range) that reaches no further back than about 10 days is treated like a short hours_to_show card and reads raw recorder history, so short spikes keep their real height. Longer views (Week, Month, 7D, 30D …), older days, cards that contain an energy counter (total / total_increasing), a statistic_id, a ref_entity or a price_entity, and Energy-dashboard sync keep using long-term statistics. If the recorder no longer holds the start of the window (a purge_keep_days shorter than the window, a purged or re-created sensor, or statistics written for hours the recorder never recorded), the card switches that sensor to statistics by itself — on picker days and, since v4.06, on every short hours_to_show / interval-picker window. Set data_source: statistics to keep the smoother statistics view on picker days.
Statistics store 5-minute averages, which flatten bursts shorter than a few minutes. On long views, use aggregate_func: max when the peak matters more than the average. Statistics averages are also weighted by time: a 5-minute row holds the value averaged over the minutes it was valid, whereas a bucket built from raw history averages the readings recorded inside it, each counting once. A sensor that changes rarely (a setpoint held for 59 minutes, then changed once) shows the new reading as that hour's avg on raw history and the time-weighted value on statistics, so the same hour can read differently on a 24-hour and a 48-hour card. Sensors that report at a steady pace give the same number either way.
Graph Start Anchoring
When graph_start is set, hours_to_show is ignored — the calendar period directly determines the start:
| Value | Behavior |
|---|---|
week |
Start from Monday 00:00 |
month |
Start from the 1st of the month |
year |
Start from January 1st |
Editor: General Settings → Calendar tab → Time Window → Graph Start
Year starting in another month (v4.05)
A heating season, a school year or a fiscal year does not start on 1 January. year_start_month moves the start of the Year period:
show_date_picker: true
date_picker_default_mode: year
year_start_month: 7              # 1 Jul → 30 Jun, header reads 2026/27
group_by: month
entities:
  - entity: sensor.gas_consumption
    aggregate_func: change
    graph_type: bar
    compare: last_year           # ghost = 1 Jul 2025 → 30 Jun 2026
The same key shifts graph_start: year (with show_full_period the axis then runs to 30 June). It only moves the window: the month buckets, the tick labels and the Month / Week periods stay on the calendar. Every card in a date_picker_group should carry the same value — the group shares mode and offset, each card computes its own window. Editor: Chart Settings → Calendar → Time Window → Year Starts In.
Graph Start: Tomorrow
graph_start: tomorrow sets the window to tomorrow 00:00 → end of day — ideal for next-day spot prices (Nord Pool, EPEX, Tibber) via data_attribute. The window extends into the future automatically without show_full_period.
type: custom:statistics-graph-chart-card
card_header: Tomorrow Spot Prices
graph_start: tomorrow
group_by: hour
entities:
  - entity: sensor.nord_pool_fi_contract_current_price
    data_attribute: tomorrow_hourly
    data_time_field: start
    data_value_field: value
    graph_type: bar
    decimals: 2
    unit: c/kWh
X-Axis Interval
Manual control over tick spacing:
x_axis_interval: 2h    # Every 2 hours (00:00, 02:00, 04:00…)
x_axis_interval: 1d    # Daily (midnight)
x_axis_interval: 1w    # Weekly (Mondays)
x_axis_interval: 1M    # Monthly (1st of month)
Available presets in the editor: Auto, 1H–12H, 1D, 2D, 7D, 1W, 2W, 1M, 3M.
Editor: General Settings → X-Axis → X Axis Interval
Axis Style: matching Home Assistant's own charts (v4.03, widened in v4.04)
By default the card draws its axes and grid deliberately subtler than Home Assistant's built-in charts: labels use the theme's secondary text colour with some transparency, and the grid is a faint neutral grey. If you would rather have the card look exactly like the core statistics-graph card next to it, switch the axis style:
axis_style: native
native takes the label colour, size and grid colour from the same theme variables Home Assistant's charts use (--primary-text-color at 12 px for the labels and date markers, --divider-color for the grid), so the card follows light, dark and custom themes without any fixed colours in your YAML. Options you set explicitly (x_axis_color, x_grid_opacity, …) still override the preset, and the editor placeholders show which value applies.
(v4.04) native also covers the per-entity legend — the one you get with show_in_legend on an entity. Its names and values switch to --primary-text-color at full strength, and the values grow to the same 12 px as the axis labels, instead of the card's dimmer, smaller look. The MIN / AVG / MAX labels stay small and dim so the value still reads first, and the compact legend (show_legend) is unchanged — it was already using the theme's main text colour at 12 px.
There is no legend-only switch. If you want the dimmer legend back you have to go back to
axis_style: subtle, which also returns the axes and grid to the card's own look — write the individual axis options out explicitly if you want to keep the native axes.
Editor: Card Settings → Card Styling → Axis Style
Grid Customization
Control the appearance of horizontal (Y) and vertical (X) grid lines independently.
y_grid_style: solid      # dashed (default), solid, dotted, long-dash
y_grid_width: 0.5         # thickness in px (default: 1)
y_grid_color: "rgba(255,255,255,0.1)"  # any CSS color or {{ template }}
y_grid_opacity: 0.3       # 0–1 (default: 0.15)

x_grid_style: dotted
x_grid_width: 0.5
x_grid_color: "var(--divider-color)"
x_grid_opacity: 0.3
Editor: Y Axis tab → Grid section, X Axis tab → Grid section
Smart X-Axis Labels
The X-axis automatically adapts to the group_by setting:
- Week — Ticks on Mondays: "3 Mar", "10 Mar"
- Month — Ticks on the 1st: "Jan", "Feb" (with year when spanning multiple years)
- Date — Daily ticks: "3 Mar", "4 Mar"
- Hour — Hourly ticks; midnight shows date instead of "00:00"
In interval mode, midnight labels also show the date for any view longer than 12 hours.
📆 Week Start
Everything week-shaped on the card follows Home Assistant's "First day of the week" user setting (your profile page) — no YAML, no card option.
What follows the setting
- Weekly buckets —
group_by: weekbuckets start on your configured weekday - Date picker — the Week view's window and the calendar popup's day grid both start on that day
- X-axis ticks — weekly tick marks (automatic weekly labels and
x_axis_interval: 1w) land on that weekday - Box Plot — weekly box buckets align to the same boundary
Automatic (the setting's default) derives the first day from your language, exactly like the rest of HA — Monday for most European locales, Sunday for en-US.
Recorder note
Home Assistant's recorder computes weekly long-term statistics Monday-anchored on the server — there is no Sunday-based weekly row to fetch. When your week starts on any day other than Monday, the card transparently fetches daily statistics rows instead and builds the weekly buckets client-side, so totals and change aggregates stay correct. Nothing to configure. The same applies when the card's time zone differs from the Home Assistant server's: daily, weekly and monthly rows are stamped at the server's midnight, so the card then reads hourly statistics (for windows up to a year) and builds the day / week / month cells in the card's own zone.
↔️ Time Offset
Compare the same sensor across different time periods by adding multiple entity entries with different offset values. Each offset shifts that entity's data backward in time while keeping it aligned on the same graph.
hours_to_show: 168
entities:
  - entity: sensor.energy_consumption
    name: "This week"
    offset: 0
    color: "#ff4757"
  - entity: sensor.energy_consumption
    name: "Last week"
    offset: 168
    color: "#378ADD"
  - entity: sensor.energy_consumption
    name: "2 weeks ago"
    offset: 336
    color: "#2ecc71"
How It Works
offset: 168means "fetch data from 168 hours (7 days) before the current display window"- The fetched data is time-shifted forward to align with the current window on the X axis
- All rendering features work at full quality — line, bar, step, fill, gradient, points, tooltips, stacking, zoom
- Each entity with an offset gets its own API call with the correct time range
Common offset values
| Offset | Period |
|---|---|
24 |
Yesterday |
168 |
Last week |
336 |
2 weeks ago |
720 |
Last month (~30 days) |
8760 |
Last year |
Dynamic Offset via Helper Entity
Instead of a fixed number, you can point offset to any HA entity whose state is a number (in hours). The card reads the entity's current state and re-fetches history automatically when it changes.
entities:
  - entity: sensor.energy_consumption
    name: "Current"
  - entity: sensor.energy_consumption
    name: "Comparison"
    offset: input_number.comparison_offset
    color: "#378ADD"
This works with any entity type — input_number, template sensors, or any sensor that outputs a numeric state. Combine with HA template sensors for fully dynamic comparisons:
# In HA configuration.yaml
template:
  - sensor:
      - name: "Dynamic Offset"
        state: "{{ 24 if now().weekday() < 5 else 168 }}"
        unit_of_measurement: "h"
Editor
Entity → Advanced tab → Advanced Calculations → Offset (in hours).
Notes
- Offset entities do not receive live WebSocket updates (they show historical data)
- The state row, sparkline, and gauge correctly display the last value from the offset time window — not the live entity state
- Works with all chart modes that support multiple entities
- Can be combined with
value_transform,value_factor, and all other entity options - Each offset generates a separate cache entry, so switching between views is fast
👥 Period Comparison
Overlay a faded "ghost" of the same entity from a previous period underneath the main series — today vs yesterday, this week vs last week, this month vs last month — with a single per-entity compare option. Unlike a manual Time Offset entry, compare needs no duplicate entity: the ghost inherits the main entity's whole configuration and stays in lock-step with it. Since v3.26, compare also accepts a list of comparisons — one ghost per entry, each reaching further back via periods_back — see Multiple comparisons below.
Minimal setup
type: custom:statistics-graph-chart-card
card_header: Power — Today vs Yesterday
hours_to_show: 24
entities:
  - entity: sensor.power_consumption
    compare: yesterday
Short forms
| Value | Ghost shows |
|---|---|
previous_period |
The window immediately before the visible one (a 24h view compares against the 24h before it) |
yesterday |
Same window, one day earlier — same wall-clock time, so a daylight-saving change does not slide the ghost |
last_week |
Same window, one week earlier — same wall-clock time |
last_month |
Same window, one month earlier |
last_year |
Same window, one year earlier |
| number | Same window, that many hours earlier |
true |
Shorthand for previous_period |
Styled example (object form)
For full styling control, use the object form — every sub-option is optional:
type: custom:statistics-graph-chart-card
card_header: Energy — This Week vs Last Week
hours_to_show: 168
group_by: date
entities:
  - entity: sensor.energy_daily
    name: Energy
    graph_type: bar
    aggregate_func: change
    color: "#2ecc71"
    compare:
      period: last_week      # which period the ghost shows
      color: "#9b59b6"       # empty = faded main color
      opacity: 0.6           # 0.05–1
      line_style: solid      # dashed (default) | solid | dotted
      line_width: 1.5        # empty = same as main
      show_fill: true
      show_points: false
      show_in_legend: true   # empty = inherit the main entity's setting
      show_in_compact_legend: false   # empty = inherit; false leaves only the ghost out of the compact legend
      show_delta: true       # Δ% next to the main value in the tooltip
| Sub-option | Default | Description |
|---|---|---|
period |
previous_period |
Which period the ghost shows — same values as the short forms above (previous_period, yesterday, last_week, last_month, last_year, or a number of hours). |
layout |
overlay |
(new in v4.02) How the comparison is drawn. overlay (default) draws the ghost on top of the live data, time-aligned. sequential extends the X axis backward and draws the previous period at its real position, before the live data — a continuous past-to-present view. previous_period only, line/bar (timeline) charts only. Also available as a Layout dropdown on each editor row. |
periods_back |
1 |
(new in v3.26) How many periods back this comparison reaches — an integer ≥ 1, max 520. 1 = the previous period, 2 = two periods ago, and so on; the value multiplies the shift of period (e.g. period: last_week + periods_back: 2 = two weeks ago). Most useful in the list form below. |
hide_on_load |
false |
(new in v3.26) This comparison starts hidden when the card loads — click its legend entry to reveal it (the reveal sticks; it is not re-hidden). Note that clicking the main series in the legend still toggles the whole comparison group together. Also available as a Hide on Load toggle on each editor row. |
color |
null |
Ghost color. Empty = a faded version of the main entity color. The editor offers the standard color picker for this field, with {{ }} template support. |
opacity |
0.45 |
Ghost opacity, 0.05–1. |
line_style |
dashed |
Ghost line pattern: dashed, solid, or dotted. |
line_width |
null |
Ghost line thickness in pixels. Empty = same as the main line. |
show_fill |
false |
Draw the fill area under the ghost line. (new in v3.27) Also available as a Fill toggle on each editor row. |
show_average |
false |
(new in v3.27) Draw a dashed horizontal line at this ghost's average value — the mean of the compared period, in the ghost color. Handy for comparing period averages at a glance. Also available as a Show Average toggle on each editor row. |
show_points |
false |
Draw dots at the ghost's data points. |
show_in_legend |
null |
Show the ghost as its own legend entry. Empty = inherit the main entity's show_in_legend; an explicit false also hides the ghost from the simple legend. |
show_in_compact_legend |
null |
(v4.07) List the ghost in the compact legend. Empty = inherit the main entity's show_in_compact_legend (a templated main value is followed too); an explicit false leaves only the ghost out of the compact legend, an explicit true lists it even when the main entity is left out. |
show_delta |
true |
Show a Δ% next to the main value in the tooltip — green for a positive delta, red for a negative one. |
In the tooltip, each comparison row is preceded by a small line showing that ghost value's actual date and time (hover 15 Jul, 14:00 and the previous-period row is headed by 14 Jul, 14:00 for yesterday), so it is always clear which moment is being compared.
Sequential layout (new in v4.02)
layout: sequential turns the overlay into a timeline: the X axis doubles backward and the previous period is drawn where it actually happened, directly before the live window — past on the left (dashed), present on the right (solid), meeting in the middle.
entities:
  - entity: sensor.temperature
    compare:
      period: previous_period
      layout: sequential
Notes:
- Works with
period: previous_periodon line/bar (timeline) charts; other periods and chart modes keep the overlay drawing. - The tooltip shows each half's real date and time, and
show_deltadoes not apply (the two halves never share an X position). - Brush zoom works across the whole extended axis — you can zoom into the past half, the seam, or the live half, and the Y axis follows the visible data as usual.
Multiple comparisons (list form) (new in v3.26)
compare also accepts a list of comparison objects — one ghost series per entry. Each entry takes the full sub-option set above plus periods_back, which sets how many periods back that ghost reaches:
type: custom:statistics-graph-chart-card
card_header: Power — vs the last two periods
hours_to_show: 24
entities:
  - entity: sensor.power_consumption
    compare:
      - periods_back: 1        # previous period
      - periods_back: 2        # two periods ago
      - periods_back: 3
        line_style: dotted
        color: "#9b59b6"
- Follows the date picker. With the picker on Week, the entries above show the last three weeks; switch to Year and the same config shows the last three years — calendar-aligned in Month/Year modes, leap years handled.
- Each ghost is distinct. Later entries fade progressively by default (opacity
0.45→0.30→0.20…), and legend entries beyond the first read "Name (previous period ×2)", "… ×3", and so on. - Per-ghost tooltip. Every ghost row is headed by its own date sub-header, and with multiple comparisons each ghost row carries its own Δ% against the current value. With a single comparison the tooltip looks exactly as in v3.25 — one date sub-header and the Δ% next to the main value.
- Every entry still takes the full style set (
period,color,opacity,line_style,line_width,show_fill,show_average,show_points,show_in_legend,show_in_compact_legend,show_delta,hide_on_load), and hiding the main series from the legend hides all of its ghosts. - Existing single string/object
compareconfigs are untouched — the list form is purely additive.
Behavior
- The ghost is drawn faded and dashed under the main series and is named "<main name> (previous period)" — the suffix follows the dashboard language.
previous_periodshifts by the current window length. In the date picker's Month / Year modes the shift is calendar-aware: July compares against June, wall-clock aligned, and month-end dates are clamped (Mar 31 → Feb 28/29).yesterday,last_weekand the picker's Day / Week modes shift by whole days, wall-clock anchored at the window start (23 or 25 hours across a daylight-saving change); a number of hours stays exact.- A main entity with its own
offsetcompares against the previous period of its shifted window. - Clicking the entity in the legend or its state row toggles the main series and its ghosts together.
- (improved in v3.28) Under
stacked: true, ghosts stack with each other — the previous period appears as its own faded stacked column next to the current one (one ghost stack per comparison entry, honoringstack_groupand the main entity's ownstackedoverride (v4.07)). Ghosts never stack onto the current period and stay excluded from the tooltip's grand Total. - (new in v3.28) With stacked comparisons the tooltip also shows the previous period's stack total — e.g. "Aktuell Total (previous period)", fully translated — and the current stack's Total row carries a Δ% against it.
- Ghost values go through exactly the same aggregation pipeline as the main entity (
aggregate_func,points_per_hour,group_by, transforms) — the comparison is truly like-for-like. - Timeline and State Timeline charts (State Timeline since v4.02). Ignored for
candlestick,fixed_value, anddata_attributeentities, and in sparkline mode.
Editor
Per-entity → Graph tab → Period Comparison section (shown in Timeline and State Timeline modes). Redesigned as a list in v3.26:
- The section starts empty with an Add Comparison button; each click adds one comparison row and steps the default Periods Back automatically (1, 2, 3 …).
- Each row holds a period select (labels now read Previous Period / Day Before / Week Before / Month Before / Year Before — only the labels changed, the YAML values are still
previous_period,yesterday,last_week,last_month,last_year), a Periods Back input, line style, color, opacity, a Layout dropdown (Overlay | Sequential — enabled while the period is Previous Period, v4.02), a Show Δ% in tooltip toggle, and a delete button. - Legacy string/object
compareconfigs load into the list unchanged, and a one-row list commits back to the legacy short form — your YAML stays as compact as before.
🔮 Forecast Horizon
Some sensors expose a forecast value — their current state represents what is predicted for N hours in the future, not what is happening right now. Typical examples:
sensor.solcast_pv_forecast_leistung_in_1_stunde— PV power expected in 1 hour- A template sensor whose state is "temperature in 3 hours"
- A weather forecast exposed as a numeric future-hour prediction
Plotting these directly is misleading: the line shows each prediction at the time it was recorded, not at the time it is predicting. forecast_horizon: N fixes this by shifting each recorded data point forward by N hours on the X-axis so every point lands at the moment it is forecasting.
type: custom:statistics-graph-chart-card
graph_start_hour: now
show_full_period: true
entities:
  - entity: sensor.solcast_pv_forecast_leistung_in_1_stunde
    name: "Forecast +1h"
    forecast_horizon: 1
The result: a line that extends 1 hour into the future past the "now" marker, representing the forecast for each upcoming moment. The X-axis end is automatically extended by the largest forecast_horizon across all entities so shifted points stay visible.
Matching the horizon to the sensor
The forecast_horizon value should match the actual prediction horizon the sensor represents:
| Sensor | forecast_horizon |
|---|---|
solcast_pv_forecast_leistung_in_1_stunde |
1 |
solcast_pv_forecast_leistung_in_8_stunden |
8 |
| Custom "temperature in 30 minutes" | 0.5 |
Setting a value that doesn't match the sensor's real horizon will still shift the line — but the displayed time no longer corresponds to what the sensor is actually predicting.
Negative horizon — overlay tomorrow's forecast onto today
Some forecast integrations (Solcast PV, EPEX spot prices, weather APIs) expose future data through entity attributes — a single sensor whose attributes contain an array of timestamped points covering the next 24–48 hours. Combined with data_attribute, you can plot this future data directly. But what if you want to see tomorrow's forecast on today's chart timeline for an at-a-glance comparison?
A negative forecast_horizon shifts each point backward in time. Setting -24 moves tomorrow's points 24 hours earlier so they appear at today's clock positions:
type: custom:statistics-graph-chart-card
show_legend: true
entities:
  - entity: sensor.solcast_pv_forecast_tomorrow
    data_attribute: detailedHourly
    data_time_field: period_start
    data_value_field: pv_estimate
    name: "Tomorrow's forecast (shown today)"
    forecast_horizon: -24
The X-axis stays anchored to today — only the data slides into view. Combine with the live PV sensor (no horizon) on the same chart to see today's reality next to tomorrow's prediction, both aligned to the same hours.
Combining with offset
forecast_horizon and offset are orthogonal:
offsetshifts the fetch window backward (for past-period overlay comparison)forecast_horizonshifts the display forward (positive) or backward (negative)
Both can be used on the same entity. Example: overlay yesterday's 1-hour forecast sensor onto today's timeline, shifted 1h forward:
entities:
  - entity: sensor.solcast_pv_forecast_leistung_in_1_stunde
    offset: 24            # fetch yesterday's recordings
    forecast_horizon: 1   # show them shifted 1h forward
    name: "Yesterday's +1h forecast"
Editor
Entity → Advanced tab → Forecast Horizon (in hours, supports decimals — including negative values).
Notes
- Leave empty (or
0) to disable — the sensor plots at its recording time as before - The fetch window is extended backward by the largest horizon so past recordings can be retrieved and shifted forward into the visible future range
- Works with live state updates — new recordings appear on the chart at recording time + horizon
- Multiple entities can use different horizons — the X-axis is extended to cover the largest one
📊 Data Sources & Math — On-Card Pickers (Points/Hour & Group By) | Raw Grouping (group_by: raw) | Value Transform | Cost View (price_entity) | Two-Entity Math (ref_entity) | Range Band | Moving Averages | Break on Gaps | Attribute Data Source | Energy Dashboard Solar Forecast | External Statistics
🎚️ On-Card Pickers (Points/Hour & Group By)
Change the data resolution and the bucketing strategy directly on the card — no editor round-trip.
Setup
type: custom:statistics-graph-chart-card
show_pph_picker: true
show_group_by_picker: true
group_by_picker_position: right
entities:
  - entity: sensor.power
Behavior
- Each dropdown starts on Auto (…), showing your configured value; picking anything else overrides it for this card only.
- Selections persist across reloads and take priority over Auto Scale while active.
- The Group By picker offers Interval, Hour, 2H / 3H / 4H / 6H / 12H, Date, Week, Month and Year.
Group Sync
Each picker has its own, fully independent sync group — same mechanism as date_picker_group:
# Controller card
show_pph_picker: true
pph_picker_group: page

# Receiver cards — no picker shown, still follow
pph_picker_group: page
pph_picker_group and group_by_picker_group don't interact: a card can follow one page-wide resolution group and a different bucketing group (or none).
Editor
General Settings → Overlay tab → Card Overlays → Points/Hour Picker and Group By Picker rows. The Group fields are always editable, even while the toggles are off.
🧲 Raw Grouping (group_by: raw)
group_by: raw turns bucketing off entirely: every recorded sample is drawn at its exact timestamp, with no averaging and no resampling — points_per_hour is ignored.
type: custom:statistics-graph-chart-card
group_by: raw
hours_to_show: 24
entities:
  - entity: binary_sensor.front_door
    name: Front Door
    graph_type: step
    state_map:
      - value: "off"
      - value: "on"
When to use it
- Step charts of binary / state sensors — a door, pump, or heating-demand signal changes state at precise moments; bucketing smears those edges. Raw mode preserves every transition exactly where it happened.
- Sensors that record few, meaningful samples where a value interpolated into buckets would be misleading.
Editor
The Group By dropdown offers "Raw (no grouping)" whenever at least one entity uses graph_type: step — and always when the config already contains group_by: raw.
🔀 Value Transform
Apply a JavaScript expression to every data point before graphing. The transform has access to the current value and series-level statistics, making it possible to normalize, compare, and reshape data in ways that weren't possible before.
Available variables
| Variable | Description |
|---|---|
x |
Current data point value |
first |
First value in the visible time window |
last |
Last value in the visible time window |
min |
Minimum value across the series |
max |
Maximum value across the series |
avg |
Average value across the series |
index |
Position of the current point (0, 1, 2…) |
All variables are computed after value_factor is applied, before the transform runs.
Normalize to zero
Display cumulative meter readings as relative consumption starting from zero:
entities:
  - entity: sensor.gas_meter
    value_transform: "return x - first;"
A gas meter reading 2200, 2210, 2225, 2240 becomes 0, 10, 25, 40.
Splitting a sensor into export/import
A common use case: a single power sensor reports positive values for export and negative values for import. Use two entity entries with different transforms to separate them:
entities:
  - entity: sensor.grid_power
    name: "Grid Export"
    color: "#2ecc71"
    value_transform: "return x > 0 ? x : 0"

  - entity: sensor.grid_power
    name: "Grid Import"
    color: "#e74c3c"
    value_transform: "return x < 0 ? -x : 0"
Common expressions
| Expression | What it does |
|---|---|
return x - first |
Normalize to zero (cumulative → relative) |
return ((x - first) / first) * 100 |
Percentage change from start |
return (x - min) / (max - min) |
Min-max normalization (scale to 0–1) |
return x - avg |
Deviation from average |
return x > 0 ? x : 0 |
Keep only positive values (zero out negatives) |
return x < 0 ? -x : 0 |
Keep only negative values, flip to positive |
return Math.abs(x) |
Absolute value |
return x * 1.1 |
Add 10% markup |
return x - 273.15 |
Convert Kelvin to Celsius |
return (x * 9/5) + 32 |
Convert Celsius to Fahrenheit |
return Math.round(x / 100) * 100 |
Round to nearest hundred |
return x > 8 ? x : null |
Show the series only while it is above 8 |
return t <= now ? null : x |
Hide a forecast's past, keep only what is still ahead |
return t > now ? null : x |
The other half: actual data up to now, nothing after |
return (hour >= 17 && hour < 21) ? 8 : 12 |
A cap line that steps with the time of day |
return weekday <= 5 ? x : null |
Weekdays only |
Time variables (new in v4.04)
Besides the value variables, the expression also receives four read-only time variables:
| Variable | Meaning |
|---|---|
t |
This point's timestamp, in milliseconds |
now |
The current time, in milliseconds |
hour |
Local hour of this point as a decimal, 0–23.99 (so 17:30 is 17.5), in the card's display timezone |
weekday |
ISO weekday of this point: 1 = Monday … 7 = Sunday |
They make a per-entity time filter possible without a template entity — pair them with return … : null to draw a series only over the part of the X axis you want.
If your expression declares its own
t,now,hourorweekday(withvar,letorconst), the card compiles it without the time variables so your own names keep working exactly as before.
Editor
Entity → Advanced tab → Advanced Calculations → Value Transform — a monospace text input field. Enter the expression directly (e.g., return x - first).
Notes
- The expression must be valid JavaScript and include a
returnstatement - Returning
nullleaves a visible gap at that point: the line breaks there rather than joining across the hole, and the tooltip, moving averages and range band all respect it. An expression that throws or returns a non-number does the same (changed in v4.04 — these points used to be removed, which let the line connect straight over them) - Applied to every data point individually — both historical and live values
- Works with all chart modes, aggregation functions, and other entity options
- Context variables (
first,min, etc.) are only available when processing a full data series — in the state row live value display, all context variables equalx
💶 Cost View (price_entity)
Multiply a series by the value of another entity over time — turn a kWh consumption chart into a money chart using a dynamic price sensor (Nordpool, EPEX, Tibber, a utility tariff helper). Per-entity price_entity needs no template sensor and no duplicate entity: the card bills the consumption itself.
type: custom:statistics-graph-chart-card
card_header: Energy Cost
hours_to_show: 168
group_by: date
entities:
  - entity: sensor.energy_meter
    name: Cost
    graph_type: bar
    aggregate_func: change
    price_entity: sensor.electricity_price
    unit: "€"
    decimals: 2
How it works
- The price is read as a step function from the price entity's own history — each price is valid from the moment it was recorded until the next change. Long windows automatically use long-term statistics (hourly mean) for the price series.
- The multiplication happens per consumption slice, before bucketing — every slice of consumption is billed at the price that was active at that moment, so each bucket is the exact sum Σ(valueᵢ × priceᵢ).
- Designed for
aggregate_func: changeon cumulative energy counters — setunitto your currency so the state row, tooltip, and axis all read as money. price_attributereads an attribute of the price entity instead of its state — dot notation is supported for nested paths (e.g.raw_today.0.value).- A state change of the tariff entity auto-refreshes the card, so a price update redraws the cost immediately.
- Period Comparison ghosts are billed at their own period's prices — last week's ghost uses last week's tariffs, keeping the comparison honest.
- Not applied to
fixed_valueordata_attributeentities.
Why a step function beats average × total
Multiplying the period's total consumption by the average price is only correct when consumption is flat. With time-of-use tariffs the expensive hours tend to be exactly the high-consumption hours, so average × total systematically misstates the bill. Billing every slice at its own momentary price reproduces what the utility actually charges.
Editor
Entity → Advanced tab → Advanced Calculations → Price Entity and Price Attribute inputs.
➖ Two-Entity Math (ref_entity)
Plot the combination of two entities — most often their difference — without creating a template sensor. ref_entity names the second entity and ref_op says how to combine them:
type: custom:statistics-graph-chart-card
hours_to_show: 24
entities:
  # indoor − outdoor, the classic delta. ref_op defaults to subtract,
  # and with no name: the series is labelled "Indoor − Outdoor" automatically.
  - entity: sensor.indoor_temperature
    ref_entity: sensor.outdoor_temperature

  - entity: sensor.solar_production
    name: Net export
    ref_entity: sensor.house_consumption
    ref_op: subtract

  # the reference can come from an attribute (e.g. a weather entity)
  - entity: sensor.pool_temperature
    ref_entity: weather.home
    ref_attribute: temperature
    ref_op: divide
How it works
The reference entity's own history is fetched alongside your data and read as a step function: every sample of the main entity is combined with the reference value that was valid at that moment. The math runs before bucketing, so avg over a bucket is the average of the difference, and min/max are the smallest/largest instantaneous gap — not min(A) − min(B). With a delta aggregation (change, diff, sum, delta), subtract / add / reverse_subtract (v4.03) and divide / reverse_divide by a meter (v4.07) combine the two entities per bucket instead — see below.
Rules worth knowing
Reversed operators.
reverse_subtractgivesB − Aandreverse_dividegivesB ÷ A. This is not the same as swapping the two entity ids: the main entity supplies the timeline the reference is sampled onto, plus the unit, aggregation, data source, colour and offset. Keep the better-sampled sensor asentity:and flip the arithmetic instead (e.g.COP = heat ÷ powerwhilepowerstays the main series).subtract/add/reverse_subtractcombine levels — or, with a delta aggregation, whole buckets. Withavg,min,max,last,firstormedianthe reference is sampled at each of the main entity's readings. Withchange,diff,sumordelta(v4.03) the two entities are first aggregated the same way, then combined per bucket — the way to add two daily-production meters into one monthly total:entities: - entity: sensor.goodwe_today_s_pv_generation name: Total production ref_entity: sensor.solaredge_production_today ref_op: add aggregate_func: sum graph_type: bar group_by: monthA bucket in which one side has no data counts that side as 0, so a month with only one inverter reporting still shows the other's production;
price_entityis applied to both sides. The bucket-wise path needs anentity:series in a bucketed chart — astatistic_id-only or attribute series still renders empty with a console warning.multiply, anddivideby a level (a constant, aninput_number, a price, ameasurementsensor), are allowed with every aggregation — that is exactly whatprice_entitydoes.divide/reverse_divideby a meter — total ÷ total per bucket. (v4.07) When the reference is a meter — itsstate_classistotalortotal_increasing(energy, gas, water) — and the aggregation ischange,diff,sumordelta, both entities are first aggregated the same way and then divided per bucket. A heat pump's daily COP is the day's heat output ÷ the day's electricity:entities: - entity: sensor.heat_pump_energy_output_heating name: COP ref_entity: sensor.heat_pump_electricity_used_heating ref_op: divide aggregate_func: change group_by: date unit: COPA bucket where the divisor is 0 or has no data stays empty instead of showing an infinite ratio, a bucket where only the divisor has data shows 0, and a reference with no data at all leaves the series empty. By default the state row shows the newest bucket, so with
group_by: dateit reads today's ratio so far. Pie, radial bar, polar area, radar, ranking and waterfall charts, the heatmap and calendar cells and the state row'spctshare divide the totals of the whole window or cell the same way, so a week of daily COPs reads the week's COP instead of the sum of seven ratios; a bucket that stays empty because its divisor is 0 counts on neither side.price_entitymultiplies the main entity only (pricing both sides would cancel it out) — put the priced meter asentity:and usedivide: electricity with a tariff ÷ heat is the cost of one kWh of heat. The bucket-wise limits above apply here too. A reference that is a level — a constant, aninput_number, ameasurementsensor or anyref_attribute— keeps the sample-by-sample rule (energy ÷ floor area), andmultiplyalways combines sample by sample.Carry-forward, but nothing invented. The reference is held until it next changes — the same rule Home Assistant itself uses for a state, and the same one
price_entityfollows. That is what makes a step-shaped reference (a setpoint, aninput_number, a mode) work. What the card will not do is invent a value before the reference's first sample: that stretch is a gap. Since the card carries values across gaps by default, a reference that dies mid-window shows as a flat line — addbreak_on_null: trueif you would rather the line break there.Both operands should share a unit for
subtract/add; the result keeps the main entity's unit. Formultiply/dividesetunityourself.value_factorandinvertapply to the main entity only, before the combination.The state row and the trend arrow follow the combined series, not the bare main entity.
Not available on
data_attribute(forecast-array) orfixed_valuerows.Only one reference and one operator per entity. For multi-operand formulas (
A − B − C) you still need a template sensor — a general cross-entity expression is planned for a later release.
Note:
data_value_expression+data_varsdo not do this. They only apply to an attribute-array data source, anddata_varsresolves each name to the referenced entity's current state — a constant, not a series. Useref_entityfor math against another entity over time.
Editor: Entity → Advanced → Reference Entity, Operation, Reference Attribute.
📏 Range Band
The Range Band feature draws a shaded min/max area behind each line entity, showing how much the value fluctuated within each aggregation bucket.
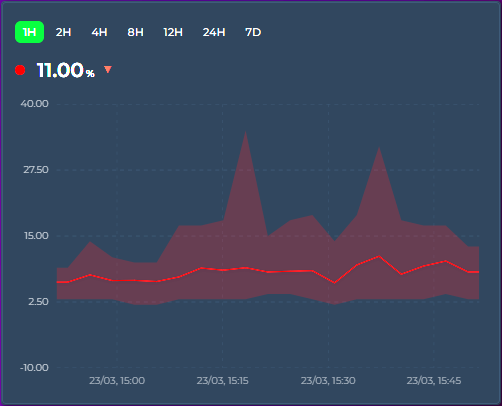
How it works
When points_per_hour aggregates multiple raw data points into a single graph point, the displayed value is typically the average (or whichever aggregate_func you've chosen). The range band shows the full min → max spread of raw values that were combined — so you can see both the trend and the volatility.
entities:
  - entity: sensor.outdoor_temperature
    show_range_band: true
    color: "#ff4757"
  - entity: sensor.indoor_temperature
    show_range_band: false
    color: "#378ADD"
Use cases
- Temperature: narrow band = stable climate, wide band = fluctuating (e.g. HVAC cycling)
- Energy: see consumption spikes vs steady draw within each time bucket
- Sensor noise: distinguish real signal changes from noisy sensor readings
Editor
Entity → Graph tab → Line section → Range Band toggle (next to Data Points). Timeline mode only.
Tooltip
When hovering, an additional row shows the range: Range: 21.2 → 22.8 °C.
〽️ Moving Averages
Overlay one or more simple moving-average (SMA) lines on top of any entity — a smoothed trend line that averages the last N buckets. Add as many as you like, each with its own period, color, and width. Perfect for separating signal from noise on busy sensors (CPU load, power, prices) or for classic short/long crossover views (e.g. MA7 vs MA26).
entities:
  - entity: sensor.keenetic_router_cpu_load
    graph_type: bar
    moving_averages:
      - period: 7          # short MA — averages the last 7 buckets
        color: "#ffffff"
        show_label: true   # draw a small "MA7" tag on the line
      - period: 26         # long MA — averages the last 26 buckets
        color: "#f1c40f"
        width: 2           # optional line thickness (px)
        show_label: true   # draw "MA26"
The period is in buckets, not hours
Each line's period is a number of buckets, and the bucket size comes from the chart's timeframe — points_per_hour in interval mode, or group_by (hour / date / week / month / year). So with group_by: hour, period: 26 averages the last 26 hourly buckets (MA26). With points_per_hour: 12 (one bucket every 5 minutes), period: 26 covers the last ~130 minutes.
Automatic look-back — long MAs draw on short windows
A 26-bucket average normally needs 26 buckets of history before it can produce its first value. If your visible window only holds a handful of buckets (e.g. hours_to_show: 24 with group_by: hour → 24 buckets), a plain MA26 would never have enough data to draw.
This card solves that by extending the history fetch backward automatically by the amount the longest moving average needs — independent of the visible window. The MA is computed over that extended range and then trimmed to the window, so MA26 draws fully across a 24-hour view without you having to widen hours_to_show or scroll. The visible chart, axis, statistics, and extrema are unchanged — only the moving-average lines use the extra look-back.
The look-back applies to entities whose data comes from History or long-term statistics. Synthetic sources (
fixed_value,data_attribute) average only what's in the window.
Candlesticks
When the entity is drawn as candlesticks, each moving average uses the close of every candle (otherwise it averages the bucket value), so an MA over candles behaves like the moving averages on a trading chart.
Line labels
Turn on show_label for any line to draw a small MA7, MA26 … tag right at the end of that line, so you can tell several averages apart at a glance:
    moving_averages:
      - period: 7
        color: "#ffffff"
        show_label: true
By default the label text is the period prefixed with MA (MA7, MA26, …). (v4.07) Give the item a name to print your own text instead — so a weekly average on hourly buckets reads Weekly trend rather than MA168:
    moving_averages:
      - period: 168
        show_label: true
        name: "Weekly trend"
name only changes the wording: show_label still decides whether a label is drawn, so a name without show_label: true draws nothing, a blank name falls back to MA<period>, and a short name reads best. Whatever the text, the label is drawn at the end of the line and clamped inside the chart, so it never spills outside the plot, with a subtle background halo so it stays readable over the line and the data. It's off by default — flip the Label switch next to the color picker, or set show_label: true in YAML.
Notes
- Each moving average is plotted against the entity's own Y axis, so it lines up with the bars / line / candles it summarizes.
- Lines render in their configured
color; leavecolorempty to fall back to a default.widthdefaults to a thin line. - Timeline mode only.
Editor
Per-entity → Graph tab → Moving Averages (just below the Graph card). Click Add Moving Average to add a line, set its Period and Color, flip Label to print an MA7-style tag on the line, type a Name (v4.07) to replace that tag with your own text (the field's placeholder shows the automatic MA<period> text; leave it empty to keep it), and use the ✕ button to remove one.
🕳️ Break on Gaps
When a sensor goes unavailable or unknown, the card normally keeps the line continuous by carrying the last known value forward across the gap. That's great for short blips (brief WiFi drops, bucket-level reporting irregularity) but can hide genuine multi-hour outages behind a flat line. The per-entity break_on_null option lets you opt in to a visible break instead.
entities:
  - entity: sensor.steady_sensor
    # default — continuous line, last known value carried across any gap

  - entity: sensor.flakey_sensor
    break_on_null: true
    # short blips still connect, but longer outages appear as gaps

  - entity: sensor.very_specific
    break_on_null: true
    carry_forward_ms: 900000   # advanced — 15 min threshold
Behavior
| Setting | Effect |
|---|---|
break_on_null: false (default) |
Carry-forward runs indefinitely up to "now" — no null-induced gaps before it, ever. Buckets that fall after "now" are never filled, even when the window reaches into the future (show_full_period, graph_start: tomorrow). The long-standing default behavior. |
break_on_null: true |
Short sample gaps (bucket-level blips, irregular reporting, brief drops) stay connected. Longer outages — default threshold min(3 × bucket width, 30 minutes) — appear as visible breaks in the line. |
carry_forward_ms: N (YAML, advanced) |
Override the threshold with an explicit value in milliseconds. Applies regardless of the break_on_null setting. |
Why not just "break at every null"?
A pure "zero carry-forward" mode turns out to be too aggressive on real-world sensors. When bucket width is finer than the sensor's natural sample interval (a common setup at high points_per_hour), dozens of buckets between two real samples end up empty even though the sensor is perfectly healthy. The time-based threshold distinguishes "I'm waiting for the next sample" from "the device has been gone for a while" — which is the distinction users actually want to see.
Editor
Entity → Graph tab → Graph section → Break on Gaps toggle (next to Show Average and Data Labels). Shown in every chart mode — carry-forward affects the bucketed data, so it matters wherever those buckets are drawn.
Notes
- Changed in v3.25 — an empty bucket now carries the previous bucket's last recorded sample (its exit state) forward, not the previous bucket's aggregated value. With
aggregate_func: firstormax, a momentary spike no longer smears across the quiet buckets that follow it; withavg, the carried value is the last actual reading instead of the previous bucket's average. - Does not affect
value_transformscripts that returnnull— those buckets are already null before carry-forward logic runs, so they stay a visible gap either way. - Works independently per entity, so you can mix well-behaved sensors (continuous line) with flakey ones (visible gaps) on the same card.
📡 Attribute Data Source
Read chart data directly from an entity attribute instead of history. The attribute must contain an array of objects with time and value fields. The X-axis automatically extends into the future when data contains future timestamps.
Ideal for energy spot prices, weather forecasts, and solar production predictions. No history or statistics API calls are made for these entities.
entities:
  - entity: sensor.epex_spot_price
    data_attribute: data
    data_time_field: start_time
    data_value_field: price_per_kwh
    value_factor: 2
    graph_type: step
    name: "Electricity Price"
Common configurations:
| Integration | data_attribute |
data_time_field |
data_value_field |
|---|---|---|---|
| EPEX Spot | data |
start_time |
price_per_kwh |
| Nordpool | raw_today |
start |
value |
| Tibber | price_info |
startsAt |
total |
| Solcast PV Solar (HACS) | detailedForecast (on the per-day forecast_today / forecast_tomorrow … sensors) |
period_start |
pv_estimate |
Not every forecast integration exposes an array. Core Forecast.Solar has no attributes at all — its forecast reaches only the Energy dashboard (
energy/solar_forecast). Open-Meteo Solar Forecast (HACS) exposes per-daywh_perioddictionaries (energy_production_today,_tomorrow,_d2…_d7), which are not arrays; merge them into one list with a template sensor ([{ start, wh }, …]) and pointdata_attributeat that. Or skip all of that:solar_forecast: trueon a row draws the Energy dashboard's solar forecast directly — see Energy Dashboard Solar Forecast below.
Compatible with existing value_factor, value_transform, aggregate_func, and group_by. The calendar group_by modes (hour, date, week, month, year) regroup the array when the requested cell is coarser than its native spacing — 96 quarter-hourly prices under group_by: hour become 24 hourly values combined with aggregate_func — and pass it through untouched otherwise, so an already-hourly array stays as published. interval (the default) and raw never regroup; the fixed 2h–12h modes are not supported for attribute arrays. points_per_hour does not apply — it controls fetching, and an attribute source fetches nothing. The time and value field names support nested paths via dot notation (e.g. forecast.0.temperature or integrated.0.value).
Computed Values
Sometimes the value you want isn't a single field — you need to combine several fields from each element, fold in other entities (fees, tax rates, tariffs), and apply a formula. Set data_value_expression instead of data_value_field: a small arithmetic expression evaluated for every array element, with the element's own fields in scope plus any names you map in data_vars.
entities:
  - entity: sensor.tibber_hourly_cost
    name: Electricity
    graph_type: bar
    data_attribute: nodes
    data_time_field: from
    data_time_unit: iso
    data_value_expression: "(unitPrice - unitPriceVAT) * 100 * consumption * (1 + mwst)"
    data_vars:
      mwst: input_number.vat_rate
data_vars maps a name to an entity ID; each resolves to that entity's numeric state and is re-evaluated live when it changes. Inside the expression you can use:
| In scope | Examples |
|---|---|
| Element fields | unitPrice, consumption, … (any field of the array item) |
data_vars names |
mwst, base, … |
| Operators | + - * / % and parentheses ( ) |
| Functions | min, max, abs, round, floor, ceil, sqrt, pow, coalesce (v4.08) |
This is not JavaScript — there are no other variables, no property access, and no calls beyond those functions, so it can't run arbitrary code. If the expression is empty or fails to parse, the entity falls back to data_value_field.
Elements without a value (v4.08) — an array element that lacks the value field (or holds text that isn't a number) has no reading, so it draws no point: a bar is simply missing, and a line, area or step joins its neighbours — with line_shape: hv the last value is held until the next element. When a missing field means zero — a solar or charging plan that only lists the quarters with energy, for example — wrap the field in coalesce, which returns its first argument that is a number:
    data_attribute: plan
    data_time_field: tijd
    data_value_expression: "coalesce(zon_laden_kwh, 0)"
coalesce takes any number of arguments, so coalesce(override, price, 0) falls through a chain of fields, and it treats a division by zero or a data_vars entity that is unavailable as empty too. When every argument is empty the element is skipped, as before.
Because each element is evaluated independently, two entities reading the same array with different expressions stack cleanly — e.g. splitting an hourly energy cost into a consumption layer and a fixed-fee layer:
type: custom:statistics-graph-chart-card
stacked: true
group_by: hour
entities:
  - entity: sensor.tibber_hourly_cost
    name: Energy
    graph_type: bar
    data_attribute: nodes
    data_time_field: from
    data_time_unit: iso
    data_value_expression: "(unitPrice - unitPriceVAT) * 100 * consumption * (1 + mwst)"
    data_vars: { mwst: input_number.vat_rate }
  - entity: sensor.tibber_hourly_cost
    name: Fees
    graph_type: bar
    data_attribute: nodes
    data_time_field: from
    data_time_unit: iso
    data_value_expression: "(base/30/24 + grid/24 + meter/24) * (1 + mwst) * 100"
    data_vars:
      base: input_number.base_price_month
      grid: input_number.grid_fee_day
      meter: input_number.meter_fee_day
      mwst: input_number.vat_rate
Editor: Per-entity → Advanced tab → Attribute Data Source → Value Expression field, and Data Vars (one
name: entity_idper line).
Time Unit
By default, the time field is parsed as an ISO date string. Set data_time_unit to interpret it differently — perfect for sensors that expose monthly summaries, hourly profiles, day-of-year datasets, or Unix timestamps without generating artificial timestamps.
| Unit | Range | Behavior |
|---|---|---|
iso (default) |
string / epoch ms | new Date(t) — existing behavior |
epoch_seconds |
number | Unix timestamp in seconds |
epoch_ms |
number | Unix timestamp in milliseconds |
month_of_year |
1..12 | First day of that month in data_time_year (default: current year) |
day_of_month |
1..31 | That day of the visible window's month, in data_time_year (default: the window's year). A value past the month's end is clamped to its last day |
day_of_year |
1..366 | That day in data_time_year |
week_of_year |
1..53 | Monday of that ISO week in data_time_year |
hour_of_day |
0..23 | That hour of today |
Example — a sensor exposing monthly yield expectations as [{Month: 1, Expectation: 320}, {Month: 2, Expectation: 489}, ...]:
type: custom:statistics-graph-chart-card
group_by: month
graph_start: year
hours_to_show: 8760
entities:
  - entity: sensor.sma_month_yield_expectation
    data_attribute: Expectation
    data_time_field: Month            # 1..12
    data_value_field: Expectation
    data_time_unit: month_of_year     # interpret as Jan..Dec
    graph_type: bar
    aggregate_func: max
Renders 12 bars labelled Jan–Dec on the X-axis. Tooltip shows the actual month + value. All other features (date picker, group_by, fill, theming) work normally because the parser converts the numeric category into a real Date internally.
Editor: Per-entity → Advanced tab → Attribute Data Source → Time Unit dropdown and Reference Year input
☀️ Energy Dashboard Solar Forecast
Draw the solar forecast your Energy dashboard already shows — Forecast.Solar, Solcast, Open-Meteo Solar Forecast or any other integration that feeds the dashboard — as a row of this card. No entity, template sensor or attribute array is needed: the card reads the same forecast the Energy dashboard reads (energy/solar_forecast).
entities:
  - solar_forecast: true          # no entity / statistic_id needed
    name: "PV forecast"
    graph_type: line
    line_style: dashed
- What you get: hourly points in kWh (the forecast is energy per hour), as far back as the integration returns them (Open-Meteo keeps about three months of past hours, Forecast.Solar starts today) and as far ahead as it forecasts.
aggregate_funcdefaults tosumandunittokWh; override either like on any row (unit: W+value_factor: 3plots the hourly mean power — an hourly Wh value is numerically the mean W of that hour). - Sources: by default every solar source of the Energy dashboard that has a forecast configured is summed per hour, the way the dashboard draws it.
solar_forecast_source: sensor.pv_a_energy(the source's energy-production statistic) draws one source only. The row is named after the source (Energy dashboard name or friendly name + " forecast"), or Solar forecast;name:overrides as usual. - Daily totals:
group_by: date(orweek/month) sums the hours into calendar cells — the right view for a week or month card. - Window: the row follows the card window like an attribute source. A rolling window (
hours_to_show) is stretched to the last forecast hour — about 16 days ahead with Open-Meteo.graph_start: day|week|monthends at now unless you addshow_full_period: true, which shows the whole period including the hours ahead. Withenergy_date_syncor the built-in date picker the current period also ends at now and is then stretched to the last forecast hour; addshow_full_period: trueto stay on the selected period (today, this week, this month) with the forecast clipped to it. Past periods show the past hours the integration returns.auto_scale_pointssteps aside for a solar forecast row, exactly as it does fordata_attribute. - State row: shows the forecast of the current hour (today's total under
group_by: date);primary_state_as: sumshows the total of the window,lastthe last forecast hour. - Nothing to draw? If the Energy dashboard is not configured, no solar source has a forecast, or the forecast integration is not loaded, the row stays empty, one warning is written to the browser console and the detail legend notes it. The forecast refreshes with the card's periodic poll (every 5 minutes, 15 with a calendar
group_by) or withupdate_interval.
Day view — hourly forecast next to the real production:
type: custom:statistics-graph-chart-card
graph_start: day
show_full_period: true
show_legend: true
entities:
  - entity: sensor.pv_energy_today
    aggregate_func: change
    graph_type: bar
    unit: kWh
  - solar_forecast: true
    name: Forecast
    graph_type: line
    line_style: dashed
Week view — one bar per day, one source only:
type: custom:statistics-graph-chart-card
graph_start: week
show_full_period: true
group_by: date
entities:
  - solar_forecast: true
    solar_forecast_source: sensor.pv_a_energy
    graph_type: bar
Following the Energy dashboard's own date picker:
type: custom:statistics-graph-chart-card
energy_date_sync: true
show_full_period: true     # stay on the selected period; without it the window ends at now and is stretched to the last forecast hour
group_by: date
entities:
  - solar_forecast: true
Past days: the hours before now are whatever the forecast integration returns today for those hours — not a copy of the forecast that was shown on that day. Use them for context, not for accuracy tracking.
Editor: Per-entity → Advanced tab → Solar Forecast (Energy Dashboard) → Solar Forecast toggle and the Forecast Source dropdown (the dashboard's solar sources that have a forecast, by name; All solar sources is the default). The Entity picker on the General tab is marked optional while the toggle is on; Aggregation shows Sum and the Unit field hints kWh.
🔌 External Statistics
Display data from imported statistics that don't have a regular entity in Home Assistant. This covers energy data from integrations like Gazpar, Linky, Tibber, and others that import directly into HA's statistics database.
Background
Some HA integrations don't create sensor.* entities. Instead, they write data directly into the statistics and statistics_meta database tables using HA's async_import_statistics() API. These statistics have IDs with a colon separator (e.g. gazpar:gazpar_consumption) and are visible on the Energy dashboard and the built-in Statistics Graph card, but not in the entity registry.
Setup
Use statistic_id instead of (or alongside) entity:
entities:
  - entity: ""
    statistic_id: "gazpar:gazpar_consumption"
    name: "Gas Consumption"
    color: "#f39c12"
    aggregate_func: sum
  - entity: ""
    statistic_id: "linky:linky_consumption"
    name: "Electricity"
    color: "#378ADD"
    aggregate_func: sum
  - entity: sensor.indoor_temperature
    name: "Temperature"
    color: "#ff4757"
You can mix external statistics with regular entities on the same card.
How it works
- The card detects external statistics by checking for a
:in thestatistic_id - Data is fetched via HA's
recorder/statistics_during_periodWebSocket API — the same API the Energy dashboard uses - Since there is no live state, the state row displays the last known value from the statistics data
- All card features work: tooltip, legend, axes, stacking, offset, zoom, color thresholds, etc.
Editor
Entity → General → Statistic ID input field (monospace, below the entity picker). Set the entity picker to empty and fill in the statistic ID.
Finding your statistic IDs
- Go to Developer Tools → Statistics in HA
- Search for the integration name (e.g. "gazpar")
- The statistic ID is shown in the list (e.g.
gazpar:gazpar_consumption)
🎨 Layout & Appearance — Sections Auto-height | Y-Axis Label Formats | Y2 Axis Visibility | Independent Y-Axis | Stacked Mode | Chart Pages | Invert Bars (Butterfly Charts) | Data Labels | Gauge Display | Sparkline Mode | Battery Icon | Compact Legend | Per-Entity Legend Stats | State Row Position
📐 Sections Auto-height
In Home Assistant's Sections view the card now reports proper grid sizing — the "does not fully support resizing" warning is gone, and you can resize it from the card's Layout tab.
By default height is a fixed pixel value (150). Set it to auto to make the chart fill the grid cell it is given instead:
type: custom:statistics-graph-chart-card
height: auto          # fill the cell; size the card from the Layout tab
entities:
  - entity: sensor.power
Behavior
- A numeric
height(e.g.300) still pins the graph to that many pixels, exactly as before. - With
height: autothe chart grows and shrinks to match the grid cell — drag the card's resize handle (or setgrid_optionsrows) in the Layout tab. Handy for lining a chart up with a neighbouring card's height. - In a Panel view (v4.03) a timeline chart (the default lines/bars/areas mode) with
height: autofills the whole view on its own — nogrid_optionsneeded — and follows the browser window in both directions, shrinking as well as growing. Other chart modes keep their natural size in a panel unless you give themgrid_optionsrows. - In a Masonry view, or inside a stack card, nothing gives the card a height to fill, so
height: autofalls back to a 200 px chart. Use a numericheightthere.
Editor
The Height field accepts a number or the word auto. Leaving it empty is treated as auto.
🕒 Y-Axis Label Formats
Render axis values as durations or with a custom template instead of plain numbers. The format follows the entity everywhere: axis ticks, tooltips, data labels, the state row and the average-line label.
Duration shorthands
y2_axis_format: h:mm    # 5400 → 1:30
duration_unit: s        # raw unit: s (default) / ms / min / h
| Format | 5400 becomes |
|---|---|
h:mm |
1:30 |
h:mm:ss |
1:30:00 |
mm:ss |
90:00 |
d h:mm |
1:30 — and 90000 becomes 1d 1:00 |
Templates
y_axis_format: "{fixed(value/1000,1)} kW"     # 2350 → 2.4 kW
y2_axis_format: "{floor(value/3600)}:{pad2(floor(value%3600/60))}"
Templates accept numbers, value, + - * / %, parentheses and the functions floor, ceil, round, abs, min, max, sqrt, pad2(x), pad(x,width), fixed(x,decimals). No JavaScript is executed — invalid formats are simply ignored and the axis falls back to plain numbers.
Editor
General Settings → Y Axis → Labels → Y Tick Format / Y2 Tick Format / Duration Unit.
👁️ Y2 Axis Visibility
The primary (left) and secondary (right) Y axis labels can be toggled independently:
show_y_axis: true       # primary — left side
show_y2_axis: false     # secondary — right side hidden
entities:
  - entity: sensor.temperature
    y_axis: primary
  - entity: sensor.humidity
    y_axis: secondary     # still plotted, just no labels on right
Useful when the secondary axis labels are distracting or when you want to maximize horizontal graph space. Both entities continue to be plotted against their respective axes — only the labels are hidden.
↕️ Independent Y-Axis
Overlay sensors with completely different units on a single graph for trend comparison. Each independent entity gets its own hidden scale based on its data's min/max range. No axis labels are shown — only the visual trend matters.
entities:
  - entity: sensor.temperature
    y_axis: primary          # Left axis, shared scale, visible labels
    color: "#ff4757"
  - entity: sensor.humidity
    y_axis: secondary        # Right axis, shared scale, visible labels
    color: "#378ADD"
  - entity: sensor.illuminance
    y_axis: independent      # Own hidden scale: 0–10000 lux
    color: "#f39c12"
  - entity: sensor.pressure
    y_axis: independent      # Own hidden scale: 980–1020 hPa
    color: "#2ecc71"
There is no limit on the number of independent entities. Each one is scaled individually. Primary and secondary entities continue to share their respective axis scales.
Editor: Per-entity → Basic tab → Y Axis dropdown → "Independent"
📊 Stacked Mode
Card-level stacked: true stacks entities on top of each other (Timeline mode only). Bar entities stack vertically. Line/area entities stack as bands. Entities on the same Y axis and graph type are stacked together. The tooltip shows a "Total" row.
stacked: true
entities:
  - entity: sensor.solar_production
    color: "#f39c12"
  - entity: sensor.grid_import
    color: "#e74c3c"
  - entity: sensor.battery_discharge
    color: "#3498db"
Mixing stacked and unstacked entities (v4.07)
The card-level toggle is only the default — each entity can override it with its own stacked. stacked: false on a stacked card takes that entity out of every stack: it is drawn exactly as on a card that is not stacked (a plain line or area, or a bar from the zero line in a slot of its own beside the stacked columns), it keeps its own Y range instead of the stack total, and its data labels sit above the bar again. The classic case is room temperatures as plain lines on the primary axis next to valve positions stacked as bars on the secondary axis:
stacked: true
show_y2_axis: true
entities:
  - entity: sensor.living_room_temperature
    stacked: false                 # plain line on Y1
  - entity: sensor.bedroom_temperature
    stacked: false
  - entity: sensor.living_room_valve
    graph_type: bar
    y_axis: secondary              # the valves stack on Y2
  - entity: sensor.bedroom_valve
    graph_type: bar
    y_axis: secondary
  - entity: sensor.bathroom_valve
    graph_type: bar
    y_axis: secondary
The inverse works too: on a card without stacked: true, the entities that set stacked: true stack with each other (grouped by stack_group, y_axis, graph_type, group_by and invert as always) while everything else stays as it is:
entities:
  - entity: sensor.living_room_temperature   # plain line
  - entity: sensor.living_room_valve
    graph_type: bar
    y_axis: secondary
    stacked: true                             # these three stack
  - entity: sensor.bedroom_valve
    graph_type: bar
    y_axis: secondary
    stacked: true
  - entity: sensor.bathroom_valve
    graph_type: bar
    y_axis: secondary
    stacked: true
An unset entity stacked follows the card, so existing cards look exactly as before. stack_group still only names the group — on its own, without the card's or the entity's stacked: true, it does nothing. Comparison ghosts inherit their main entity's setting, the tooltip's per-group totals only add up the entities that are actually stacked, and the grand Total keeps adding up every visible entity. The key accepts a {{ }} template like the card-level switch.
Stacked Groups
By default, all bar entities stack into a single column. Use stack_group to create named groups — entities within the same group stack on top of each other, while different groups sit side by side.
stacked: true
group_by: date
entities:
  - entity: sensor.solar_production
    graph_type: bar
    stack_group: energy
    color: "#2ecc71"
  - entity: sensor.grid_import
    graph_type: bar
    stack_group: energy
    color: "#e74c3c"
  - entity: sensor.cost_peak
    graph_type: bar
    stack_group: cost
    color: "#f39c12"
  - entity: sensor.cost_offpeak
    graph_type: bar
    stack_group: cost
    color: "#3498db"
This renders two side-by-side bar groups per time slot: an "energy" stack (solar + grid) and a "cost" stack (peak + off-peak). Backward compatible — if no stack_group is set, all entities stack together as before.
Per-group tooltip totals. With tooltip_stacked_total: true (the default), the tooltip shows a separate total for each named group — labelled with the group name (e.g. "energy Total", "cost Total") — so you can read each stack's sum at a glance. It is independent of show_tooltip_total: leave both on to show the per-group totals together with the grand Total of all entities, or turn either one off to show only the other. The per-group rows appear only when there are two or more stack groups; ungrouped entities roll into the grand Total.
Editor: Per-entity → Graph tab → Stacked dropdown (Inherit / On / Off) (v4.07), with the Stack Group text field next to it (shown while the entity is stacked: the card's Stacked toggle on and Inherit, or the dropdown set to On)
📑 Chart pages (v4.08)
Chart pages — several charts in one card (v4.08)
One card, several charts. Give entities a graph_group and the card draws every group on a page of its own — entities that share a name are drawn together, entities without one stay on the main page — with a small strip directly under the graph to switch between them: a dot per page, with ‹ and › right beside the dots. Three temperature sensors in a Climate group next to an ungrouped power sensor make two pages: the power bars on the main page, the three temperatures on the Climate page.
type: custom:statistics-graph-chart-card
card_header: Living Room
hours_to_show: 24
entities:
  - entity: sensor.house_power              # no graph_group → the main page
    graph_type: bar
  - entity: sensor.living_room_temperature
    graph_group: Climate                    # these three share the "Climate" page
  - entity: sensor.bedroom_temperature
    graph_group: Climate
  - entity: sensor.kitchen_temperature
    graph_group: Climate
How the pages come together:
- The main page holds every entity without a
graph_group(or with an empty one). The strip shows no names — only a dot per page; hover a dot (or let a screen reader read it) for the group name,Page Nfor the main page. - Order follows the first appearance in
entities— the dots run in that order. The card opens on the first page — the page of the first entity in the list, so put an ungrouped entity first to open on the main page. Spelling counts:Climateandclimateare two pages; spaces around the name are ignored. - Switching is done with the strip: click or tap ‹ or › (they stop at the first and last page), click or tap a dot, or focus a dot and press Enter or Space. The dots and the two arrows form one compact group in the middle of the strip, so nothing moves as you page through, whatever the group names. Pages turn only from the strip — dragging inside the plot zooms, as on every other card, and the touch gestures (tooltip, long-press zoom, pinch, pan of a zoomed chart) work as usual. The card remembers the page you picked until the dashboard is reloaded.
- Legend and state row. The compact legend, the per-entity statistics legend and the state rows list the entities of the page on screen — turning the page swaps the live values along with the chart. When the pages hold different numbers of entities, the number of state rows, and with it the height of the card, changes from page to page.
- Shared by every page: the date, interval and resolution pickers, zoom and pan, crosshair pins, the scroll position, card-level bounds and annotations, tooltip / zoom / scroll sync. Switching pages only changes what is drawn — nothing is fetched again.
- Export. CSV writes every entity of every page; the chart PNG is the page on screen; the card PNG leaves the page indicator out.
- Every chart mode. Pages work on a Timeline card as on a pie, ranking, gauge, heatmap or state timeline — each page draws the chart of its own entities (heatmap and calendar draw their first entity, so a page per entity gives one heatmap per page) — and on a sparkline card, where the page strip sits under the rows.
- A card where no entity sets
graph_groupis exactly as before: no indicator, nothing else changes.
Good to know:
- All pages share one
chart_mode, oneheightand the card-level Y bounds — a page cannot have a chart type or size of its own. - The page strip is about 20 px tall and sits directly under the plot, never over the x-axis dates: ‹, a dot per page and › as one group in the middle. With a numeric
heighta paged card is therefore about 22 px taller than the same card without pages; withheight: autoin a Sections grid or a Panel view the card keeps the size of its cell and the plot gives up that strip instead. - Entities on different pages are never drawn together, so they cannot stack:
stack_grouponly arranges the stacks within a page. Comparison ghosts, moving averages,ref_entityresults and other series derived from an entity stay on that entity's page. - Not templatable —
{{ }}is not evaluated in a group name.
Editor: Per-entity → Graph tab → Graph Group text field, right under Stacked / Stack Group, in every chart mode. Leave it empty to keep the entity on the main page — an empty field writes no YAML.
🔄 Invert Bars (Butterfly Charts)
Per-entity invert: true draws bars downward from the zero line. Tooltip, state row, and extrema labels show positive values. Combined with stacked: true, creates butterfly charts for energy import/export, network in/out, and similar comparisons.
stacked: true
entities:
  - entity: sensor.grid_import
    graph_type: bar
    aggregate_func: change
    color: "#f39c12"
    name: Import
  - entity: sensor.grid_export
    graph_type: bar
    aggregate_func: change
    invert: true
    color: "#3498db"
    name: Export
Inverted entities automatically form their own stacking group — normal bars stack upward from zero, inverted bars stack downward independently. The Y-axis expands symmetrically to accommodate both directions.
When used with line or area charts (not just bars), the fill correctly stops at the zero baseline: mirrored lines fill upward to zero, normal lines fill downward to zero, and series that cross zero get a clean positive/negative split.
invert flips the sign of the value in the shared data pipeline, so it is not timeline-only: in Waterfall it turns the entity into a subtraction step (see Waterfall), and it applies in every other chart mode too.
Editor: Per-entity → Advanced tab → Invert (Mirror) checkbox (next to Fixed Value)
🏷️ Data Labels
Print the numeric value of every visible data point right above its bar / line / point — the same kind of inline annotation ApexCharts calls dataLabels. Useful when you want the chart to be readable at a glance without forcing the viewer to hover for every value.
entities:
  - entity: sensor.solar_production_today
    graph_type: bar
    aggregate_func: change
    show_data_labels: true
    decimals: 1
    color: "#f1c40f"
How it works
- Labels render above each point, in the entity's color, with a card-background halo so they stay readable over crowded areas. On a
stacked: truebar chart each label is centered inside its own segment instead, in white or dark text — whichever stands out against that segment's color — and a segment too short to hold the number shows no label. - Number formatting follows the entity's own
decimalsandnumber_formatsettings — no separate config. - For bars, the font size adapts to the available bar width and shrinks down to a minimum of 7 px — it stops shrinking there and the label is still drawn, so on very narrow bars labels can overlap. Use
data_labels_font_sizeto pin a specific size if you'd rather control it yourself. - For lines / steps, labels anchor to the X position of each data point at a default 10 px.
When to use it
- Bar charts of daily / hourly aggregates where the exact number matters (energy, rain, hours of sunshine)
- Compact summary cards where hover isn't practical (mobile, kiosk displays)
- Reports / screenshots where the chart needs to stand alone without tooltip interaction
When NOT to use it
- High-density line charts — labels will overlap and become illegible
- When you already use
show_extremato highlight just the peaks; the two combined creates visual noise
Editor
Entity → Graph tab → Graph section → Data Labels toggle, sitting next to Show Average and Break on Gaps.
🎛️ Gauge Display
Replace the numeric state row with a half-circle gauge arc. Set show_state: gauge on any entity.
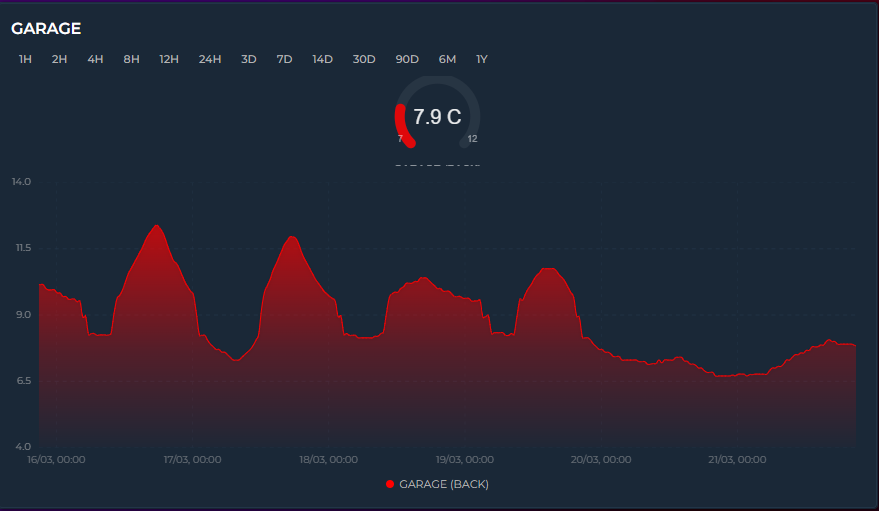
entities:
  - entity: sensor.temperature
    show_state: gauge
    color: "#ff4757"
    lower_bound: 15    # gauge minimum
    upper_bound: 30    # gauge maximum
The gauge arc sweeps 270° from lower_bound to upper_bound. The center shows the current value + unit, bottom edges show min/max labels. Multiple gauge entities display side-by-side: 1 entity = large gauge, 2+ = compact.
color_thresholds work with gauge — the arc color changes dynamically based on value.
The graph below the gauge continues to show the historical trend as usual.
✨ Sparkline Mode
Card-level sparkline: true strips all chrome and renders ultra-compact inline graphs. Only available in Timeline mode.

sparkline: true
entities:
  - entity: sensor.temperature
    color: "#ff4757"
  - entity: sensor.humidity
    color: "#378ADD"
grid_options:
  columns: 12
  rows: 2
Each entity becomes one row: name + value + trend icon on the left, tiny graph on the right. Removed: header, icon, toolbar, axes, grid, tooltip, legend, annotations. Preserved: entity colors, line smoothing, fill, trend icons, live streaming, color thresholds, and rise/fall colors.
🔋 Battery Icon
Display a battery level indicator on the card. When a header exists (title or icon), the battery appears in the top-right corner. When there's no header, it appears on the right side of the state row.
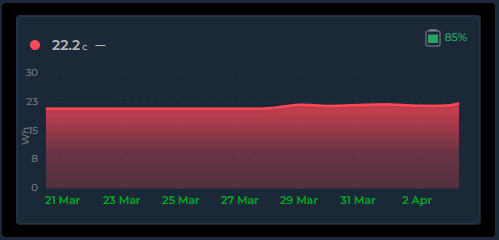
battery_entity: sensor.temperature_battery
battery_low_threshold: 20
Color adapts to battery level:
| Level | Color |
|---|---|
| >50% | Green |
| 25–50% | Yellow |
| low–25% | Orange |
| Below threshold | Red |
The low threshold defaults to 20% and accepts a number, entity ID (sensor.x), or entity attribute (sensor.x.attribute). Hover shows the entity friendly name and exact percentage.
The icon and percentage text scale proportionally with the Header & Battery Size setting (card_header_size). This applies in both header and state row positions.
Editor: General Settings → Overlay tab → Battery
🏷️ Compact Legend
Card-level show_legend: true adds a compact color-coded entity name key below the graph. Just colored dots and names — no values, no stats. Wraps to multiple lines on narrow cards. Every enabled entity is listed, including show_graph: false rows — set show_in_compact_legend: false on an entity to leave it out (v4.07).
show_legend: true
entities:
  - entity: sensor.memory
    name: "Memory"
    color: "#f39c12"
    show_state: false
  - entity: sensor.disk
    name: "Disk"
    color: "#85b7eb"
    show_state: false
  - entity: sensor.cpu
    name: "CPU"
    color: "#00bcd4"
    show_state: false
This produces: ● Memory ● Disk ● CPU in a centered wrapping row below the graph. Combine with show_state: false on entities to maximize graph area while still identifying colors.
For per-entity statistics (Min, Avg, Max, Sum, Last, Live), use the entity-level Legend toggle instead — see Entity Legend Stats.
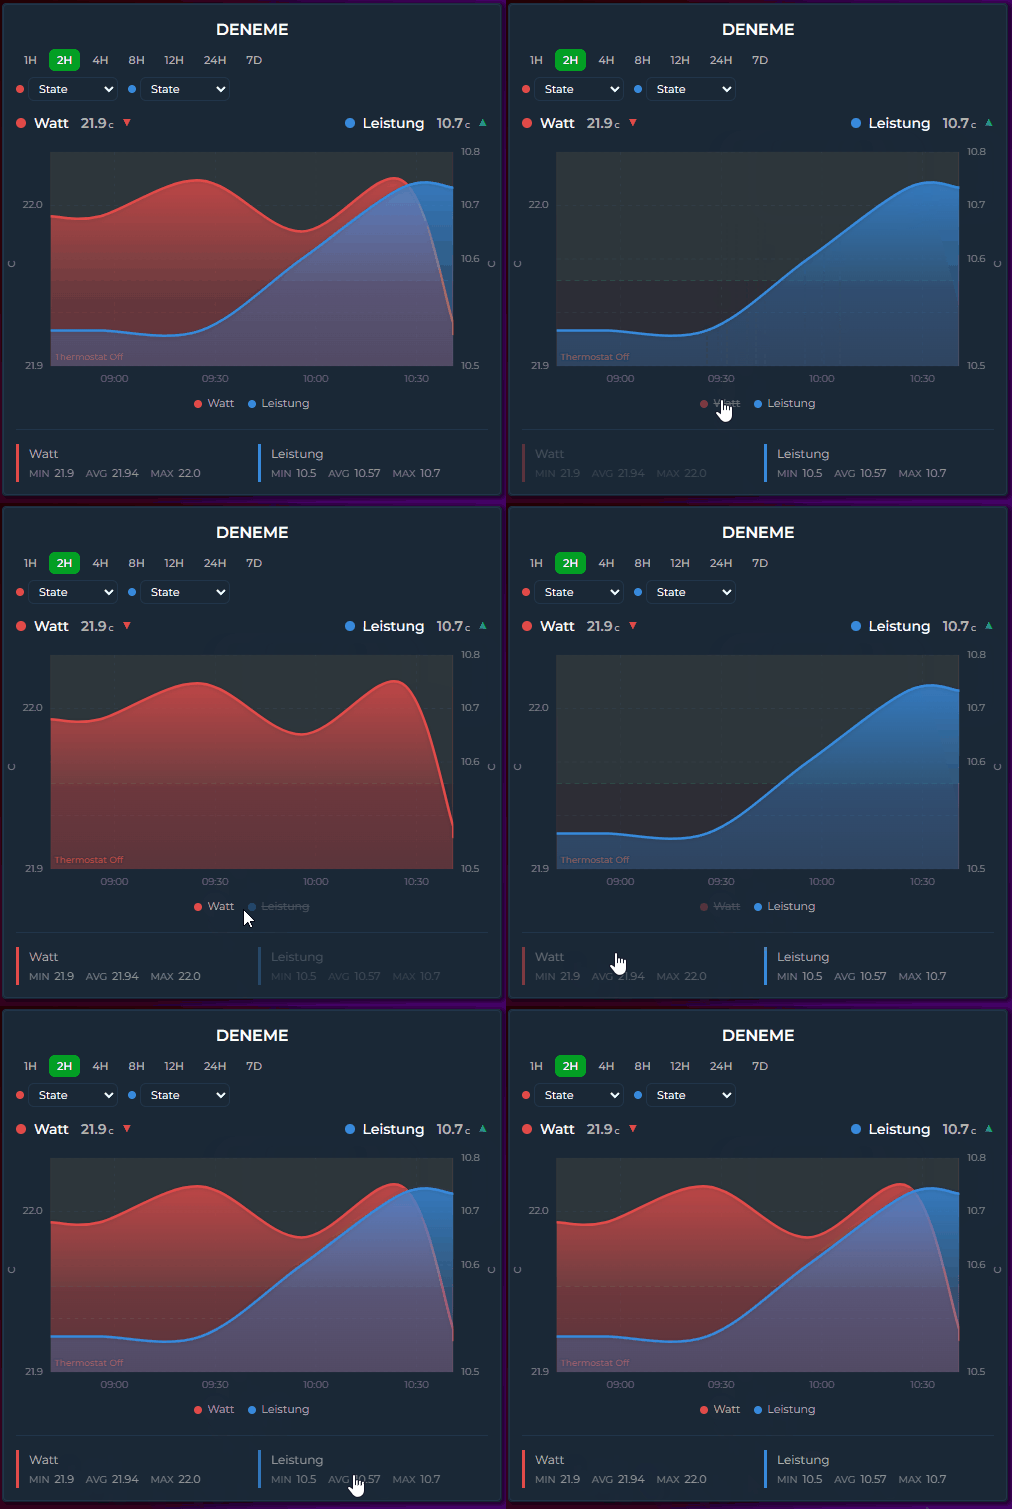
📊 Per-Entity Legend Stats
Each entity's Legend toggle (show_in_legend: true) lets you choose which statistics to display. Select any combination of Min, Avg, Max, Sum, Last and Live.
entities:
  - entity: sensor.temperature
    show_in_legend: true
    legend_stats:
      - avg
      - last
  - entity: sensor.humidity
    show_in_legend: true
    legend_stats:
      - min
      - max
min, avg, max and sum describe the time range currently on screen, and last is the final plotted value in it — so all five move when you change the period or zoom.
live (v3.32) is different: for a normal history-backed entity it is the state right now, independent of the displayed range.
entities:
  - entity: sensor.power
    show_in_legend: true
    legend_stats:
      - avg
      - live      # today's average, next to what the meter reads this second
It goes through the same value pipeline as the state row, so the two agree on what the number means:
- an
attribute:entity shows that attribute, not the entity's own state; - a
state_mapentity shows its mapped text label; invert,value_factorandvalue_transformare applied;- with
ref_entityit shows the combined value (theA − Byour chart draws), and shows—rather than a misleading number if the combination has nothing to report; - comparison ghost rows never get a Live value — a ghost shares the main entity's ID, so "now" would be printed under a "previous period" heading.
Two deliberate differences from the state row:
primary_state_as(and the legacyshow_state_last) are ignored here. Those pick what the state row displays; the Live chip is always the live reading, so a card withprimary_state_as: maxshows the max in the header and the current value in the legend.- Three configurations have no live state to show and fall back to the last value in the fetched window instead:
ref_entity(the last point of the combined series), a non-zerooffset, and long-term-statistics rows. For those the value is the last value of the loaded period — it changes with the period, not with a zoom.
Otherwise the Live value refreshes as soon as the entity changes, without waiting for the next data refresh.
The editor shows six checkboxes (Min, Avg, Max, Last, Sum, Live) inside the Legend section. Default is [min, avg, max] for backward compatibility.
⬇️ State Row Position
Entity state rows can be placed below the graph instead of above. The align_state option accepts six positions:
| Value | Position |
|---|---|
left (default) |
Above graph, left-aligned |
center |
Above graph, centered |
right |
Above graph, right-aligned |
bottom-left |
Below graph, left-aligned |
bottom-center |
Below graph, centered |
bottom-right |
Below graph, right-aligned |
entities:
  - entity: sensor.temperature
    align_state: bottom-left
  - entity: sensor.humidity
    align_state: left         # stays above the graph
Mix and match — some entities above, some below. Useful when you want the graph to be the first thing visible, with values underneath.
🖱️ Zoom, Export & Tools — Brush Zoom | PNG / CSV Export | Annotations | Auto Hide Entities
🔍 Brush Zoom
Click and drag on any Timeline mode graph to zoom into a specific time range. No configuration needed — it's always available.
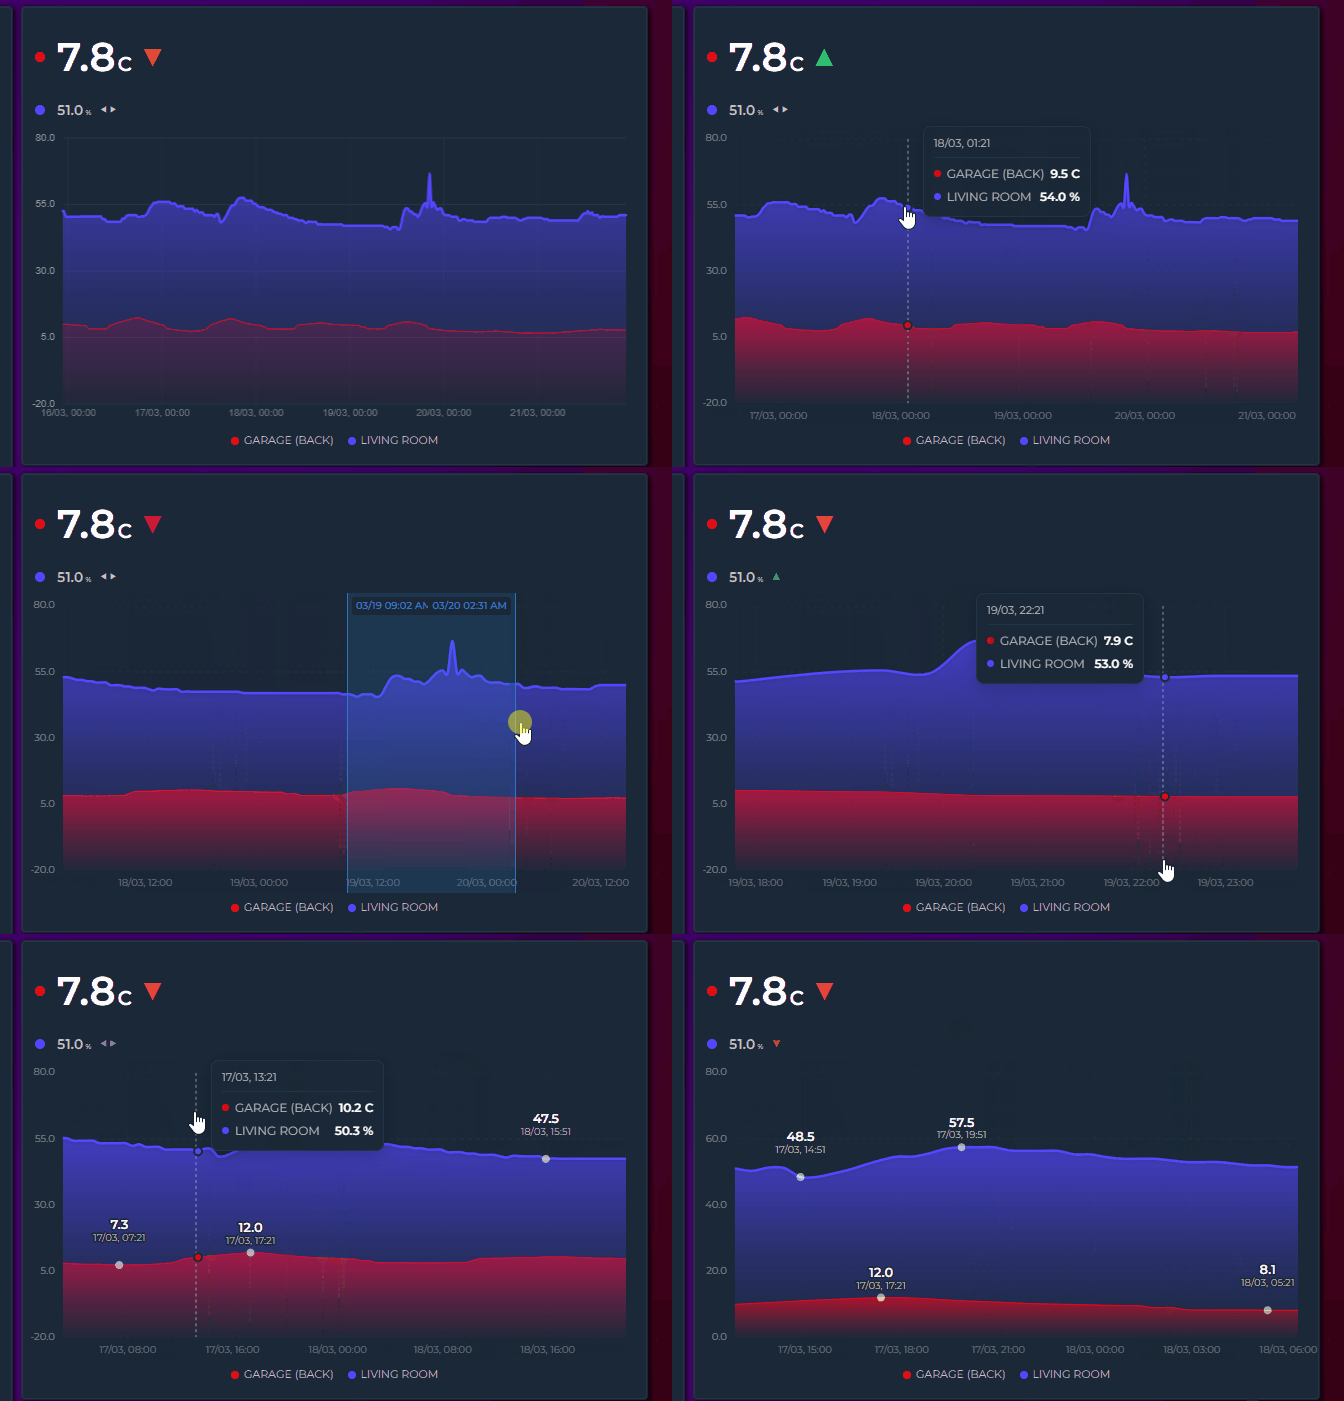
How it works
- Click and drag horizontally — a blue selection overlay appears with formatted timestamps at both edges
- Release — the graph zooms into the selected range: the Y axis and grid rescale to the data in view, the legend statistics (
show_in_legend— Min, Avg, Max, Sum, Last) are recalculated from the points inside that range, andshow_extremalabels move to the lowest and highest point in view. The state row and the legend'slivevalue are not range statistics: they keep showing the whole-period figure and the current state - Step back — double-click the graph (double-tap on mobile) to step back one zoom level (see Zoom History). Keep double-clicking to unwind every level and return to the full window
Key details:
- Instant zoom — zooming never re-fetches data from Home Assistant; zoom and reset are immediate.
- Progressive zoom — zoom again within an already-zoomed view to drill deeper into spikes or anomalies
- Touch support — works on mobile: long-press, then drag to select; once zoomed, a one-finger drag pans the window
- Minimum 15px selection — prevents accidental zoom from regular clicks or taps
- Time formatting — selection labels show time only for ranges under 24H, date + time for longer ranges
- Picker aware — changing the period via the interval picker or the date picker resets any active zoom and fetches fresh data
Zoom Buttons (new in v4.04)
Set show_zoom_buttons: true to put small zoom in, zoom out and reset buttons in the top-right corner of the chart, next to the export icon if you use one.
type: custom:statistics-graph-chart-card
show_zoom_buttons: true
hours_to_show: 168
entities:
  - entity: sensor.power
- Each click halves or doubles the visible range around its centre, down to a one-minute floor
- Reset appears only when there is something to reset — once you have zoomed or drilled in — and returns the chart to its full window in one click, unwinding Drill Down levels too
- Independent of the drag brush — they still work with
brush_zoom: false, which is the point on touch screens where the brush needs a long press first - Grouped cards follow through Zoom Sync, exactly as a brush zoom does
- Off by default, Timeline mode only, and hidden in sparkline and controller cards
Zooming is a view transform. It stretches the points already fetched and never asks Home Assistant for finer data, so zooming a 24-hour window down to one hour shows the same points spread wider. Use Drill Down when you want the card to re-fetch at a finer resolution.
Pinch Zoom (touch) (new in v3.25)
On touch devices, a two-finger pinch zooms the timeline directly — no long press needed:
- Spread two fingers to zoom in — the view scales live around the midpoint of the gesture while the fingers move
- Bring them together to zoom back out — zooming all the way out returns to the full window
- Any pinch angle works (improved in v3.26) — the gesture measures the true 2D distance between the fingers, so vertical and diagonal pinches (thumb below, index above — the most natural grip) zoom just like horizontal ones
- Amplified response (improved in v3.26) — zoom follows an amplified (squared) curve, so a small real-world pinch zooms meaningfully instead of barely moving the window; pinching inward zooms out just as strongly
- Double-tap still steps back one zoom level at a time — see Zoom History below
- Available whenever the drag brush is — the same gate applies (Timeline mode, brush zoom not disabled)
- Works with cross-card Zoom Sync: the final window is broadcast once at gesture end, not continuously during the pinch
Zoom History (new in v3.25)
Every committed zoom — a released brush selection or a finished pinch — pushes the previous window onto a history stack (up to 20 levels):
- Double-click (mouse) or double-tap (touch) steps back one level at a time
- With an empty stack, double-click shows the full window
- The stack resets whenever the data window itself refreshes — date/interval picker changes, the live window sliding forward, or a polling refresh
Changed in v3.25: double-click used to reset the zoom completely in one go. It now steps back one level at a time, so you can retrace a deep zoom instead of losing it all at once. Double-click repeatedly to unwind every level.
No new YAML options — pinch zoom and zoom history are part of the standard brush zoom behavior.
Mouse & Touch Behavior (updated in v4.03)
Mouse (desktop)
- Hover — the tooltip follows the pointer; leaving the graph hides it.
- Click with
crosshair: true— pins the crosshair at that time and the tooltip stays. Withcrosshair_pins: 2a second click places pin B. Once all pins are placed, a click on empty graph area clears them. - Press on a pin line (within about 12 px) and drag — moves the pin; no brush zoom starts.
- Press and drag on empty area — brush zoom (a drag shorter than 15 px does nothing).
- Double-click — steps back one zoom level, or drills up when not zoomed. It also undoes whatever its first click did to the pins.
- Right and middle click — ignored.
drill_down: true— a single click drills down. Withcrosshairon, the click places a pin instead, so combine drill-down withcrosshair: false.- A zoomed window is not panned with the mouse — a mouse drag is always a brush. Wheel and scroll mode are unchanged.
- Touch-screen Windows devices follow the touch rules below.
Touch (phones, tablets)
Touch gestures separate tooltip exploration from brush zoom:
| Gesture | Action |
|---|---|
| Tap | Tooltip appears instantly with crosshair and values. With crosshair: true it pins the crosshair instead and the tooltip stays after the finger lifts (v4.03) |
| Quick slide | Tooltip follows the finger across the graph; while a pin is in view the finger no longer moves it |
| Touch a pin line and drag | Moves the pin; the page does not scroll meanwhile (v4.03) |
| Hold on bar | Tooltip + bar highlight stay visible as long as the finger is held |
| Long press (600ms) + drag | Brush zoom selection starts (on a pin line it drags the pin instead) |
| Two-finger pinch | Zooms the timeline live around the gesture midpoint — any finger angle, amplified response curve (improved in v3.26) |
| Double-tap | Steps back one zoom level; full window once the history is empty (v3.25). Undoes whatever its first tap did to the pins (v4.03) |
| One-finger drag while zoomed | Pans the zoomed window left or right, keeping its length and stopping at the loaded data; the released position is broadcast to Zoom Sync cards once at the end. A mostly vertical drag scrolls the page as before (v4.03) |
| Lift finger | Tooltip and highlights clear — unless a pin holds them |
Holding still for 600ms prepares zoom but does not activate it — zoom only starts when the finger moves. This prevents the tooltip from disappearing while exploring a single data point. In scroll mode (max_visible_interval) a horizontal drag scrolls the chart natively; the pan gesture only applies to a brush or pinch zoom.
What changed in v4.03 (touch)
| Gesture | Before | Now |
|---|---|---|
| Tap | Tooltip shows, clears on lift | Same with crosshair off; with it on, a pin is placed and the tooltip stays |
| Lift finger | Tooltip clears | Clears unless a pin is in view |
| Quick slide | Tooltip follows | Same; ignored while a pin is in view |
| Long press + drag | Brush zoom | Same; on a pin line it drags the pin |
| One-finger drag while zoomed | Tooltip followed, the window did not move | Window pans, length kept, one Zoom Sync broadcast on release |
| Vertical drag | Page scrolls | Same |
| Two-finger pinch | Zoom | Same |
| Double-tap | Back one zoom level | Same, plus the first tap's pin change is undone |
Tap with drill_down |
Drill-down | Pin when crosshair is on, drill-down otherwise |
| Tooltip Sync | Broadcast while sliding, cleared on lift | A pinned time stays broadcast until the pins are cleared |
| Dragging a pin line | — | Moves the pin without scrolling the page |
| Right / middle click, pen buttons | — | Ignored |
With crosshair: false (the default) every gesture behaves exactly as before; the only new behaviour is panning a zoomed chart.
📍 Crosshair Pins — Locked tooltip | Two-point delta | Legend readout
A hover tooltip is gone the moment your finger leaves the screen. With crosshair: true a tap (or click) pins a crosshair at that time: the tooltip stays on screen, the pin can be dragged along the graph, and once all pins are placed a tap on empty graph area clears them.
type: custom:statistics-graph-chart-card
crosshair: true
crosshair_pins: 2          # 1 (default) or 2
crosshair_delta: true      # default: Δ rows when two pins are placed
crosshair_legend: true     # optional: pinned values next to the legend entries
entities:
  - entity: sensor.energy_today
  - entity: sensor.power
- One pin — the tooltip shows the values at the pinned time and stays put; hovering or sliding elsewhere no longer moves it. Drag the pin line to move it.
- Two pins (
crosshair_pins: 2) — the second tap adds pin B. The tooltip header becomes A → B with the time span between them, every series shows value A → value B, and withcrosshair_deltaa Δ row gives the change as a value and a percentage (green up, red down). With more than one numeric series a Total A → B row is added (its Δ followscrosshair_deltatoo). For a cumulative meter that delta is the consumption between the two points. Series that show state labels instead of numbers get no Δ. When a zoom or pan leaves one pin outside the view, that side reads "—" until it is back in view. - Legend readout (
crosshair_legend: true) — the same values appear next to each legend entry, coloured by trend when two pins are set. - Sync — the pinned time is broadcast through Tooltip Sync, so synced cards show their tooltip at that time; a card with its own pins ignores incoming hover updates.
- Pins are session state: they are not saved, and they clear when the card leaves the page. A pin that falls outside the visible window after a zoom or pan is kept and reappears when the window covers it again; while no pin is in view the hover tooltip works as usual. Pins are not part of PNG exports.
- While
crosshairis on, a tap is taken by the pin, sodrill_downdoes not fire on tap (double-click still drills up). Double-tap and double-click undo what their first tap did to the pins, so stepping back a zoom level neither leaves a stray pin behind nor loses the pins you had.
Editor: Overlay tab → Tooltip → Crosshair Pins, then Pins, Pin Delta and Pins in Legend.
📥 PNG / CSV Export
Card-level show_export: true overlays a small download icon on the top-right of the card. Clicking it opens a menu — Download PNG (Chart) / Download PNG (Card) / Download CSV — and the menu closes on any outside click.
type: custom:statistics-graph-chart-card
card_header: Energy Overview
show_export: true
entities:
  - entity: sensor.energy_consumption
PNG
- Download PNG (Chart) — a 2× resolution snapshot of the current plot — crisp on high-DPI displays
- Download PNG (Card) — captures the entire card exactly as rendered: header, chart, state row, and legend included
- Works in all chart modes: canvas-rendered modes (Pie, Heatmap, Ranking, …) are copied directly, and the SVG timeline is serialized with the correct axis-label styling and the card background color, so the file looks exactly like the card
- When the active theme paints the card with an external background image, the Card capture falls back to the Chart export — browsers block capturing images that come from another server.
CSV
- Wide format — the first column is
time(ISO 8601, UTC), followed by one column per visible series; series hidden via the legend are excluded - UTF-8 with BOM and CRLF row endings, so the file opens correctly in Excel without an import wizard
- Period Comparison ghosts export as their own suffixed columns, with timestamps shifted into the current window so they align with the main series
- Candlestick series export the bucket value only — no separate OHLC columns
Behavior
- Export what you see — if the chart is zoomed (brush or pinch), both the PNG and the CSV cover exactly the zoomed range
- Filenames combine the sanitized
card_headerwith a timestamp, e.g.Energy_Overview-20260715-1630.png/.csv - Hidden in sparkline mode
show_exportaccepts{{ }}templates — see Template Toggles
Editor
General Settings → Chart → Visual Options → Show Export Button.
📌 Annotations
Add reference lines, event markers, and highlight bands to the graph (Timeline mode only). Configure via the editor (General Settings → Overlay tab → Annotations) or YAML.
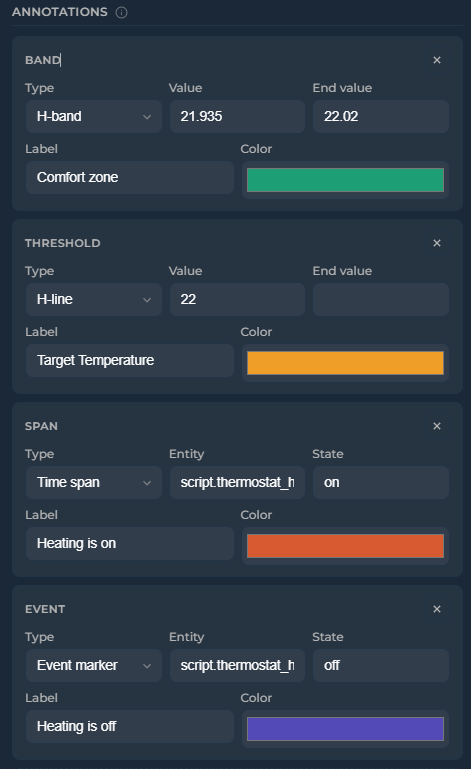
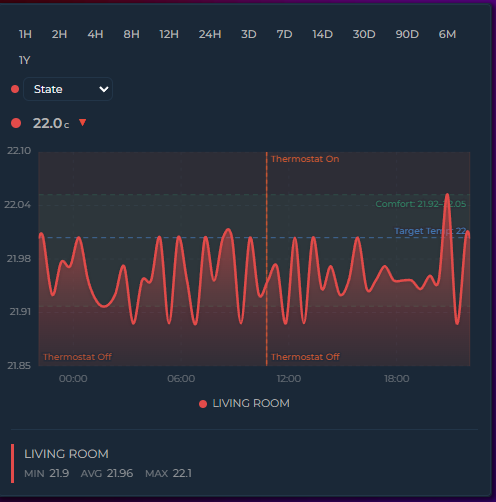
annotations:
  - type: threshold       # horizontal dashed line
    value: 22.5
    label: "Target"
    color: "#1D9E75"
  - type: threshold       # dynamic value from entity
    value: sensor.climate_setpoint
    label: "Setpoint"
    color: "#f39c12"
  - type: band            # horizontal shaded band
    value: 20
    value_end: 23
    label: "Comfort zone"
    color: "#1D9E75"
  - type: band            # dynamic band from entity attributes
    value: sensor.comfort.min_temp
    value_end: sensor.comfort.max_temp
    label: "Dynamic comfort"
    color: "#3498db"
  - type: event           # vertical marker at state transitions
    entity: binary_sensor.heating
    state: "on"
    label: "Heating on"
    color: "#D85A30"
  - type: span            # vertical band for active periods
    entity: binary_sensor.heating
    state: "on"
    color: "#D85A30"
| Type | Description |
|---|---|
threshold |
Horizontal dashed line at a fixed value, entity state, or entity attribute |
band |
Horizontal shaded band between value and value_end. Both accept numbers, entity IDs, or entity.attribute paths |
event |
Vertical marker — entity-driven (at each transition into a state or attribute value) or manual (fixed timestamp) |
span |
Vertical shaded band — entity-driven (duration in a specific state or attribute value) or manual (fixed start/end timestamps) |
| Option | Applies to | Description |
|---|---|---|
entity |
event, span | Entity whose history drives the annotation |
state |
event, span | The state to match — or, with attribute, the attribute value to match. Default: on. Numbers compare numerically, so 100 also matches 100.0 |
attribute |
event, span | Match one of the entity's attributes instead of its state, e.g. percentage. Dots reach nested attributes (hvac_action, forecast.0.condition) (v4.03) |
opacity |
All types | Prominence of the annotation (0–1) — fill for bands/spans, stroke for thresholds/events, and its label (v3.32). Default: 0.15 for bands/spans, 1 for thresholds/events |
label_opacity |
All types | Opacity of the label only (0–1), overriding whatever opacity would give it. Default: none (v3.32) |
show_values |
threshold, band | Show numeric values alongside the label. Default: true |
label |
All types | Text label displayed on the annotation |
color |
All types | Color of the annotation line, fill, or marker |
label_color |
All types | Color of the label. Default: the annotation's color |
label_font_size |
All types | Label size in px. Default: 10 |
label_position |
threshold, event | left/right for thresholds (default right), top/bottom for events (default top) |
line_width |
threshold, event | Line thickness in px. Default: 1.5 |
line_style |
threshold, event | solid, dashed or dotted. Default: dashed for thresholds, dotted for events |
y_axis |
threshold, band | Set to secondary to position the annotation against the secondary Y axis |
The editor's annotation rows expose Type, Source/Value (for entity-driven events and spans: Entity, Attribute and State), Label, Color, Opacity and Show Values. The remaining options —
label_opacity,label_color,label_font_size,label_position,line_width,line_styleandy_axis— are YAML only.
Threshold and band values accept: 22.5 (number), sensor.x (entity state), sensor.x.attribute (entity attribute with nested path support).
Live updates: when a threshold or band value references a sensor or input helper, the annotation updates instantly as soon as that entity's state changes — no need to wait for the next data refresh. Combine with a HA template sensor to get seasonal or month-based thresholds that automatically move over time:
# configuration.yaml
template:
  - sensor:
      - name: Solar Target
        state: >
          {% set m = now().month %}
          {% if m in [6,7,8] %}8000
          {% elif m in [4,5,9,10] %}5000
          {% else %}2000
          {% endif %}
        unit_of_measurement: kWh
# card
annotations:
  - type: threshold
    value: sensor.solar_target
    label: Seasonal target
    color: "#1D9E75"
Use show_values: false on any threshold or band to hide the value label while keeping the line/band visible. When enabled (default), the numeric value appears alongside the label — or by itself if no label is set:
annotations:
  - type: band
    value: 20
    value_end: 25
    label: "Comfort"
    color: "#1D9E75"
    show_values: false    # band visible, no text labels
Manual timestamps — event markers and time spans can use fixed timestamps instead of tracking an entity. Switch between Entity and Manual source in the editor, or set directly in YAML:
annotations:
  - type: span
    start: "2026-04-15T08:00:00"
    end: "2026-04-15T18:00:00"
    label: "Day shift"
    color: "#ff9800"
  - type: event
    time: "2026-04-15T12:00:00"
    label: "Noon"
    color: "#e74c3c"
Attribute matching (v4.03) — entity-driven spans and events normally follow the entity's state. Add attribute to follow one of its attributes instead; state then holds the attribute value to match. A fan that is always on at a low speed, for example, can highlight only the periods it ran at full speed:
annotations:
  - type: span
    entity: fan.wetroom_extractor_fan
    attribute: percentage     # follow this attribute instead of the state
    state: 100                # …and match this value
    label: "Boost"
    color: "#ff6a00"
  - type: event
    entity: climate.living_room
    attribute: hvac_action
    state: heating            # a marker each time heating starts
Numbers compare numerically (100 matches 100.0), everything else compares as text. Nested attributes are reached with dots (forecast.0.condition). The card asks Home Assistant for the full attribute history of that entity, including updates that changed only the attribute, so a speed change while the fan stays on is seen.
Opacity — control the prominence of each annotation with the opacity option (0–1). Applies to all types: fill opacity for bands and spans, stroke opacity for threshold lines and event markers, and the annotation's label (v3.32) — so a faded annotation fades as a whole instead of keeping a solid caption on top.
Labels follow opacity relative to that type's own default, because the defaults differ for a good reason: a band fills a whole region, so it defaults to a light 0.15, while a line and a caption default to fully opaque. In practice:
| You write | Threshold / event label | Band / span label |
|---|---|---|
| nothing | fully opaque | fully opaque |
opacity: 0.15 |
15% | fully opaque (0.15 is the band default — same rect, same label) |
opacity: 0.5 |
50% | fully opaque |
opacity: 0.075 |
7.5% | 50% (half the default → half strength) |
So dimming an annotation below its normal look dims its label by the same proportion, and for thresholds and event markers — whose normal look is fully opaque — the label simply uses the value you set.
label_opacity overrides all of that when a label needs its own alpha:
annotations:
  - type: band
    value: 18
    value_end: 24
    label: "Comfort zone"
    opacity: 0.04          # barely-there fill
    label_opacity: 0.9     # but a clearly readable caption
Annotations that never set opacity are unchanged: their labels stay fully opaque. One consequence worth knowing: opacity: 0 on any annotation used to hide the shape while keeping its caption — that now hides the caption too, so add label_opacity: 1 if you relied on it.
annotations:
  - type: band
    value: 18
    value_end: 24
    color: "#1D9E75"
    opacity: 0.3        # more prominent than default 0.15
  - type: threshold
    value: 30
    color: "#e74c3c"
    opacity: 0.5         # semi-transparent line
Jinja2 templates — annotation fields start, end, time, value, value_end, and label accept Jinja2 templates. Values update automatically when referenced entities change:
annotations:
  - type: threshold
    value: "{{ states('sensor.target_temperature') | float }}"
    label: "{{ states('input_text.target_label') }}"
    color: "#e74c3c"
  - type: span
    start: "{{ states('input_datetime.shift_start') }}"
    end: "{{ states('input_datetime.shift_end') }}"
    label: "Shift"
    color: "#ff9800"
🙈 Auto Hide Entities
Start the card with every series hidden — ideal for "pick what you want to see" dashboards with many entities.
auto_hide_entities: true
show_legend: true
Click legend items to reveal series. Reveals stick for the session, and entities added later also start hidden.
Editor
General Settings → Chart → Visual Options → Auto Hide Entities.
🔗 Multi-Card Sync — Tooltip Sync | Zoom Sync | Scroll Sync
🔗 Tooltip Sync
Synchronize hover crosshairs across multiple cards on the same dashboard page. When you hover over one card, all synced cards show their tooltip and crosshair at the same timestamp — even if they display different entities or different time ranges.
This is a card-level feature (not entity-level), because what's shared is a timestamp, not an entity value. All entities on a synced card show their values at that moment simultaneously.
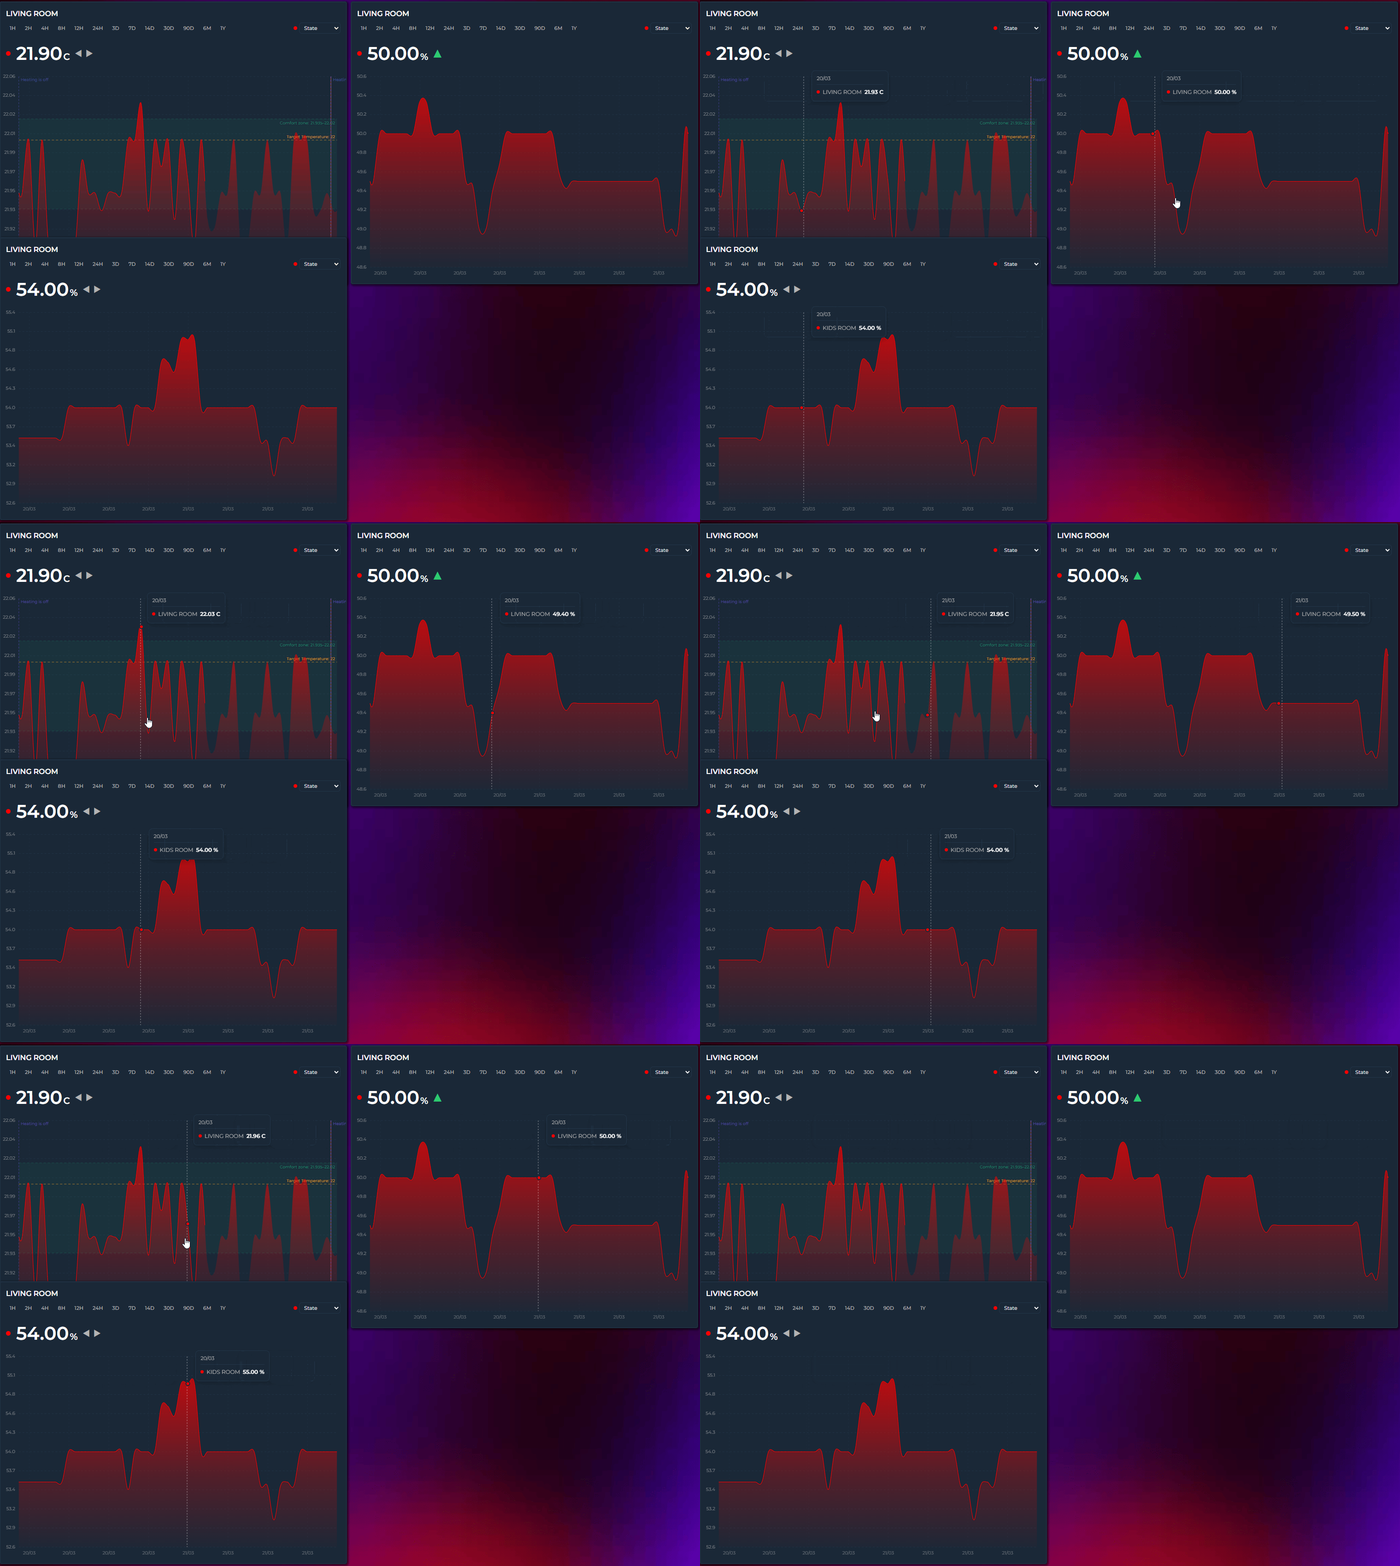
Setup
Enable Tooltip Sync on each card you want to participate, and give related cards the same Sync Group name:
# Card 1 — Bedroom Temperature
type: custom:statistics-graph-chart-card
tooltip_sync: true
tooltip_sync_group: "bedroom"
entities:
  - entity: sensor.bedroom_temperature

# Card 2 — Bedroom Humidity (syncs with Card 1)
type: custom:statistics-graph-chart-card
tooltip_sync: true
tooltip_sync_group: "bedroom"
entities:
  - entity: sensor.bedroom_humidity

# Card 3 — Kitchen Temperature (independent)
type: custom:statistics-graph-chart-card
tooltip_sync: true
tooltip_sync_group: "kitchen"
entities:
  - entity: sensor.kitchen_temperature

# Card 4 — Energy (no sync at all)
type: custom:statistics-graph-chart-card
entities:
  - entity: sensor.energy
In this setup:
- Cards 1 and 2 sync with each other (both in "bedroom" group)
- Card 3 syncs only with other "kitchen" cards
- Card 4 has no sync — hovering over it broadcasts nothing, and it ignores broadcasts from others
Sync Group Rules
| Sync Group value | Behavior |
|---|---|
"bedroom" |
Syncs only with other cards that have tooltip_sync_group: "bedroom" |
"kitchen" |
Syncs only with "kitchen" cards |
| (empty / not set) | Syncs with all tooltip-synced cards on the page, regardless of their group |
tooltip_sync: false |
Card does not participate in sync at all |
Tip: The group name is completely arbitrary — use room names, floor numbers, or any string you like. It just needs to match across the cards you want to link.
How It Works
- You hover over Card A — the card shares the hovered moment (the timestamp) with the rest of the page
- Every other card with Tooltip Sync enabled listens for it
- If the group matches exactly, the receiving card moves its own crosshair and tooltip to that same moment. An empty group is a group in its own right: ungrouped cards sync only with other ungrouped cards, and never with a named group
- When you move the mouse away, all synced tooltips clear together
- A pinned crosshair (
crosshair: true) broadcasts its time too, so the synced cards keep showing that moment until the pin is cleared
Cards with different hours_to_show ranges still sync correctly — the shared language is the timestamp, not the pixel position. A card showing 24H and a card showing 7D will both jump to 2:35 PM if that's where your mouse is.
Timeline mode only.
🔍 Zoom Sync
Synchronize zoom windows across multiple cards. When you brush-zoom into a time range on one card — or double-click to reset — every other card in the same group adopts the same window. The exact same tooltip_sync_group pattern, just for zoom instead of hover.
Setup
Enable Zoom Sync on each card you want to participate, and give related cards the same Sync Group name:
# Card 1 — Energy Production
type: custom:statistics-graph-chart-card
zoom_sync: true
zoom_sync_group: "energy"
entities:
  - entity: sensor.energy_produced

# Card 2 — Energy Consumption (zoom mirrors Card 1)
type: custom:statistics-graph-chart-card
zoom_sync: true
zoom_sync_group: "energy"
entities:
  - entity: sensor.energy_consumed

# Card 3 — Climate (independent zoom)
type: custom:statistics-graph-chart-card
zoom_sync: true
zoom_sync_group: "climate"
entities:
  - entity: sensor.living_room_temperature
In this setup, brush-zooming Card 1 zooms Card 2 to the same window — Card 3 keeps its own zoom.
How It Works
- You brush-zoom on Card A — once the zoom completes, the start and end of the new window are shared with the rest of the page
- Every other card with Zoom Sync enabled listens for it
- If the group matches exactly, the receiving card adopts the same time window. An empty group is a group in its own right: ungrouped cards sync only with other ungrouped cards, and never with a named group
- Resetting the zoom on any synced card clears the zoom on every card in the group
The time window is shared in real time (timestamps, not pixels) so cards with different hours_to_show or points_per_hour still land on exactly the same zoomed range.
Pinch zoom (new in v3.25) participates too — the pinched window is broadcast once at gesture end, not continuously while the fingers move. The same goes for a one-finger pan of a zoomed chart (v4.03): the window is sent once when the finger lifts. And since double-click / double-tap now steps back one zoom level at a time (see Brush Zoom → Zoom History), each step is broadcast as well, so every card in the group walks back through the levels together.
Combining with Tooltip and Scroll Sync
All three sync features use independent groups so you can mix them however you like — for a fully-linked dashboard, give all three the same group name on every card:
tooltip_sync: true
tooltip_sync_group: "main"
zoom_sync: true
zoom_sync_group: "main"
scroll_sync: true
scroll_sync_group: "main"
Timeline mode only. Requires Brush Zooming to be enabled.
↔️ Scroll Sync
Synchronize horizontal scrolling across cards. Most useful with max_visible_interval set so the chart is wider than what's visible — scrolling one card slides every other card in the same group to the matching position.
Setup
# Card 1 — 40 days total, 10 days visible at a time
type: custom:statistics-graph-chart-card
hours_to_show: 960              # 40 days
max_visible_interval: 240       # 10 days visible
scroll_mode: scrollbar
scroll_sync: true
scroll_sync_group: "energy"
entities:
  - entity: sensor.energy_produced

# Card 2 — same setup, scrolls in lock-step
type: custom:statistics-graph-chart-card
hours_to_show: 960
max_visible_interval: 240
scroll_mode: scrollbar
scroll_sync: true
scroll_sync_group: "energy"
entities:
  - entity: sensor.energy_consumed
Now dragging the scrollbar (or wheel-scrolling, depending on scroll_mode) on one card moves the other to the matching position.
How It Works
The shared value is a relative scroll position (0–1), not absolute pixels. That means:
- Cards with identical width and
hours_to_showstay perfectly aligned - Cards with different sizes still land on the same relative point — if you're halfway through Card A's scroll range, Card B jumps to halfway through its own range
- Cards without a scrollable area (
max_visible_intervalnot set, or the data isn't wide enough) silently ignore broadcasts
Cards never enter a feedback loop — a card that moves in response to a sync event does not broadcast that movement back.
Combining with Zoom and Tooltip Sync
Identical group rules to Tooltip / Zoom Sync. Use the same group name across all three for a fully linked experience — hover, zoom and scroll all stay in step.
Timeline mode only.
🧩 Templates — Template Names | Template Toggles (Boolean Templates)
🏷️ Template Names
Entity names support HA-style {{ }} templates that resolve dynamically from live entity states:
name: "{{ state_attr('sensor.room', 'friendly_name') }}"
name: "{{ states('sensor.power') }} W"
name: "{{ state_attr('sensor.temperature', 'device_class') | capitalize }}"
name: "Room: {{ state_attr('sensor.room', 'friendly_name') | upper }}"
Supported functions
| Function | Description |
|---|---|
states('entity_id') |
Current state value |
state_attr('entity_id', 'attribute') |
Entity attribute value |
is_state('entity_id', 'value') |
Returns "true" or "false" |
Supported filters
Filters are chained with |, just like Jinja2:
| Filter | Example | Result |
|---|---|---|
capitalize |
temperature → |
Temperature |
upper |
salon → |
SALON |
lower |
SALON → |
salon |
title |
living room → |
Living Room |
trim |
" text " → |
"text" |
int |
"22.5" → |
"22" |
float |
"22" → |
"22" |
round(n) |
22.567 | round(1) → |
"22.6" |
replace('a','b') |
replace('_',' ') |
Replaces all occurrences |
default('val') |
Fallback if empty/unknown | |
truncate(n) |
Cuts to n chars + … |
Multiple filters can be chained: {{ state_attr('sensor.x', 'type') | replace('_', ' ') | title }}
🧩 Template Toggles (Boolean Templates)
Most boolean display toggles accept a Jinja2 {{ }} template string instead of a fixed true / false — the same mechanism color already uses. Templates are evaluated server-side by HA via render_template WebSocket subscriptions, so the toggle flips live the moment its dependencies change — no polling, no reload.
type: custom:statistics-graph-chart-card
show_legend: "{{ states('input_boolean.show_legend') == 'on' }}"
entities:
  - entity: sensor.temperature
    show_state: "{{ states('input_boolean.show_state') == 'on' }}"
Templatable keys
Card level: show_legend, show_grid, show_tooltip, show_tooltip_total, tooltip_stacked_total, show_now_line, show_x_axis, show_y_axis, show_y2_axis, show_x_ticks, show_y_ticks, show_y_axis_label, stacked, period_highlight, logarithmic, state_timeline_show_labels, show_export.
Entity level: show_state, show_in_legend, show_in_compact_legend, show_graph, show_line, show_fill, show_points, smooth, gradient, show_data_labels, show_average, show_trend_icon, show_color_dot, show_timestamp, show_range_values, show_extrema_min, show_extrema_max, extrema_show_timestamp, state_adaptive_color, stacked (v4.07; unresolved = inherit the card setting).
The entity variable (new in v3.29)
Inside entity-level templates, the row's own entity id is available as a ready-made entity variable — so one generic template can be copy-pasted across every entity unchanged. It works in the display toggles and in the entity-level string fields: color, name, tooltip_name, icon, icon_color, state_color:
entities:
  - entity: sensor.temp_kitchen
    show_graph: "{{ area_id(entity) == states('input_select.selected_zone') }}"
  - entity: sensor.temp_livingroom
    show_graph: "{{ area_id(entity) == states('input_select.selected_zone') }}"   # same text, no edits
Two popular uses — per-entity names and colors from one central place:
entities:
  # every row shows its DEVICE name instead of the sensor name
  - entity: sensor.refrigerateur_power
    name: "{{ device_attr(entity, 'name_by_user') or device_attr(entity, 'name') }}"
  # every row pulls its color from a central color-registry sensor
  - entity: sensor.refrigerateur_power
    color: >-
      {{ state_attr('sensor.entity_colors', 'entities')[device_attr(entity, 'name')] | default('red') }}
No more {% set entity = 'sensor.…' %} boilerplate at the top of every template (templates that still do keep working — their own set simply wins). Templates that mention entity are evaluated once per entity; templates that don't keep sharing a single subscription as before. Card-level templates (title, axis colors, …) have no single-entity context and do not receive the variable.
Accepted template output
The rendered result is interpreted loosely, so templates can return whatever is convenient:
| Template output | Interpreted as |
|---|---|
true / false |
boolean |
on / off |
boolean |
yes / no |
boolean |
| numbers | "0" → false, any other number → true |
unknown / unavailable / none |
false |
Behavior
- Results update live — the card subscribes to the template and re-renders on every new result.
- Until the first result arrives, the option uses its default value.
- Unrecognized template output falls back to the option's default.
Editor
A templated toggle is locked in the visual editor — dimmed, with a {…} badge, and a tooltip showing the template — and is never overwritten by other edits. Remove the template from YAML to unlock the checkbox again.
Not templatable
Data-source and sync booleans are intentionally not templatable — e.g. cache, show_range_band, invert, break_on_null, show_full_period, tooltip_sync / zoom_sync / scroll_sync, energy_date_sync, show_date_picker, sparkline. These change what data is fetched or how cards talk to each other, not just how things are displayed.
💡 Examples
Ready-to-use YAML configurations
Basic: Single Sensor
type: custom:statistics-graph-chart-card
card_header: Bedroom
hours_to_show: 12
entities:
  - entity: sensor.bedroom_temperature
    name: Temperature
    color: "#ff6b35"
    icon: mdi:thermometer
🌡️ Multi-Entity with Dual Axes
Combine temperature and humidity on the same card without the scales conflicting.
type: custom:statistics-graph-chart-card
card_header: Climate
card_icon: mdi:home-thermometer
hours_to_show: 24
lower_bound_secondary: "~0"
upper_bound_secondary: "~100"
entities:
  - entity: sensor.temperature
    name: Temperature
    color: "#ff6b35"
    y_axis: primary
    icon: mdi:thermometer

  - entity: sensor.humidity
    name: Humidity
    color: "#00bcd4"
    y_axis: secondary
    icon: mdi:water-percent
⚡ Bar Chart with Legend
type: custom:statistics-graph-chart-card
card_header: Energy Today
entities:
  - entity: sensor.daily_energy
    name: Consumption
    graph_type: bar
    color: "#2ecc71"
    show_in_legend: true
    aggregate_func: sum
    group_by: hour
🎯 Period Highlight
On bar charts, hovering a bar shades the background of the entire period under the cursor — a soft band spanning the full bar slot — so it is immediately clear which period a tooltip or value belongs to. It is most useful with several entities drawn side by side, where the thin gaps between adjacent periods otherwise make the boundaries hard to read.
type: custom:statistics-graph-chart-card
period_highlight: true
period_highlight_color: rgba(128,128,128,0.3)   # optional; empty = subtle theme grey
graph_type: bar
group_by: date
entities:
  - sensor.garage_temp
  - sensor.kids_room_temp
  - sensor.living_room_temp
- Off by default. Enable with
period_highlight: true. period_highlight_coloraccepts any CSS color (hex, rgba, name) or variable. You can also set the--sgc-period-highlight-colorCSS variable from a theme orcard_mod. Leave it empty for a subtle theme grey.- The band follows the hovered period, so it lines up exactly with the bar group beneath it.
- Works whether or not
show_tooltipis enabled — turn the tooltip off and you still get the period band on hover. - In the visual editor it lives in the Tooltip section.
- Available in Timeline mode (bar and line charts).
🎨 Color Thresholds
Colorize the graph based on value ranges. Two independent settings control the behavior:
Direction — which axis the colors are painted along:
vertical(default) — Y-axis gradient. The entire chart is colored based on value height.horizontal— per-segment coloring along the time axis. Each line segment gets the color matching its data value.
Transition — how colors change at threshold boundaries:
smooth(default) — gradual interpolation between adjacent threshold colors.hard— instant color switch exactly at the threshold value.
type: custom:statistics-graph-chart-card
entities:
  - entity: sensor.outdoor_temperature
    name: Outdoor Temp
    color: threshold
    state_color: threshold
    color_thresholds:
      enabled: true
      direction: vertical   # or: horizontal
      transition: smooth     # or: hard
      values:
        - value: 0
          color: "#3498db"
        - value: 15
          color: "#2ecc71"
        - value: 25
          color: "#f39c12"
        - value: 35
          color: "#e74c3c"
All four direction × transition combinations are available from the editor under Colors → Color Thresholds.
Setting color: threshold propagates threshold colors to the state row dot as well. Setting state_color: threshold colors the displayed value text.
Gradient fill is threshold-aware. When gradient: true is enabled alongside color_thresholds, the fill area under the line is rendered as a vertical gradient whose colors match the line — the gradient stops sample threshold colors at chart top, zero line, and chart bottom. For a chart that crosses zero with two threshold bands (e.g. purple above zero, green below), the fill blends from purple at the top through transparent at the zero line down to green at the bottom, just like the line itself.
Dynamic thresholds from entities. Both the value and the color of each threshold entry can be an entity reference instead of a fixed literal. Use sensor.x for an entity's state or sensor.x.attribute for one of its attributes (nested attribute paths are supported). This lets thresholds track other sensors — a seasonal comfort target, a calculated limit, or a color served by a template sensor — and they update live as those entities change, without waiting for the next data refresh.
color_thresholds:
  enabled: true
  values:
    - value: sensor.heating_setpoint        # threshold follows a sensor's state
      color: "#3498db"
    - value: sensor.comfort.upper           # or one of its attributes
      color: sensor.theme_colors.warn       # the color can be entity-driven too
📈 Rise/Fall Colors
Color each graph segment green when rising and red when falling — without needing to define any value thresholds. trend_period_hours controls how sensitive the detection is.
type: custom:statistics-graph-chart-card
entities:
  - entity: sensor.stock_price
    name: Price
    rise_fall_colors:
      enabled: true
      increase: "#2ecc71"
      decrease: "#e74c3c"
      stable: "#95a5a6"
    trend_period_hours: 2
🎨 Color Templates
Use Jinja2 templates in any color field to manage colors centrally. Create a single template sensor with all your entity colors, and every card updates when you change it.
Setup: Create a central color sensor
# configuration.yaml → template section
template:
  - sensor:
      - name: "Entity Colors"
        unique_id: entity_colors_map
        state: "ok"
        attributes:
          entities: >-
            {{
              {
                "Temperature": "#FF6B6B",
                "Humidity": "#2ecc71",
                "Solar": "#f1c40f"
              }
            }}
Usage in card YAML:
entities:
  - entity: sensor.temperature
    color: "{{ state_attr('sensor.entity_colors','entities')['Temperature'] | default('#ff4757') }}"
    icon_color: "{{ states('input_select.theme_accent') }}"
Templates are evaluated server-side by HA via WebSocket subscriptions — colors update automatically when dependencies change, with no polling. In the editor, typing {{ in any color field dims the picker automatically.
Works with color, point_colors, icon_color, state_color, and all card-level color options (y_axis_color, x_axis_color, y_grid_color, x_grid_color, card_icon_color).
➖ Average Line
Draw a dashed reference line at the mean value over the visible time window. Useful for spotting trends at a glance.
type: custom:statistics-graph-chart-card
hours_to_show: 24
entities:
  - entity: sensor.outdoor_temperature
    name: Temperature
    color: "#ff6b35"
    show_average: true

  # Multiple entities each show their own average in their own color
  - entity: sensor.indoor_temperature
    name: Indoor
    color: "#00bcd4"
    show_average: true
🔗 Attribute Reading
Read a specific attribute instead of the main entity state. Supports dot notation for nested paths.
type: custom:statistics-graph-chart-card
entities:
  # Simple attribute
  - entity: weather.home
    name: Humidity
    attribute: humidity
    icon: mdi:water-percent

  # Nested attribute (e.g. first forecast entry)
  - entity: weather.home
    name: Forecast Temp
    attribute: forecast.0.temperature
    icon: mdi:thermometer
🔀 State Map — Non-Numeric Entities
Use state_map to graph entities with string states like input_boolean, binary_sensor, or input_select. States are mapped to numbers in the order they are listed, starting at 0.
The Y-axis automatically shows the original state names instead of numeric indexes — so a washing machine graph displays idle, running, done on the axis, not 0, 1, 2. The chart tooltip shows the matching entry's label too (nearest entry when values are aggregated) — improved in v3.29: timeline tooltips previously showed the numeric index.
You can optionally provide friendly display labels with the label field — useful when the raw state is technical (armed_home) but you want a cleaner axis (Home):
type: custom:statistics-graph-chart-card
entities:
  # binary_sensor → 0 (off) / 1 (on), axis shows "off" / "on"
  - entity: binary_sensor.front_door
    name: Front Door
    color: "#9b59b6"
    graph_type: step
    state_map:
      - value: "off"
      - value: "on"

  # With friendly labels — axis shows "Idle" / "Running" / "Done"
  - entity: sensor.washing_machine
    name: Washing Machine
    graph_type: step
    state_map:
      - value: "idle"
        label: Idle
      - value: "running"
        label: Running
      - value: "done"
        label: Done

  # input_select → 0 / 1 / 2 / 3
  - entity: input_select.heating_mode
    name: Heating Mode
    state_map:
      - value: "off"
      - value: "eco"
      - value: "comfort"
      - value: "boost"
In the visual editor, the State Map textarea accepts a value, label, color syntax — one line per state, with the label and color both optional. Any CSS color works (name, hex, or var(--…)):
off, Idle, grey
on, Running, green
These colors are used as the segment color in state_timeline mode (and for the dot/marker elsewhere). Colors set in YAML — color: under a state_map entry — are preserved when you re-open the card in the editor.
Auto-detected for
binary_sensor,input_boolean, and anyinput_selectentity in step mode — you don't need to define astate_mapfor those, the card detects available states automatically and labels the axis accordingly.
Compass axis for wind direction (v3.29)
state_map also works as a pure axis-label list for numeric sensors: entries that never match the state are ignored for data (the numeric value passes through), but the axis and tooltip still use them as labels. Combined with value_transform, this turns a wind-direction sensor (0–360°) into a compass chart — no custom formatter functions needed:
type: custom:statistics-graph-chart-card
title: Daily Wind Direction
graph_start: day
group_by: interval
points_per_hour: 2          # 30-minute buckets
show_y_axis: true
y_axis_ticks: 8             # a label every 45° (N, NE, E, …); use 16 for all sectors
entities:
  - entity: sensor.wind_direction
    name: Wind Direction
    aggregate_func: avg
    decimals: 0
    unit: ""
    value_transform: "return 16 - (((x % 360) + 360) % 360) / 22.5;"
    state_map:              # axis labels, bottom → top (index 0..16)
      - value: ""
      - value: "NNW"
      - value: "NW"
      - value: "WNW"
      - value: "W"
      - value: "WSW"
      - value: "SW"
      - value: "SSW"
      - value: "S"
      - value: "SSE"
      - value: "SE"
      - value: "ESE"
      - value: "E"
      - value: "ENE"
      - value: "NE"
      - value: "NNE"
      - value: "N"
The transform maps 0° (N) to the top of the axis and the tooltip shows the compass name of the hovered value (SSW, not 202°). The empty first entry keeps N from being printed twice (0° and 360° are the same direction).
Two honest limitations of the recipe:
- The last sliver before due north (≈349°–360°) rounds onto that unlabeled wrap entry, so the tooltip shows a small number there instead of
N. If northerly winds dominate your site, give the first entryvalue: "N"instead — the tooltip then always readsN, at the cost of the axis printingNat the bottom rather than the top. - Averaging compass degrees is circular math done linearly: a bucket whose samples straddle the 0°/360° seam (e.g. 350° and 10°) averages to ~180° and gets labeled
S. This artifact is inherent toavgon wind degrees — the apexcharts setup this recipe replaces has exactly the same behavior.
📏 Fixed Value Reference Line
Draw a flat horizontal line at the current value of an entity. Useful for showing targets or limits alongside historical data.
type: custom:statistics-graph-chart-card
entities:
  - entity: sensor.room_temperature
    name: Temperature
    color: "#ff6b35"

  - entity: input_number.target_temperature
    name: Target
    color: "#2ecc71"
    fixed_value: true
    show_fill: false
    line_width: 1.5
〰️ Soft Bounds
Use a ~ prefix to create a soft bound — the axis will prefer the value but expand if data exceeds it. Hard bounds (no prefix) force the axis edge regardless of data.
type: custom:statistics-graph-chart-card
entities:
  - entity: sensor.battery_level
    name: Battery
    lower_bound: "~0"    # prefer 0 as minimum; expands if data goes below
    upper_bound: "~100"  # prefer 100 as max; expands if data exceeds
📡 Dynamic Y Axis Bounds
Bind the Y axis min/max to another entity for a fully dynamic range — a sensor, or a helper you can turn from the dashboard.
type: custom:statistics-graph-chart-card
entities:
  - entity: sensor.power_output
    name: Power
    lower_bound: 0
    upper_bound: sensor.max_capacity
Use an input_number when you want a slider that stretches the axis, and an input_select when you want named presets. Both work card-level too, and min_bound_range accepts the same reference:
type: custom:statistics-graph-chart-card
lower_bound: "~input_number.chart_floor"   # soft: data below still expands the axis
upper_bound: input_select.chart_ceiling    # Auto / 50 / 100 / 200
min_bound_range: input_number.chart_min_span
entities:
  - entity: sensor.power_output
Move the slider or pick a preset and the chart rescales at once — on this card and on every other card pointing at the same helper. Pick the input_select's Auto option (any value that isn't a number) and that edge goes back to auto-scale.
👆 Tap Actions
Trigger actions when tapping an entity's state row.
type: custom:statistics-graph-chart-card
entities:
  # Open entity detail dialog
  - entity: sensor.temperature
    tap_action:
      action: more-info

  # Navigate to another dashboard
  - entity: sensor.energy
    tap_action:
      action: navigate
      navigation_path: /lovelace/energy

  # Call a service
  - entity: binary_sensor.pump
    tap_action:
      action: call-service
      service: switch.toggle
      service_data:
        entity_id: switch.pump

  # Fire DOM event (browser_mod popup, YAML only)
  - entity: sensor.power
    tap_action:
      action: fire-dom-event
      browser_mod:
        service: browser_mod.popup
        data:
          content:
            type: custom:mini-graph-card
            entity: sensor.power
🌅 Dynamic Graph Hours
Filter data to specific hours each day using sensor values. Ideal for solar panels (sunrise to sunset) or business hours.
type: custom:statistics-graph-chart-card
graph_start_hour: sensor.sunrise_hour
graph_end_hour: sensor.sunset_hour
hours_to_show: 168
show_date_picker: true
entities:
  - entity: sensor.solar_power
Create template sensors that output fractional hours:
template:
  - sensor:
      - name: "Sunrise Hour"
        unique_id: sunrise_hour
        state: >
          {% set dt = state_attr('sun.sun', 'next_rising') | as_datetime | as_local %}
          {{ dt.hour + dt.minute / 60 }}
      - name: "Sunset Hour"
        unique_id: sunset_hour
        state: >
          {% set dt = state_attr('sun.sun', 'next_setting') | as_datetime | as_local %}
          {{ dt.hour + dt.minute / 60 }}
When viewing multiple days, data outside the specified hours is hidden and lines break naturally between days. Both graph_start_hour and graph_end_hour accept fixed numbers (6, 22, 6.5 for 06:30) or entity IDs.
⏩ Sparse Data with Points Per Hour
For sensors that update infrequently (e.g. weather), use a higher points_per_hour with forward-fill. Empty buckets inherit the last known value, producing a clean step-line instead of scattered dots.
type: custom:statistics-graph-chart-card
points_per_hour: 12
hours_to_show: 24
entities:
  - entity: weather.home
    attribute: humidity
    name: Humidity
    smooth: false  # step-like appearance is more accurate for infrequent updates
🎚️ Interval Picker & Attribute Switcher
Add on-card controls for quick time range switching and live attribute exploration — no need to open the editor.
type: custom:statistics-graph-chart-card
card_header: Weather Station
hours_to_show: 24
show_interval_picker: true
interval_picker_position: left
show_attribute_list: true
attribute_list_position: right
entities:
  - entity: weather.home
    name: Temperature
    attribute: temperature
    color: "#ff6b35"

  - entity: weather.home
    name: Humidity
    attribute: humidity
    color: "#00bcd4"
The interval picker displays buttons for the default set: 1H, 2H, 4H, 8H, 12H, 24H, and 7D. Clicking a button temporarily overrides hours_to_show; clicking again deselects it and returns to the original range.
To customize which buttons appear, use interval_options:
# Show only the intervals you need — fits on one row on mobile
show_interval_picker: true
interval_options:
  - "2H"
  - "12H"
  - "24H"
  - "7D"
  - "30D"
Available labels: 1H, 2H, 4H, 8H, 12H, 24H, 3D, 7D, 14D, 30D, 90D, 6M, 1Y. The editor also provides a Visible Intervals checkbox grid under the Interval Picker toggle (General Settings → Overlays).
To always open on one of those buttons, set default_interval:
show_interval_picker: true
hours_to_show: 24
default_interval: "12H"
Without it the card remembers the last button you pressed on that card and restores it after a reload. With it, that button is selected on every load — you can still click your way to another range, and the next reload returns to default_interval. The editor offers the same list as Default Interval, directly under the Visible Intervals grid, with Auto for the remembered behaviour.
If the range on screen is not one of the visible buttons — hours_to_show: 36, or a default_interval you left out of interval_options — the picker adds a button for it (36H), sorted into place, and shows it as the selected one. The bar never opens with nothing highlighted.
The attribute list shows a dropdown per entity with a color-coded dot. Select any numeric attribute to instantly re-graph with that data — the graph, state row, and tooltip all update live.
Both controls share a single toolbar row and wrap automatically on narrow cards.
🔍 Scrollable Graph
Load a wide time range but show only a portion at a time — scroll to explore.
type: custom:statistics-graph-chart-card
card_header: Weekly Overview
hours_to_show: 168        # 7 days of data
max_visible_interval: 24  # show 24h at a time
scroll_mode: wheel         # or: scrollbar
entities:
  - entity: sensor.temperature
    color: "#ff6b35"
The graph starts scrolled to the right (most recent data). Y-axis labels stay fixed while the graph content scrolls underneath. Scroll position is preserved across HA state updates.
scroll_mode |
Behavior |
|---|---|
scrollbar |
Thin visible scrollbar (default) |
wheel |
Mouse wheel scrolls horizontally, no visible scrollbar |
On mobile/touch devices, swipe always works regardless of the scroll mode setting.
💡 Combines well with the Interval Picker — select "7D" to get a wide range, then scroll through it with a 6-hour visible window.
↔️ Icon Position
Place the header icon on the right side for a different layout feel.
type: custom:statistics-graph-chart-card
card_header: Living Room
card_icon: mdi:thermometer
card_icon_position: right   # default: left
entities:
  - entity: sensor.temperature
    color: "#ff6b35"
🏆 Full Example
A complete card showing most features together.
type: custom:statistics-graph-chart-card
card_header: Home Climate
card_icon: mdi:home-thermometer
card_icon_color: "#ff6b35"
align_header: left
hours_to_show: 24
points_per_hour: 6
height: 180
show_grid: true
show_tooltip: true
animate_graph: false
update_interval: 60

entities:
  - entity: sensor.living_temperature
    name: Temperature
    color: "#ff6b35"
    icon: mdi:thermometer
    y_axis: primary
    show_in_legend: true
    show_extrema: click
    show_average: true
    decimals: 1
    gradient: true
    state_adaptive_color: true
    color_thresholds:
      enabled: true
      transition: smooth
      values:
        - value: 18
          color: "#3498db"
        - value: 22
          color: "#2ecc71"
        - value: 28
          color: "#e74c3c"

  - entity: sensor.living_humidity
    name: Humidity
    color: "#00bcd4"
    icon: mdi:water-percent
    y_axis: secondary
    show_in_legend: true
    decimals: 0
    lower_bound: "~0"
    upper_bound: "~100"
🎨 CSS Styling with card_mod
For users who want to go beyond the built-in styling options, the card exposes a rich set of CSS class names that can be targeted with card-mod. This is useful for theme integration, per-card overrides, or visual tweaks that aren't available as configuration options (e.g. animated transitions, custom shadows, gradient backgrounds, repeating-pattern overlays).
Reliability note (v3.32): card-mod styles used to disappear on a page reload (F5) or app restart and only come back after re-saving the card — a race between card-mod's style injection and the card's first build (#268). Fixed: injected styles now survive the card's initial build and every later re-render. If you style the same property both ways — e.g.
card_background_color:in the config and anha-card { background: ... }in card-mod — the built-in option wins, because it is applied as an inline style; pick one, or add!importantto the card-mod rule.
Without card-mod: the styles option (v4.05)
styles takes plain CSS and applies it inside the card — same class names, no card-mod install, no shadow-root juggling:
type: custom:statistics-graph-chart-card
entities:
  - entity: sensor.power
styles: |
  .sgc-state-name { font-weight: 400; }
  .sgc-state-value,
  .sgc-state-unit,
  .sgc-state-second { font-weight: 500; }
  ha-card { box-shadow: 0 2px 8px rgba(0, 0, 0, 0.04); }
The sheet survives re-renders and visual-editor saves, and the editor has a Custom CSS field under Card Settings → Card Styling. Two things to know:
- Card options win. Anything you set as a card option (
card_background_color,card_border_*,card_padding,card_shadow,card_header_color…) is applied inline, so astylesrule for the same property needs!important— exactly as with card-mod. - card-mod still works next to it and wins ties, so existing
card_mod:blocks keep behaving;stylesis for the rules you no longer want to depend on card-mod for. The CSS is static (no{{ }}templates) and cannot reach outside the card.
Show CSS class reference and examples
Setup
Install card-mod from HACS first. Then add a card_mod: block to any card config:
type: custom:statistics-graph-chart-card
entities:
  - entity: sensor.power
card_mod:
  style: |
    .sgc-plot {
      background: rgba(0, 0, 0, 0.1);
    }
CSS class reference
| Class | Where it appears | What it covers |
|---|---|---|
| Container | ||
.sgc-card |
Root | Outermost card wrapper. Most card-mod overrides target this. |
.sgc-header |
Top of card | Title + icon + battery row. |
.sgc-title |
Header | Title text element (wrapped in .sgc-title-wrap, which also carries .pos-left / .pos-center / .pos-right). |
.sgc-header-icon |
Header | MDI / image icon next to the title. |
.sgc-battery-icon |
Header | Battery indicator. |
.sgc-state-rows |
Above/below graph | Wrapper for all state rows. |
.sgc-state-row |
Per entity | One row with name + value + dot. |
.sgc-state-color |
Per entity | The colored dot. |
.sgc-state-name |
Per entity | Entity name text. |
.sgc-state-value |
Per entity | Primary value text. |
.sgc-state-unit |
Per entity | Unit suffix. |
.sgc-state-icon |
Per entity | MDI icon in the state row. |
.sgc-state-second |
Per entity | Secondary value next to primary. |
.sgc-state-timestamp |
Per entity | Timestamp suffix for record values. |
.sgc-state-range |
Per entity | (min → max) suffix. |
| Graph area | ||
.sgc-plot |
Chart container | The SVG/canvas plot region. Target this for chart backgrounds. |
.sgc-plot-wrap |
Outer wrapper | Wraps .sgc-plot and handles scrolling. |
.sgc-svg |
Main SVG | All vector chart elements live here. |
.sgc-x-axis / .sgc-y-axis |
Axes | Axis <g> groups. Both the primary and the secondary (right) Y axis use .sgc-y-axis — there is no separate y2 class; the sticky secondary group additionally gets .sgc-y-axis-sticky. |
.sgc-axis-label / .sgc-axis-tick |
Axes | Individual tick labels and tick marks; further qualified by .sgc-x-label / .sgc-y-label and .sgc-x-tick / .sgc-y-tick (date labels also get .sgc-x-date-label). |
.sgc-grid |
Grid lines | The <g> wrapping all grid lines. To style the lines themselves target .sgc-grid-line, or .sgc-y-grid-line / .sgc-x-grid-line for one direction only. |
.sgc-now-line |
Now indicator | Vertical "now" line. |
| Tooltip | ||
.sgc-tooltip |
Hover tooltip | The floating box that follows the cursor (Timeline / Scatter). |
.sgc-pie-tooltip |
Hover tooltip | Tooltip for Pie / Ranking / Radial Bar / Polar Area / Radar / Heatmap / Calendar. |
.sgc-tt-time |
Tooltip header | Timestamp at the top of the tooltip. |
.sgc-tt-row |
Tooltip row | One row inside the tooltip. |
.sgc-tt-name / .sgc-tt-val / .sgc-tt-swatch |
Tooltip cells | Name, value, color swatch in the tooltip. |
.sgc-pie-tt-row / .sgc-pie-tt-dot / .sgc-pie-tt-name / .sgc-pie-tt-val |
Pie tooltip | Same parts for the canvas-chart tooltip. |
| Legend | ||
.sgc-legend |
Compact legend | Inline color-key under the graph (inside .sgc-legend-wrap; also carries .position-left / .position-center / .position-right). |
.sgc-legend-item |
Per entry | One legend item (swatch + name); gets .hidden when the series is toggled off. |
.sgc-legend-swatch |
Per entry | The colored swatch. |
.sgc-detail-legend |
Detail legend | Grid container for the per-entity stats legend (inside .sgc-detail-legend-wrap). |
.sgc-detail-legend-entity |
Detail legend | One entity block in the per-entity stats legend; gets .legend-hidden when the series is toggled off. Its parts are .sgc-detail-legend-name and .sgc-detail-legend-stats (the legend_stats values). |
| Mode-specific | ||
.sgc-stl-cell |
State Timeline | One state segment in the timeline. Round corners, color, or per-state styling go here. |
.sgc-extrema |
Min/Max labels | The <g> holding all floating Min/Max value labels on bars / data points. |
.sgc-ann-label |
Annotations | Every annotation caption, further qualified by .sgc-ann-threshold-label, .sgc-ann-band-label, .sgc-ann-span-label, .sgc-ann-event-label. Useful because label opacity is derived from the annotation's opacity — target these classes (or use label_opacity) to override it. |
.sgc-ann-threshold / .sgc-ann-band / .sgc-ann-span / .sgc-ann-event |
Annotations | The annotation shapes themselves, drawn into .sgc-annotations-bg / .sgc-annotations-fg. |
.sgc-dp-wrap / .sgc-dp-bar |
Date picker bar | .sgc-dp-wrap is the slot in the card; .sgc-dp-bar is the bar itself (variants .dp-centered, .dp-center-stacked). Inner parts include .sgc-dp-nav, .sgc-dp-label, .sgc-dp-modes, .sgc-dp-preset, .sgc-dp-panel. |
.sgc-ip-wrap / .sgc-ip / .sgc-ip-btn |
Interval picker | .sgc-ip-wrap is the slot, .sgc-ip the row (with .align-left / .align-center / .align-right), .sgc-ip-btn each quick-select button (.active on the selected one). |
Example: Tooltip with a different background than the card
If the card has a transparent background but you want a solid tooltip:
card_mod:
  style: |
    .sgc-card {
      background: transparent;
      box-shadow: none;
    }
    .sgc-tooltip,
    .sgc-pie-tooltip {
      background: rgba(20, 20, 20, 0.95) !important;
      border: 1px solid rgba(255, 255, 255, 0.1);
      box-shadow: 0 8px 24px rgba(0, 0, 0, 0.4);
      backdrop-filter: blur(8px);
    }
    .sgc-tt-time,
    .sgc-pie-tt-row .sgc-pie-tt-name:first-child {
      color: #4A90D9;
      font-weight: 600;
    }
Example: Vertical dashed-bar background (Unifi-style)
Paint a repeating gradient pattern behind the chart:
card_mod:
  style: |
    .sgc-plot {
      background-image: repeating-linear-gradient(
        to right,
        rgba(255, 255, 255, 0.08) 0px,
        rgba(255, 255, 255, 0.08) 2px,
        transparent 2px,
        transparent 7px
      );
    }
Tweak the stripe width (the 2px value) and spacing (the 7px value) to taste.
Example: Pulse animation on a record-tracking state row
card_mod:
  style: |
    @keyframes sgc-pulse {
      0%, 100% { opacity: 1; }
      50% { opacity: 0.6; }
    }
    .sgc-state-color {
      animation: sgc-pulse 2s ease-in-out infinite;
    }
Example: Theme-aware accent for the header
card_mod:
  style: |
    .sgc-title {
      background: linear-gradient(90deg, var(--primary-color), var(--accent-color));
      -webkit-background-clip: text;
      background-clip: text;
      color: transparent;
    }
Notes
- All classes are stable across releases, but new ones may be added — existing ones won't be renamed without a version bump in the release notes.
- Shadow DOM: card-mod handles it transparently, but if you're using raw CSS without card-mod, you'll need to inject into the right shadow root.
- The
!importantflag is often needed when overriding tooltip / popup styles since the card sets them inline.
📖 Reference
Aggregation functions, date formats, bounds, tap actions
🧮 Aggregation Functions
Controls how raw data points within each time bucket (interval / hour / date / week / month / year) are combined into a single graph value. Set per-entity via aggregate_func.
| Value | Formula | Best for |
|---|---|---|
avg (default) |
Σ(values) ÷ count — the mean of the readings recorded inside the bucket, each reading counting once however long it stayed valid. Buckets built from long-term statistics (windows over 24 hours, calendar groupings, data_source: statistics, a sensor that fell back to statistics) average Home Assistant's period means, which are weighted by time — see Auto-Routing to Long-Term Statistics |
Smooth lines for measurement sensors (temperature, power, humidity) |
min |
Lowest value in the bucket | Coldest temperature, minimum pressure, etc. |
max |
Highest value in the bucket | Peak temperature, max demand |
first |
Value at the start of the bucket (earliest) | Opening price, state at midnight |
last |
Value at the end of the bucket (latest) | Closing price, current state of a slowly-changing sensor |
median |
Middle value when sorted | Noise-resistant center (better than avg for data with outliers) |
sum |
Σ(values) | Totals over already-rate quantities (e.g. €/hour pricing × hours). On long-term statistics (a calendar group_by, or a window beyond the recorder's retention) sum reads Home Assistant's sum/change columns, so it needs a counter (state_class total / total_increasing) — a measurement sensor (W, °C, %) has none, draws nothing, and the legend says so (v4.05); use avg or max, or change on its energy counter |
delta |
max − min | Spread / range — how much the value fluctuated inside the bucket |
change |
Σ of positive step differences | Total accumulated increase over the bucket — ideal for monotonic counters (energy meters, water meters) because counter resets (jumps to zero) are ignored. On long-term statistics a counter is read from Home Assistant's own change column; a sensor without one (state_class: measurement — a history_stats hours counter, an uptime sensor) is read from hourly rows (windows up to a year) and the positive steps between its hourly means are summed, so a daily or weekly reset is ignored (v4.06) |
diff |
last − first — signed net change across the bucket | Values where a decrease is real movement rather than a counter reset: prices, ratios, temperatures, input_numbers. Unlike change, a fall shows as a negative number. Returns nothing for a bucket with fewer than two samples Not for counters that reset (daily energy totals, utility meters): the bucket's first value is the reading carried in from before the reset, so the day after a reset comes out as −(yesterday's closing value) and a pie draws that magnitude — use change there. |
Worked example — 1-hour bucket with values [10, 25, 5, 30, 28] recorded in this order
| Function | Result | How |
|---|---|---|
avg |
19.6 | (10 + 25 + 5 + 30 + 28) / 5 — each reading once, however long it stayed valid |
min |
5 | Smallest |
max |
30 | Largest |
first |
10 | First in time |
last |
28 | Last in time |
median |
25 | Middle of sorted [5, 10, 25, 28, 30] |
sum |
98 | 10 + 25 + 5 + 30 + 28 |
delta |
25 | 30 − 5 (max − min) |
change |
40 | Positive step differences only: (10→25 = +15) + (25→5 ignored) + (5→30 = +25) + (30→28 ignored) = 15 + 25 |
diff |
18 | Signed net change: 28 − 10 (last − first) — note how it differs from change |
Note: change adds up only the positive jumps between consecutive points. If your counter goes 0 → 5 → 3 → 8, the result is 5 + 5 = 10, not 8. The 5 → 3 drop is treated as a reset and ignored, the 3 → 8 rise counts.
When your sensor is a counter (state_class: total_increasing)
Use aggregate_func: change with group_by: date, week, or month. This triggers an additional optimization: the card uses HA's native change field from long-term statistics, which is both faster and more accurate across counter resets than computing from raw history.
entities:
  - entity: sensor.energy_meter
    aggregate_func: change
    graph_type: bar
group_by: date
hours_to_show: 720    # 30 days of daily consumption bars
When your sensor is not a counter (state_class: measurement)
A measurement sensor that climbs and then resets — a history_stats "hours this week" sensor, an uptime counter, a daily runtime helper — has no sum / change columns in long-term statistics, only hourly averages. (v4.06) aggregate_func: change reads the hourly statistics rows for it under a daily, weekly or monthly grouping and adds up only the rises, so the reset is skipped and each bar shows what was added that day:
entities:
  - entity: sensor.uptime_week_tv   # history_stats, resets Monday 00:00
    aggregate_func: change
    graph_type: bar
group_by: date
hours_to_show: 168
Values can differ from a raw-history chart by a few tenths, because statistics rows hold hourly averages rather than the exact midnight reading; add data_source: history to the entity for exact readings within the recorder's retention.
🕐 Date Formats
Set datetime_format at the card level to control how timestamps appear on the X-axis, tooltips, and extrema labels. system follows HA's locale setting. All other formats are applied regardless of locale — useful when your dashboard is shared across regions or when you need a more compact display.
Note: In earlier versions,
datetime_formatwas an entity-level option. It has been promoted to a card-level setting. Entity-level values still work for backward compatibility and override the card setting when present.
Smart X-Axis Labels
When using the default system format, the X-axis automatically adapts to the visible time range. If the graph spans multiple calendar days, midnight ticks (00:00) display the date (e.g. "28 Mar") instead of the time — making it easy to identify day boundaries at a glance. All other ticks show HH:mm as usual. This behavior is inspired by ApexCharts.
When a custom datetime_format is set, all ticks use that format uniformly. (Exception: a weekday-only format such as dddd labels the day boundaries but leaves the intraday clock ticks showing the time — see the note below the table.)
The number of ticks on the X-axis is calculated dynamically based on the label width, which depends on font size (x_axis_font_size) and the chosen format. Shorter formats like HH:mm fit more ticks; longer formats like DD/MM HH:mm produce fewer ticks automatically.
| Value | Example output |
|---|---|
system |
Follows HA locale |
DD/MM |
24/01 |
MM/DD |
01/24 |
DD/MM HH:mm |
24/01 14:35 |
MM/DD HH:mm |
01/24 14:35 |
HH:mm |
14:35 |
DD/MM hh:mm A |
24/01 02:35 PM |
MM/DD hh:mm A |
01/24 02:35 PM |
hh:mm A |
02:35 PM |
YYYY-MM-DD |
2026-01-24 |
YYYY-MM-DD HH:mm |
2026-01-24 14:35 |
YYYY-MM |
2026-01 |
MMM YY |
Jan 26 |
DD MMM YYYY |
24 Jan 2026 |
DD-MM-YYYY |
24-01-2026 |
MM-YYYY |
01-2026 |
ddd |
Mon (Mo / Pzt …) |
dddd |
Monday |
ddd DD MMM |
Mon 24 Jan |
ddd DD/MM |
Mon 24/01 |
Custom patterns can also be written directly in YAML using these tokens: dddd / ddd (full / short weekday name, localized), YYYY / YY (year), MMMM / MMM (full / short month name, localized), MM (month number), DD (day), HH / hh (24h / 12h hour), mm (minute), ss (second), A / a (AM/PM). Month names follow the dashboard language — e.g. MMM YY shows Jan 26 in English and Jan 26 / Jän 26 in German depending on locale.
Weekday names on the X-axis: a format containing
dddorddddalso drives the X-axis date labels on multi-day and "last N days" views — useddddon its own to show just the day name (e.g. Monday). Because day names follow your dashboard language, you get Mon / Mo / Pzt automatically. The intraday clock ticks keep showing the time, so the weekday appears only at the day boundaries, not on every hour tick.
Localization: the card ships with 16 languages — all renderer tooltip labels (Peak, Low, Range, Share, Progress, Level, Count, Change, Altitude), the Scatter and unknown-chart-mode messages are translated, and the Calendar mode's weekday headers and the Box Plot's month names follow the card language automatically.
〰️ Bounds
Both entity-level (lower_bound, upper_bound) and card-level axis options (lower_bound, upper_bound for primary; lower_bound_secondary, upper_bound_secondary for secondary) support four value types:
| Format | Behavior |
|---|---|
0 |
Hard bound — axis edge is fixed at this value regardless of data |
"~0" |
Soft bound — axis prefers this value but expands if data exceeds it |
"input_number.x" |
Dynamic bound — follows the live state of another entity or helper; the chart rescales the moment that helper changes |
"~input_number.x" |
Soft dynamic bound — the helper's value is a preference, not a lock: data beyond it still expands the axis |
Card-level bounds set the baseline for the axis; entity-level bounds can further tighten or extend the range. When both are present, the most restrictive hard bound or the widest soft bound wins.
**Bounds from a helper (new in v4.04):** every bound key —
lower_bound,upper_bound,lower_bound_secondary,upper_bound_secondary,min_bound_range,min_bound_range_secondaryand the per-entitylower_bound/upper_bound— takes an entity ID wherever it takes a number. Point them at aninput_numberfor a slider that stretches the axis from the dashboard, or at aninput_selectfor a set of preset ranges. The rescale is instant and local: every card pointing at that helper redraws together, with no trip back to the database. A state that isn't a number gives the edge back to the card — anAutooption in aninput_select, or a helper that goesunavailable, simply returns that edge to auto-scale, so one preset can mean "let the card decide".
Y Axis Tick Control
Use y_axis_ticks to control how many divisions appear on the Y axis. The axis range is automatically snapped to clean round numbers so labels always look tidy.
type: custom:statistics-graph-chart-card
lower_bound: 40
upper_bound: 100
y_axis_ticks: 6
entities:
  - entity: sensor.cpu_temperature
This produces labels at 40, 50, 60, 70, 80, 90, 100 — similar to setting tickAmount: 6 in Apex Charts or an interval of 10 in Excel.
⚡ Auto Scale Points
When using the interval picker to switch between time ranges (1H → 7D → 90D), the default points_per_hour and group_by can be too dense for long periods or too sparse for short ones. Enable auto_scale_points to let the card pick a sensible bucket size automatically based on the visible window.
type: custom:statistics-graph-chart-card
auto_scale_points: true
show_interval_picker: true
hours_to_show: 24
entities:
  - entity: sensor.power_consumption
  - entity: sensor.solar_production
  - entity: sensor.grid_export
The card chooses both bucket size and group_by from a fixed table, optimized to keep around 100 visible points at every zoom level:
| Visible window | Bucket | One point every |
|---|---|---|
| ≤ 4 hours | interval | 5 min |
| ≤ 12 hours | interval | 15 min |
| ≤ 48 hours | interval | 30 min |
| ≤ 6 days | hour | 1 hour |
| ≤ 59 days | date | 1 day |
| ≤ 180 days | week | 1 week |
| > 180 days | month | 1 month |
The day bands compare on rounded days, so a DST-shortened 167-hour "7 day" window still lands in the daily band instead of dropping back to hourly.
Note: Entity-level
points_per_houroverrides are not affected — only entities inheriting the card-level value are scaled.
Safe fallback for advanced setups. When any entity uses offset, forecast_horizon, data_attribute (attribute-based forecast data) or solar_forecast, Auto-Scale steps aside and keeps your configured points_per_hour and group_by exactly as-is. These features create their own time windows that don't align with automatic re-bucketing, so the card stays out of the way to avoid breaking them.
Custom Scale Rules (auto_scale_rules) (new in v3.26)
Auto Scale can also follow your thresholds instead of the built-in table. Each rule says: when the visible period is up to N hours, use this Group By (and optionally a Points/Hour). Only active when auto_scale_points: true.
type: custom:statistics-graph-chart-card
auto_scale_points: true
auto_scale_rules:
  - up_to_hours: 28        # up to ~a day → hourly buckets
    group_by: hour
  - up_to_hours: 56        # up to ~two days → 2-hour buckets
    group_by: 2h
  - up_to_hours: 8784      # up to a year → monthly buckets
    group_by: month
entities:
  - entity: sensor.power_consumption
| Rule field | Type | Default | Description |
|---|---|---|---|
up_to_hours |
number | required | The rule applies when the visible period is up to this many hours. |
group_by |
string | interval |
Bucketing to use — same values as the main group_by: interval, hour, 2h, 3h, 4h, 6h, 12h (any Nh works, e.g. 5h), date, week, month, year, raw. day is accepted as an alias of date. |
points_per_hour |
number | null |
Optional bucket density for this rule — only meaningful with group_by: interval. The editor offers the standard divisor-of-60 presets. |
x_axis_interval |
string | null |
Optional X-axis tick interval while this rule is active (same syntax as the card-level option, e.g. 4h). YAML only. (v3.29) |
x_axis_datetime_format |
string | null |
Optional X-axis label pattern while this rule is active (same tokens as the card-level option, e.g. MMM on the month rule, ddd DD on the day rule). YAML only. (v3.34) |
datetime_format |
string | null |
Optional date/time format while this rule is active (same patterns as the card-level option, e.g. HH:mm). YAML only. (v3.29) |
Presentation follows the active rule (v3.29): while a rule rescales the chart, the card-level x_axis_interval and datetime_format are suspended — they were tuned for your base scale, and keeping them left a Day view with a near-empty axis and time-less tooltips (#308). Automatic ticks and locale date+time formatting take over, unless the rule provides its own overrides above.
How the rules resolve:
- The smallest matching threshold wins — with the rules above, a 30-hour view matches the
56rule, not the8784one. - Leave a small buffer above nominal periods (the examples use
28for "a day"): a DST fall-back day is 25 hours, andup_to_hours: 24would skip your hourly rule exactly that day. - A rule that mirrors your base scale (same
group_byas the card, nopoints_per_houror presentation overrides) doesn't count as a rescale — your explicit axis settings stay in force on those views. (v3.29) - A period beyond every threshold falls back to the built-in auto-scale table above.
- An empty or absent list means pure built-in behavior — exactly as before.
- Date-picker aware. A full month or year selection matches by its nominal length even while the period is still running — pick a year in July and the
8784rule still applies, exactly like the built-in auto scale. - The same safety guard applies: when any entity uses
offset,forecast_horizon,data_attributeorsolar_forecast, the configuredgroup_byis kept untouched.
Editor: with Auto Scale on, a Custom Scale Rules list appears — an Add Rule button adds rows with Up to (hours), Group By (the same options as the main Group By select), and a Points/Hour dropdown that is enabled only for Interval rules.
📈 Rise/Fall Colors
Colors each graph segment based on its slope relative to the previous point. Unlike color thresholds (which react to absolute values), rise/fall coloring reacts to direction of change — making it easy to spot momentum shifts at a glance. The trend_period_hours setting on the entity controls the smoothing window used to determine whether a segment counts as rising, falling, or stable.
rise_fall_colors:
  enabled: true
  increase: "#2ecc71"   # color when value is rising
  decrease: "#e74c3c"   # color when value is falling
  stable: "#95a5a6"     # color when value is flat
⚠️ Cannot be combined with
color_thresholdson the same entity.
🎨 Color Thresholds
color_thresholds:
  enabled: true
  direction: vertical    # vertical or horizontal
  transition: smooth     # smooth or hard
  values:
    - value: 0           # at or above this value → use this color
      color: "#3498db"
    - value: 20
      color: "#2ecc71"
    - value: 35
      color: "#e74c3c"
Thresholds are sorted by value automatically. The color of the lowest threshold applies to everything below it.
Each value and color also accepts an entity reference — sensor.x (state) or sensor.x.attribute (attribute, nested paths supported) — so thresholds can track live entities and update as those change.
Setting color: threshold, state_color: threshold, icon_color: threshold, or point_colors: threshold on the entity makes those elements also reflect the threshold color.
direction controls which axis the colors are painted along:
vertical(default) — Y-axis gradient. Colors map to value height on the chart.horizontal— per-segment coloring along the time axis. Each segment gets the color of its data value.
transition controls how color changes between bands:
smooth— gradual interpolation as values pass through thresholdshard— instant color switch exactly at the threshold value
⚠️ Cannot be combined with
rise_fall_colorson the same entity.
👆 Tap Actions
| Action | Description |
|---|---|
none |
Do nothing — the tap is ignored. Leave tap_action unset for the default: More Info on chart shapes, state-timeline rows and sparkline rows; the visibility toggle on the state row |
more-info |
Open entity detail dialog |
navigate |
Navigate to a dashboard path (requires navigation_path) |
url |
Open an external URL (requires url) |
call-service |
Call an HA service (requires service and optional service_data) |
🔣 State Map
Maps non-numeric state strings to integer values for graphing. Order determines the number (0-based index). The Y-axis automatically shows the original state names (or optional label) instead of the numeric index.
state_map:
  - value: "off"             # → 0, axis shows "off"
  - value: "idle"            # → 1, axis shows "idle"
  - value: "on"              # → 2, axis shows "on"
With optional friendly labels:
state_map:
  - value: "off"
    label: Stopped           # axis shows "Stopped"
  - value: "on"
    label: Running           # axis shows "Running"
The state row always displays the original string (or label if provided), not the number.
⚠️ State values are case-sensitive and must match exactly what HA reports (always lowercase for
binary_sensor). Auto-detected forbinary_sensor,input_boolean, andinput_selectentities — nostate_mapneeded in step mode.
🛠️ Visual Editor
Editor tabs, drag-and-drop, dynamic behavior
The card ships with a full visual editor — no YAML required. Every option in this documentation is reachable from the Lovelace UI. Changes apply immediately without a page reload.
Chart Settings — Five Tabs
The Chart Settings panel keeps the Chart Mode selector pinned on top and is divided into five tabs to reduce clutter:
| Tab | Contents |
|---|---|
| Chart | Chart mode, graph data (hours to show, points/hour, group by, update interval, visible window, scroll mode) and the visual options (grid, animate, stacked, sparkline, auto scale + custom scale rules, compact legend, auto hide, export button…) |
| X Axis | Labels (date format, font size, opacity, X axis interval), visibility and grid style |
| Y Axis | Labels (custom axis text, ticks, decimals, font), visibility (Y and Y2, logarithmic), grid style and bounds (min range, lower/upper bounds) |
| Overlay | On-card overlays: interval picker, attribute list, tooltip / zoom / scroll sync, battery icon, tooltip settings and annotations |
| Calendar | Date navigation (the built-in date picker: modes, position, sync group, presets), the Energy Date Picker Sync toggle with its inline Key input (v4.02), and the time window (graph start, show full period) |
Card-wide appearance options live in a separate Card Settings panel (since v3.34) with three tabs: Header & Icon (title, size, alignment, color; MDI or image icon, position, size), Card Styling (height, background, border, radius, padding, background image + blur) and Localization (card language, time zone).
Tabs that don't apply to the current chart mode are hidden entirely (see Dynamic Editor Behavior), and settings that depend on a toggle are automatically dimmed while the parent is off — for example, Sync Group is disabled when Tooltip Sync is off.
Entity Configuration — Six Tabs
Each entity panel has six tabs in a 3×2 grid:
| Tab | Contents |
|---|---|
| General | Entity picker, statistic ID, custom name, custom unit, icon and tap action |
| Basic | Data settings: Y axis, aggregation, attribute, decimals, points/hour, number format, custom unit handling |
| Graph | Graph type (line / step / bar / candlestick), hide on load, show in compact legend (v4.07), stacked override (Inherit / On / Off) (v4.07), graph group — chart pages (v4.08), extrema, average line, moving averages, range band, period comparison, break on gaps, line / fill / data points, Y axis range |
| State Row | State visibility and layout, primary state, trend icon, timestamp and name/state positioning |
| Colors | Base colors (line/fill, point, icon, state), rise/fall colors and color thresholds with transition mode |
| Advanced | Advanced calculations (time offset, value transform, value factor, cost view, forecast horizon), state map (+ Share State in State Timeline mode (v4.08)), solar forecast (Energy dashboard) and attribute data source |
Entity options also adapt dynamically based on Chart Mode — see Dynamic Editor Behavior.
Drag and Drop
Entities can be reordered by dragging the grip handle (⠿) on the left side of each entity row. The order determines drawing order on the graph and row order in the state display.
Info Tooltips
Every configuration field has an info tooltip (ⓘ) with a detailed explanation. Hover or tap the icon next to any label to learn what the option does, see practical examples, and understand how it interacts with other settings.
🔄 Dynamic Editor Behavior
The visual editor adapts in real time based on the current configuration. Options that don't apply to the current chart mode are hidden — down to the individual toggle, not just whole tabs. A heading disappears once every field under it is hidden, and a tab disappears once all of its headings are; a single surviving field keeps its tab. If the tab you are on disappears after a chart-mode change, the editor moves you to another tab that is still available.
Hiding never changes your configuration (v3.32). Anything you set in YAML for a hidden option is kept and reappears as soon as you switch back to a chart mode that uses it.
The rule for hiding is deliberately conservative: an option is hidden only where it provably has no effect. Anything that reaches the shared data pipeline, the legend, the state row or the tooltip counts as in use and stays visible everywhere — which is why break_on_null, points_per_hour, invert and the colour thresholds show in every mode even though they are not all "drawing" options.
Chart Mode → General Settings
Changing the Chart Mode dropdown instantly reconfigures the entire editor. The Chart Settings panel is organized into five tabs (Chart, X Axis, Y Axis, Overlay, Calendar) — irrelevant tabs disappear entirely based on the chart mode. Card-wide options live in the separate Card Settings panel (since v3.34).
| When Chart Mode is… | Visible tabs | What's hidden inside |
|---|---|---|
| Timeline | All five tabs | Nothing — full editor |
| Scatter | Chart, X Axis, Y Axis, Overlay, Calendar | Stacked / Sparkline / Animate / Auto Scale (+ Custom Scale Rules) / Visible Window + Scroll Mode / Extended Window hidden in Chart. In X Axis the label options stay (X Label Size / Opacity / Color) — what goes is X Ticks, Date Label Color, X Axis Interval, Bar Spacing and the whole Grid block. In Y Axis the bounds, the Y2-Axis and Y Ticks toggles, Round Ticks, the grid block, Y Axis Format (number format) and Logarithmic go — the label, tick-count, decimals and tick-format options stay. |
| Pie / Ranking / Polar Area / Radial Bar / Radar | Chart, Overlay, Calendar | X Axis and Y Axis tabs gone. Chart keeps only the mode-relevant blocks (Pie block for pie, Ranking's Min / Max Value, …). Overlay keeps the interval picker, attribute list, points/hour picker, group-by picker, tooltip and battery blocks. |
| Gauge / Box Plot / Waterfall / Histogram | Chart, Overlay, Calendar | X Axis and Y Axis tabs gone — these modes read no axis settings at all. Gauge adds its own block in Chart; Histogram its Bins; Waterfall its Total. |
| Heatmap / Calendar | All five tabs | The Y Axis tab keeps only the label and format options — bounds, ticks, grid, number format and Logarithmic go. |
| State Timeline | Chart, X Axis, Overlay, Calendar | Y Axis tab gone (no Y values). The X Axis tab shows label options only — size, opacity, color, and date color. |
| Sparkline mode | Chart | Everything else gone — sparkline is chrome-free. In the separate Card Settings panel, only Card Styling and Localization remain. |
Chart Mode → Entity Settings
Each entity's expanded settings are organized into six tabs in a 3×2 grid: General, Graph, Basic, State Row, Colors, Advanced. Switching the chart mode reshapes the visible options.
Below is the complete list of entity options that are mode-restricted. Anything not in this table is visible in every chart mode — including Aggregate Function, Attribute, Points/Hour, Decimals, Number Format, Break on Gaps, Y Axis (Primary/Secondary), Invert, Value Factor, Value Transform, Fixed Value, State Map, Offset, Forecast Horizon, Colour Thresholds, the rest of the State Row block and the whole Legend block.
| Option | Tab | Visible in… |
|---|---|---|
| Graph Type, Line Width, Show Line, Line Style, Bezier (Smooth), Data Points, Point Size, Show Extrema (+ min/max, timestamp, colour, font size, background), Range Band, Show Average, Moving Averages, Data Labels, Z-Index, Rise/Fall Colors | Graph / Colors | Timeline |
| Period Comparison | Graph | Timeline & State Timeline |
| Stacked (Inherit / On / Off) (v4.07) | Graph | Timeline |
| Stack Group | Graph | Timeline, and only while the entity is stacked — the card's Stacked toggle on, or the entity's Stacked dropdown set to On |
| Show Fill | Colors | Timeline, Radar |
| Point Color | Colors | Timeline, Scatter, Radar |
| Gradient | Colors | Timeline, Ranking, Radar, Gauge |
| Y Axis Range (Lower / Upper Bound) | Graph | Timeline, Scatter, Radial Bar, Radar, Heatmap, Calendar, Gauge |
| Tooltip Name | General | Timeline, Pie, Ranking, Radial Bar, Polar Area, Radar, Gauge |
| Needle Color | Colors | Gauge |
| Share State (v4.08) | Advanced | State Timeline |
| Trend Icon (+ period, size, up/down/stable colours) | State Row | All modes except State Timeline |
Three corrections landed here in 3.32. Invert (Mirror) was documented as Timeline-only; it has always worked in every mode and is now shown in every mode. Colour Thresholds used to be hidden in Pie, Box Plot, Waterfall, Histogram and State Timeline even though they colour the legend, the state row and the tooltip there — they are now shown everywhere. Y Axis (Primary/Secondary) also stays visible everywhere: besides choosing an axis it selects which of
y_axis_format/y2_axis_formatformats that entity's numbers, and that applies in every chart mode.
Sparkline → Entire Card
When sparkline is enabled (Timeline mode only):
- Card Settings panel: the Header & Icon tab disappears; Card Styling and Localization remain
- Overlay tab: Hidden entirely — overlays don't render in sparkline mode
- X Axis / Y Axis / Calendar tabs: Hidden entirely
- The card renders with zero chrome — no toolbar, axes, grid, or legend
Entity-Level Cascading
Within each entity, toggle states cascade downward — disabling a parent hides or disables all its children:
| When this is… | These become hidden / disabled |
|---|---|
show_graph: off |
The Graph block is marked locked (dashed border, 65% opacity) and its contents — Stack Group, Graph Group (v4.08), Show Average, Break on Gaps, Data Labels — are dimmed and disabled. Graph Type, Z-Index, Extrema, Line, Range Band, Data Points and Fill are separate blocks with their own master switches and are not affected |
show_line: off |
Line Width, Bezier, Line Style — disabled |
show_fill: off |
Gradient — disabled |
show_state: off |
Show Last, Adaptive Color, Icon, Align, all Size fields — disabled |
show_trend_icon: off |
Trend Period, Icon Size and the three trend colors — disabled |
Entity Count Limits
The "Add Entity" button automatically hides when the chart mode's limit is reached:
| Chart Mode | Max Entities | Notes |
|---|---|---|
| Timeline | Unlimited | Mix line, step, bar freely |
| Scatter | 2 | Entities labeled X and Y in the editor |
| Pie / Ranking | Unlimited | Each entity = one slice / bar |
| Radial Bar | Unlimited | Each entity = one concentric ring |
| Polar Area | Unlimited | Each entity = one equal-angle slice |
| Radar | 3+ minimum | Each entity = one spoke of the polygon |
| Heatmap / Calendar | 1 | Only the first entity is used |
Option Interactions
Some options depend on or conflict with each other:
| If you set… | Then… |
|---|---|
value_transform set |
Runs after value_factor. Available variables: x, first, last, min, max, avg, index, plus t, now, hour, weekday (v4.04). Returning null leaves a visible gap. State row shows the transformed value |
offset set (per entity) |
Data is fetched from a shifted time window but displayed aligned with the current window. Same entity with different offsets = period comparison at full graph quality |
stacked: true |
Only affects entities with the same y_axis and graph_type. An entity with its own stacked: false stays out of every stack, and stacked: true on an entity stacks it even while the card toggle is off (v4.07) |
auto_scale_points: true |
Only scales entities that inherit the card-level points_per_hour — entity-level overrides are not affected |
auto_scale_rules set |
Only consulted when auto_scale_points: true. The smallest matching up_to_hours threshold wins; periods beyond every threshold use the built-in auto-scale table |
color_thresholds enabled |
Cannot combine with rise_fall_colors on the same entity |
show_state: gauge |
Uses entity lower_bound / upper_bound as gauge min/max; falls back to stats if not set |
chart_mode: heatmap + color_thresholds |
Heatmap cells use threshold colors instead of single-color opacity gradient |
sparkline: true |
Only works in Timeline mode; ignored in other chart modes |
max_visible_interval set |
Enables scroll; scroll_mode controls whether scrollbar is visible or mouse-wheel only |
show_y_axis: false |
Hides primary (left) axis labels; secondary axis is not affected |
show_y2_axis: false |
Hides secondary (right) axis labels; primary axis is not affected. Right padding shrinks. |
show_legend: true |
Compact Legend appears below graph. Combine with show_state: false on entities for maximum graph space |
legend_stats |
Only takes effect when entity show_in_legend is true. Any combination of min, avg, max, last, sum, live |
align_state: bottom-* |
State row renders below the graph instead of above. Can be mixed — some entities top, some bottom |
show_range_band: true |
Only visible in Timeline mode with line/step entities. Band is drawn behind the normal line and fill. Tooltip adds a min → max row |
chart_mode: radialbar |
Uses lower_bound / upper_bound per entity to define the 0–100% ring fill. Falls back to stats min/max if not set |
chart_mode: radar |
Requires at least 3 entities. Uses lower_bound / upper_bound per entity for normalization |
energy_date_sync: true |
Card time range follows the Energy dashboard date picker. When viewing today, X axis ends at the current time and live updates continue. When viewing a past date, live updates are paused. Overrides hours_to_show while active |
statistic_id set (with empty entity) |
Data is fetched from the statistics database only — no History API call. State row shows last statistics value. WebSocket live updates are skipped for this entity |
solar_forecast: true (per entity) (v4.07) |
The row draws the Energy dashboard's solar forecast and entity may stay empty: the Entity picker is marked optional, the row header shows a Forecast badge, Aggregation shows Sum and the Unit field hints kWh, and the Forecast Source dropdown lists the dashboard's solar sources that have a forecast once they are loaded (one disabled entry when the Energy dashboard is not configured). Switching the toggle off removes both options from the YAML |
color: "{{ ... }}" |
Template is evaluated by Home Assistant itself and the card updates instantly whenever the result changes — no polling. Editor color picker dims automatically. Falls back to the raw template string if resolution fails |
graph_start: tomorrow |
Window is tomorrow 00:00 → end of day. show_full_period is not required. History fetch is skipped (no past data in tomorrow's range). Ideal with data_attribute for forecast/spot price data |
y_grid_style / x_grid_style |
Only effective when show_grid: true. Applies inline SVG styles that override the default CSS class |
decimals on pie/radial entity |
Controls both value precision and percentage precision in slice labels, tooltips, and center totals |
compare set (per entity) |
A faded, dashed ghost of the previous period is drawn under the main series and follows the exact same aggregation pipeline — a list of comparisons draws one ghost per entry, each reaching further back via periods_back. On State Timeline charts each comparison renders as its own labelled row under the main entity (v4.02), and layout: sequential draws a previous_period ghost at its real position on a backward-extended axis (v4.02). Legend / state-row clicks toggle main + ghosts together. Ignored for candlestick, fixed_value, and data_attribute entities and in sparkline mode |
show_legend: "{{ ... }}" (or any templatable toggle) |
Template is resolved server-side like color templates and updates live; the default applies until the first result arrives. The editor locks the checkbox — dimmed, with a {…} badge and a tooltip showing the template — and never overwrites it |
aggregate_func: max (per entity) |
A Damp midnight reset artifacts checkbox appears under the Aggregation dropdown in the editor — the UI switch for damp_reset_boundary, shown only while the aggregate is max |
aggregate_func: change (per entity) |
An Ignore transient zeros checkbox appears under the Aggregation dropdown — the UI switch for change_ignore_zero, shown only while the aggregate is change |
⭐ Support
If you like this card, feel free to ⭐ star the project on GitHub and share it with the Home Assistant community or
Explore related projects
Asabeneh/30-Days-Of-Python
The 30 Days of Python programming challenge is a step-by-step guide to learn the Python programming language in 30 days. This challenge may take more than 100 days. Follow your own pace. These videos may help too: https://www.youtube.com/channel/UC7PNRuno1rzYPb1xLa4yktw
78,423 starsgrafana/grafana
The open and composable observability and data visualization platform. Visualize metrics, logs, and traces from multiple sources like Prometheus, Loki, Elasticsearch, InfluxDB, Postgres and many more.
77,790 starsredis/redis
For developers, who are building real-time data-driven applications, Redis is the preferred, fastest, and most feature-rich cache, data structure server, and document and vector query engine.
77,309 starsapache/superset
Apache Superset is a Data Visualization and Data Exploration Platform
75,455 stars