
bradleyjkemp/memviz
bradleyjkemp/memviz has 1,289 GitHub stars and 51 forks. GitHot measured -1 stars in 24 hours. Last checked 2026-11-09 06:57 UTC. Last push 2021-04-29.
Visualize your Go data structures using graphviz
Measured star growth
- in 24h
- -1
- in 7 days
- Collecting history
- in 15 days
- Collecting history
- in 1 month
- Collecting history
Net star changes over overlapping periods, not daily totals. Missing measurements are left blank. Stars measure attention, not software quality.
README.md
Originalmemviz 


How would you rather debug a data structure?
| "Pretty" printed | Visual graph |
(*test.fib)(0xc04204a5a0)({
 index: (int) 5,
 prev: (*test.fib)(0xc04204a580)({
  index: (int) 4,
  prev: (*test.fib)(0xc04204a560)({
   index: (int) 3,
   prev: (*test.fib)(0xc04204a540)({
    index: (int) 2,
    prev: (*test.fib)(0xc04204a520)({
     index: (int) 1,
     prev: (*test.fib)(0xc04204a500)({
      index: (int) 0,
      prev: (*test.fib)(),
      prevprev: (*test.fib)()
     }),
     prevprev: (*test.fib)()
    }),
    prevprev: (*test.fib)(0xc04204a500)({
     index: (int) 0,
     prev: (*test.fib)(),
     prevprev: (*test.fib)()
    })
   }),
   .
   .
   .
|
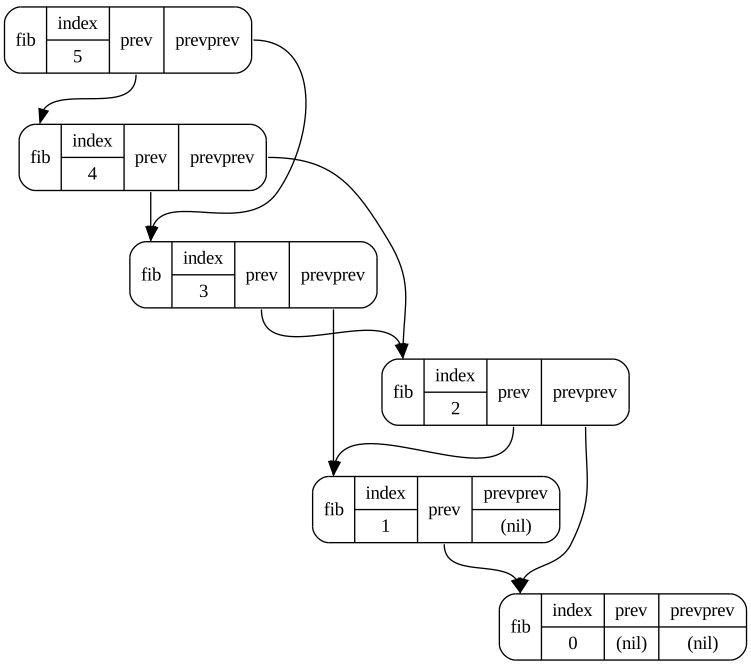 |
Usage
memviz takes a pointer to an arbitrary data structure and generates output that can be used to generate an easy to
understand diagram using graphviz.
To generate a diagram, first you will need to install graphviz on your system following the instructions here.
Next, use memviz.Map(out, &data) to generate a graphviz dot file and
then pipe the output into graphviz.
For examples of how to use memviz, see the code sample in the example
folder and the tests in memviz_test.go.
Explore related projects
codecrafters-io/build-your-own-x
Master programming by recreating your favorite technologies from scratch.
561,168 starspublic-apis/public-apis
A collective list of free APIs
497,378 starsmorluto/rea
Reverse engineer anything with agents, from app behavior down to native binaries.
444,731 starsopenclaw/openclaw
The AI that really does things. Any OS. Any Platform. The lobster way. 🦞
394,222 stars