
bfritscher/typesense-dashboard
bfritscher/typesense-dashboard has 659 GitHub stars and 133 forks. GitHot measured 0 stars in 24 hours. Last checked 2026-11-15 23:44 UTC. Last push 2026-07-22.
Measured star growth
- in 24h
- 0
- in 7 days
- Update delayed
- in 15 days
- Update delayed
- in 1 month
- Update delayed
Net star changes over overlapping periods, not daily totals. Missing measurements are left blank. Stars measure attention, not software quality.
About
A Typesense Dashboard to manage and browse collections.
Developer ToolsREADME.md
OriginalTypesense Dashboard (typesense-dashboard)
A Typesense Dashboard to manage and browse collections.
A side project to test the Typesense API and Quasar with electron.
Usage
Web
As a web application, only typesense server started with --enable-cors will work.
Use https://bfritscher.github.io/typesense-dashboard/ or build and install on your own server
Limitation
When using in your browser from an https address your server must also be behind SSL. Or you will get a MixedContent Network Error. (You might allow mix content in your browser, but this is not recommended).
Docker
self-host this dashboard with docker* (web version has some limitations import/export size of files)
use environment variable PUBLIC_PATH if you need something else than /
Example usage:
$ docker build -t typesense-dashboard .
$ docker run -d -p 80:80 typesense-dashboard
caddy is used for serving the actual files.
One could also copy /srv from the final Docker Image into another:
FROM alpine
COPY --from=typesense-dashboard /srv /typesense-dashboard
To build and serve from a subfolder /example (must start with /)
docker build --build-arg=PUBLIC_PATH=/example -t typesense-dashboard .
You can also use the pre-built docker image for example like this:
docker run -d -p 80:80 ghcr.io/bfritscher/typesense-dashboard:latest
Development proxy (/api)
When running npm run dev, you can optionally proxy /api to a remote Typesense server to avoid CORS issues during local development.
Set DEV_API_PROXY_TARGET to the remote origin (protocol + host + optional port). The dev server will forward /api/* to the target and strip the /api prefix.
PowerShell example:
$env:DEV_API_PROXY_TARGET = "https://my-typesense.example.com"; npm run dev
Configuration
Multiple settings are available to configure the dashboard behaviour: autologin, UI options, bookmarks (via history) and cluster tagging.
The application looks for the configuration in /config.json on initial page load. There are two ways to provide this file when running in Docker:
- volume mount a
config.jsonfile to/srv/config.jsonin the container - set environment variable
TYPESENSE_DASHBOARD_CONFIGcontaining the configuration JSON file in base64 encoded format (the container will generateconfig.jsonat startup)
docker run -d -p 80:80 -v /path/to/config.json:/srv/config.json typesense-dashboard
docker run -d -p 80:80 -e TYPESENSE_DASHBOARD_CONFIG=$(base64 -w 0 /path/to/config.json) typesense-dashboard
Sample config.json (same data as saved in localStorage of the browser). A sample configuration file is available at config.json.sample in the project root.
Special host mode: SAME
For the web version, you can set node.host to "SAME" to connect to a Typesense node on the same hostname as the dashboard is being served from.
When host is "SAME", the dashboard resolves:
hostfromwindow.location.hostnameprotocolfromwindow.location.protocol(http/https)portfromwindow.location.port(or80/443if not present)
This is useful when you reverse-proxy the dashboard and Typesense under the same domain.
Example:
{
  "node": {
    "host": "SAME",
    "path": "/api"
  }
}
{
  "apiKey": "xyz",
  "node": {
    "host": "somehost",
    "port": "443",
    "protocol": "https",
    "path": "",
    "tls": true
  },
  "ui": {
    "hideProjectInfo": false
  },
  "history": [
    {
      "apiKey": "abc",
      "node": {
        "host": "anotherhost",
        "port": "80",
        "protocol": "http",
        "path": "",
        "tls": false
      }
    },
    {
      "apiKey": "def",
      "node": {
        "host": "yetanotherhost",
        "port": "8080",
        "protocol": "http",
        "path": "",
        "tls": true
      },
      "clusterTag": "dev-cluster"
    }
  ]
}
The history is used to populate the client history to act as bookmarks.
UI Configuration
The ui section allows you to customize the dashboard interface:
hideProjectInfo: Set totrueto hide the project information section (version, GitHub link, and issue tracker) from the navigation menu. Default isfalse.
Cluster Status
The Cluster Status page lets you see multiple Typesense nodes side-by-side and poll their status in parallel. Each node card shows:
- Node URL and version
- Role with emphasis (Leader/Follower)
- Memory and Disk usage
- Typesense memory metrics (eg, typesense_* metrics)
- System Network Rx/Tx
- Stats (if enabled on the node)
How it works:
- The navigation entry for Cluster Status appears only when the currently connected node belongs to a cluster.
- Nodes are associated to a cluster using an optional
clusterTagfield embedded in each login history entry. - Nodes are displayed in a stable order (host, then port, then protocol), and the current node is highlighted. You can switch to another node directly from its card.
Ways to define clusters:
- In the UI: tag any saved server entry (from the server history popover) with a text tag. The tag input autocompletes existing tags and accepts new values.
- In
config.json: pre-populate history entries with an optionalclusterTagto group them. If a history entry omitsclusterTag, it is not part of any cluster. The Cluster Status page is shown only when the currently connected node has aclusterTag.
Desktop
With the desktop application everything except instant search will work without cors. To export or import large json or jsonl files, desktop version is required, because the browser version times out.
Download from the release page or build your own.
Linux
App cannot be started by clicking on it, on Nautilus*
Make it executable and then you can run it from command line.
./'Typesense-Dashboard'
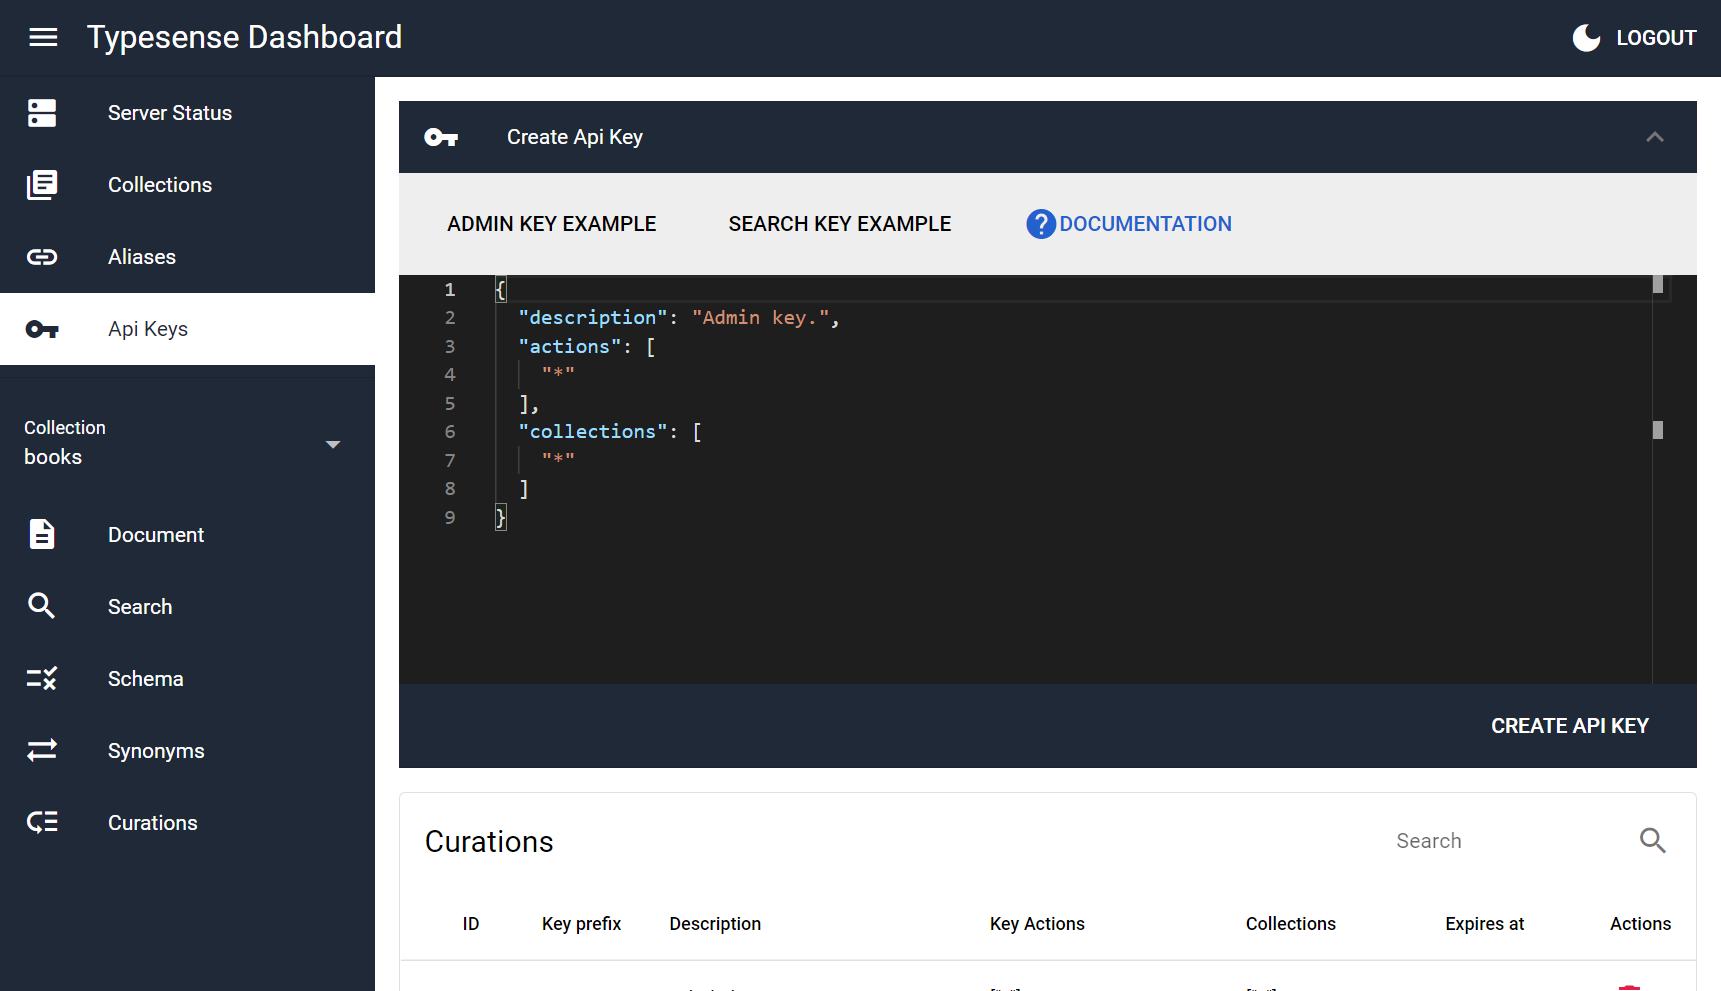
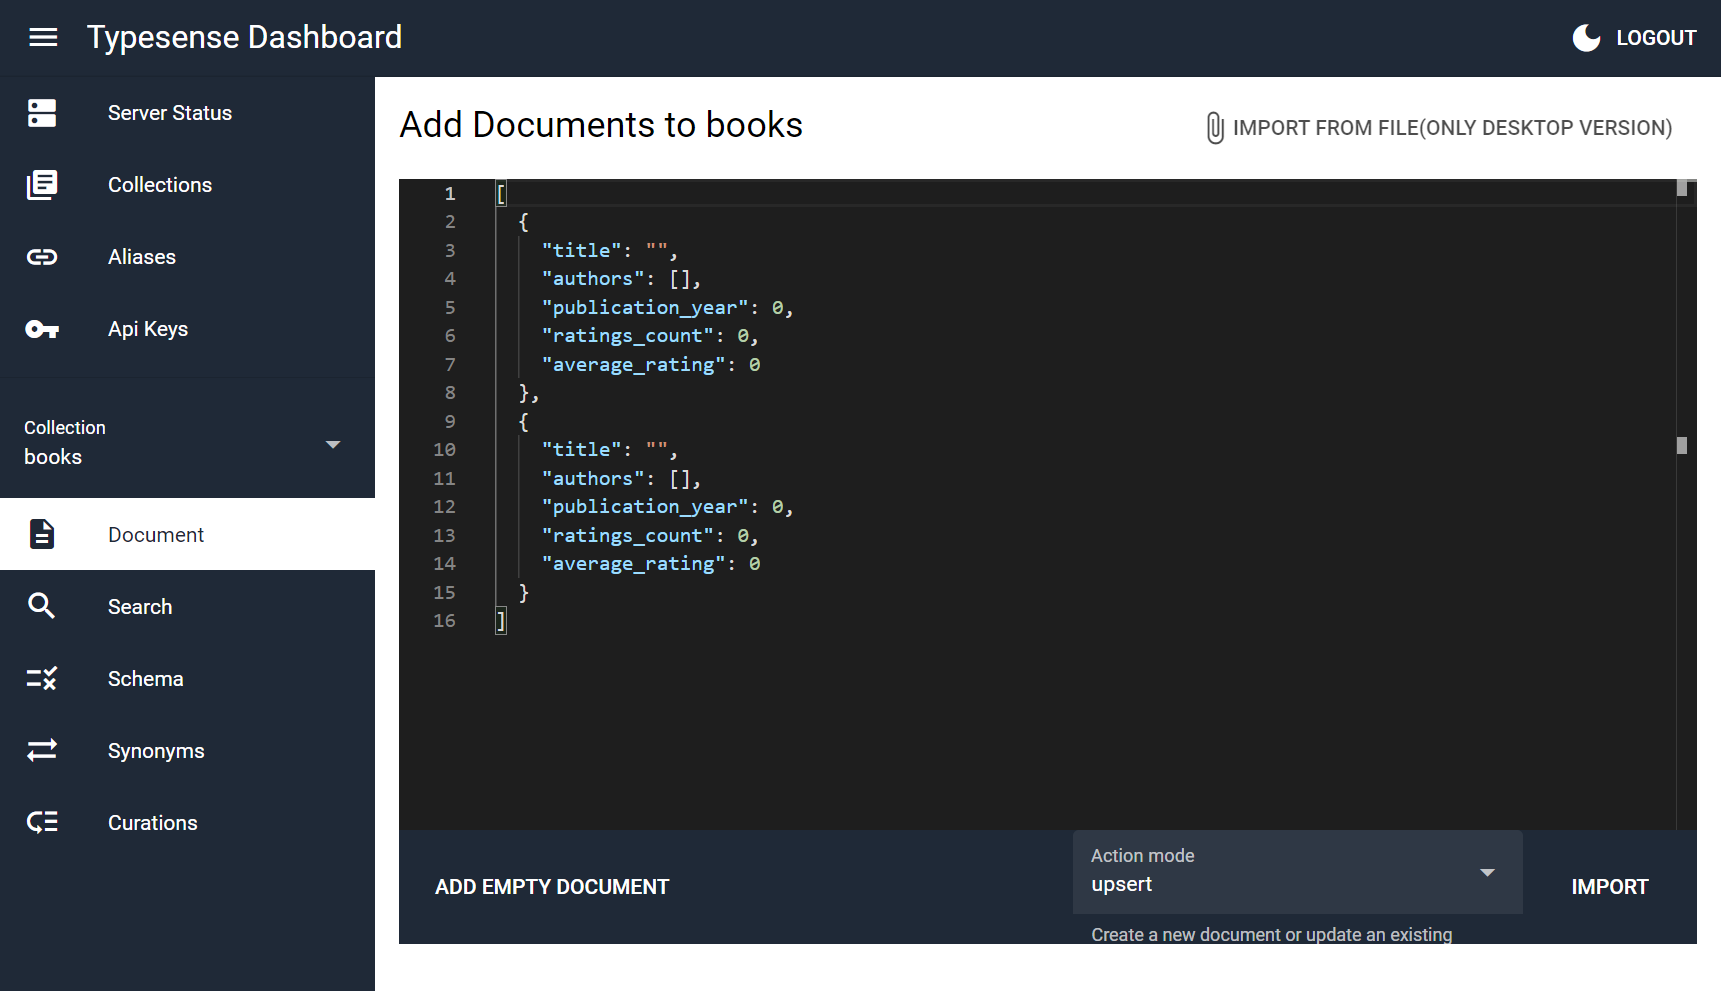
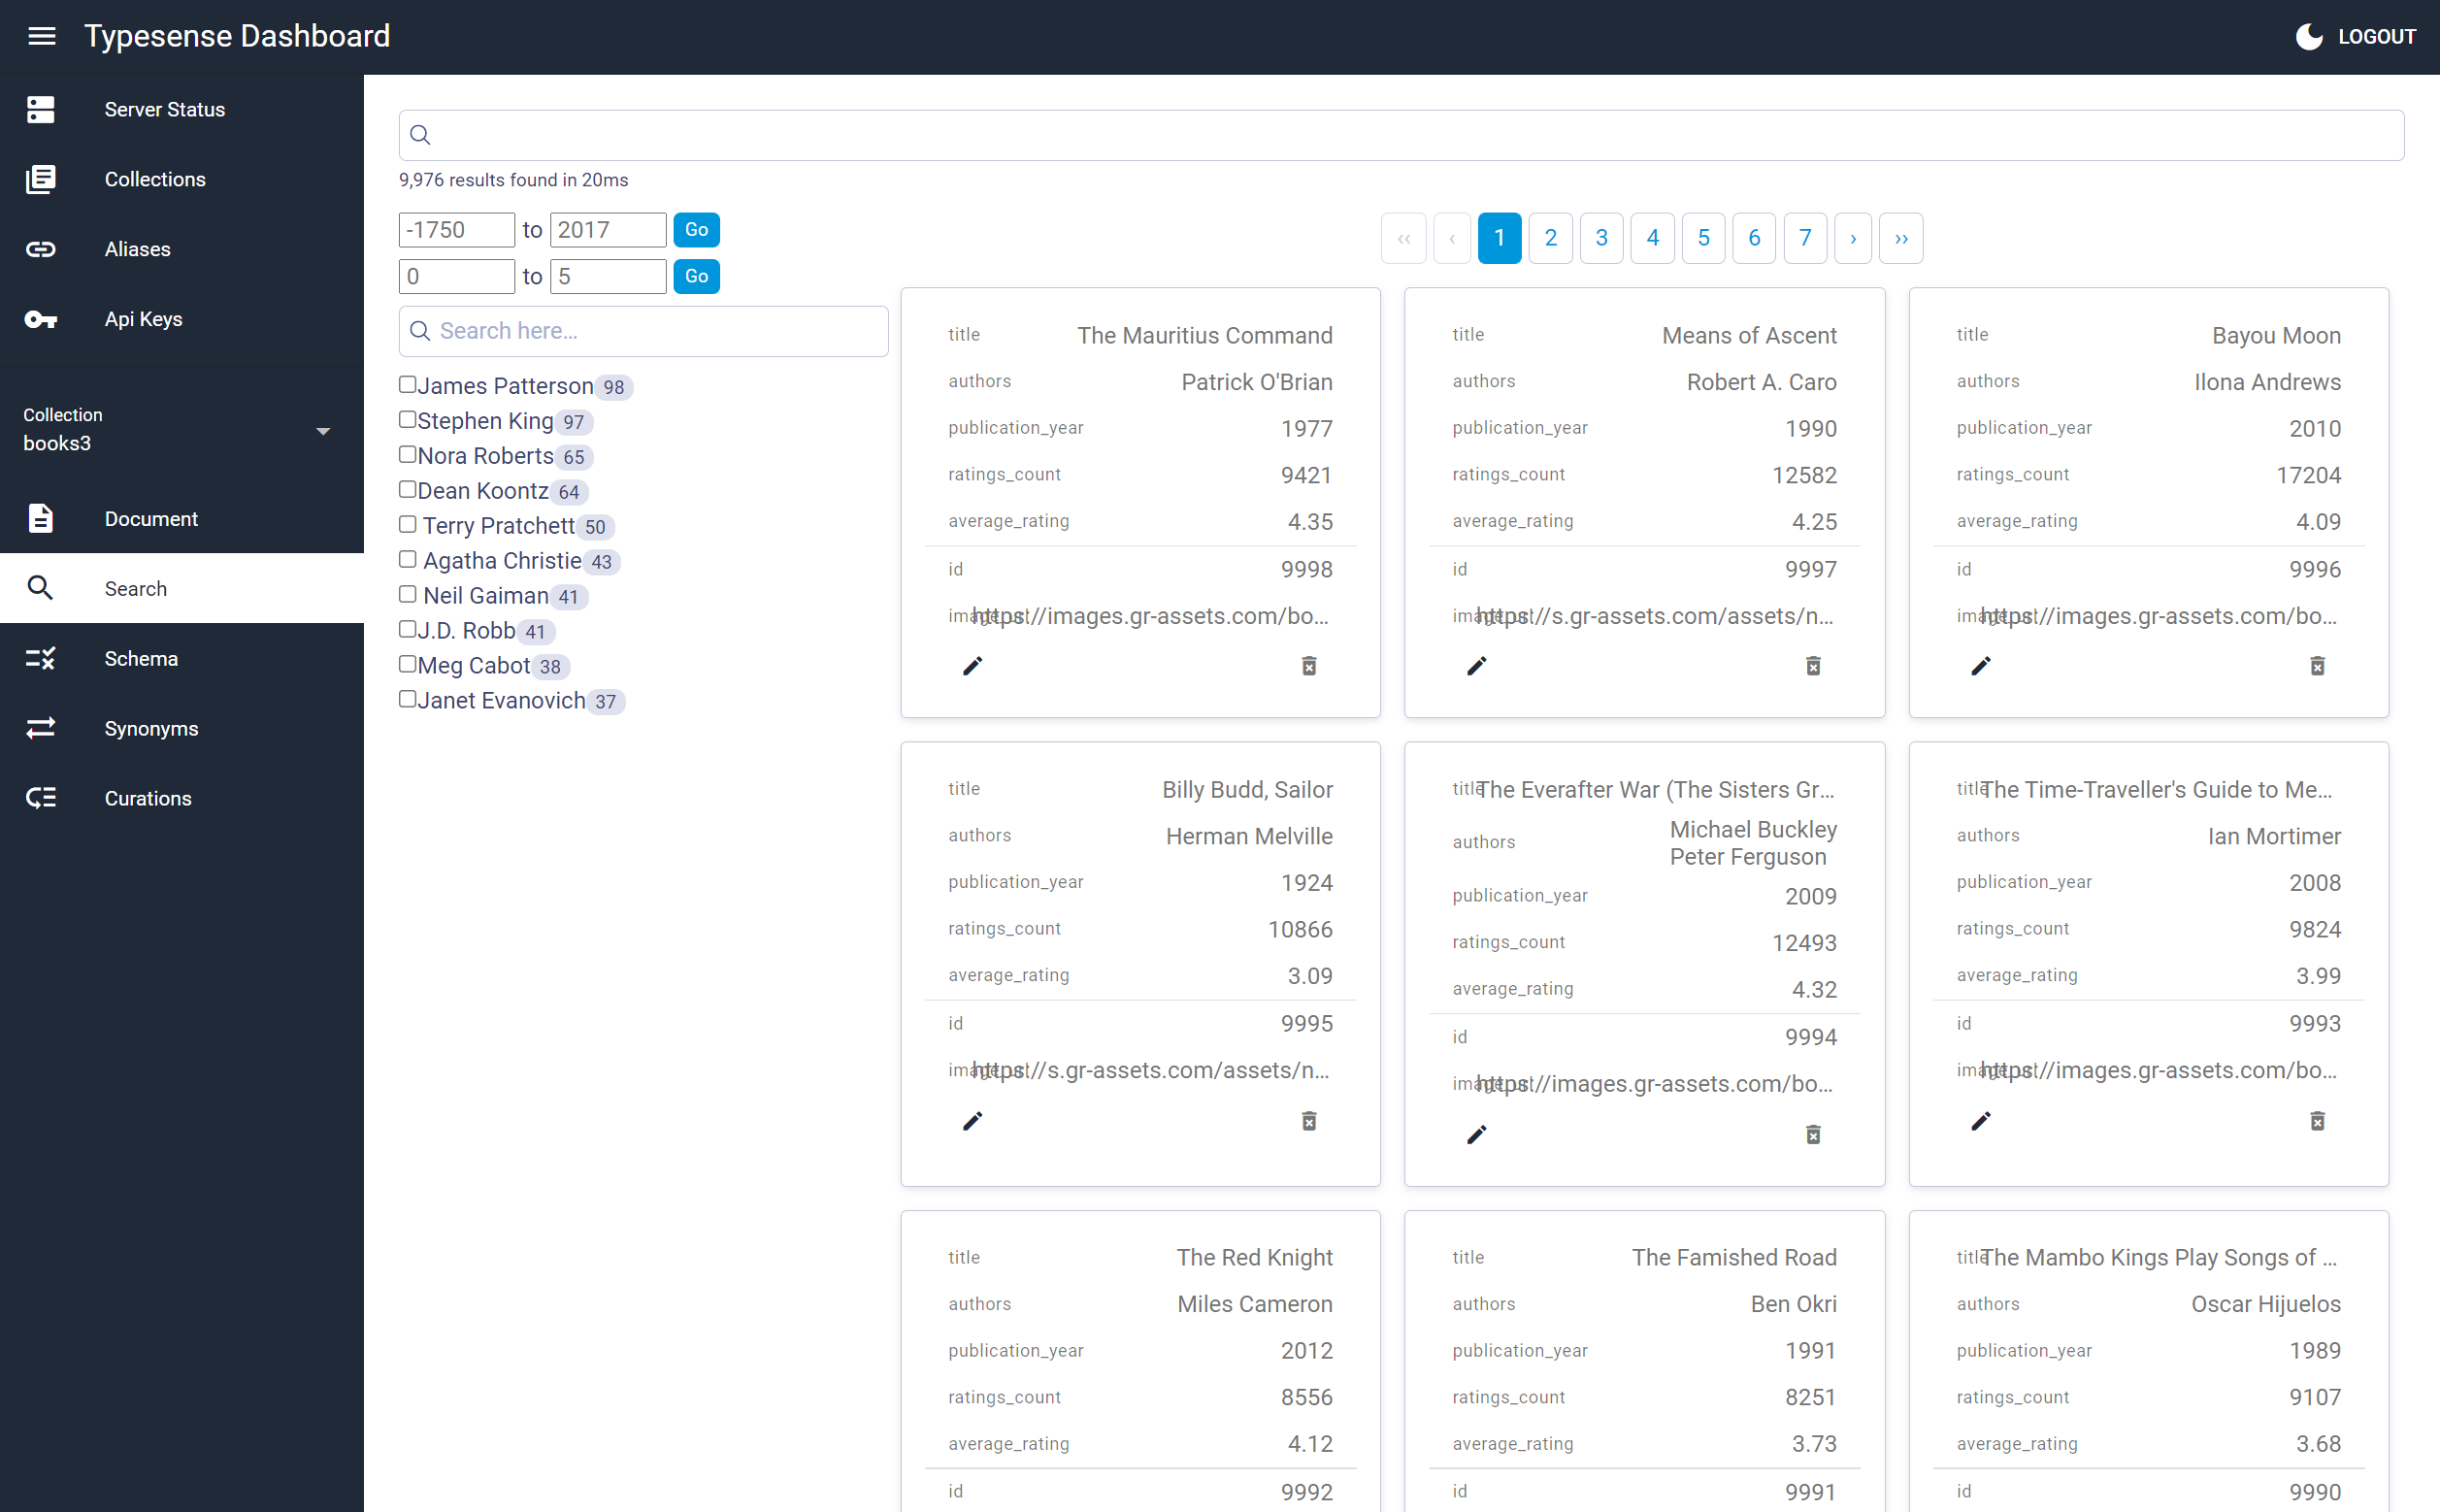
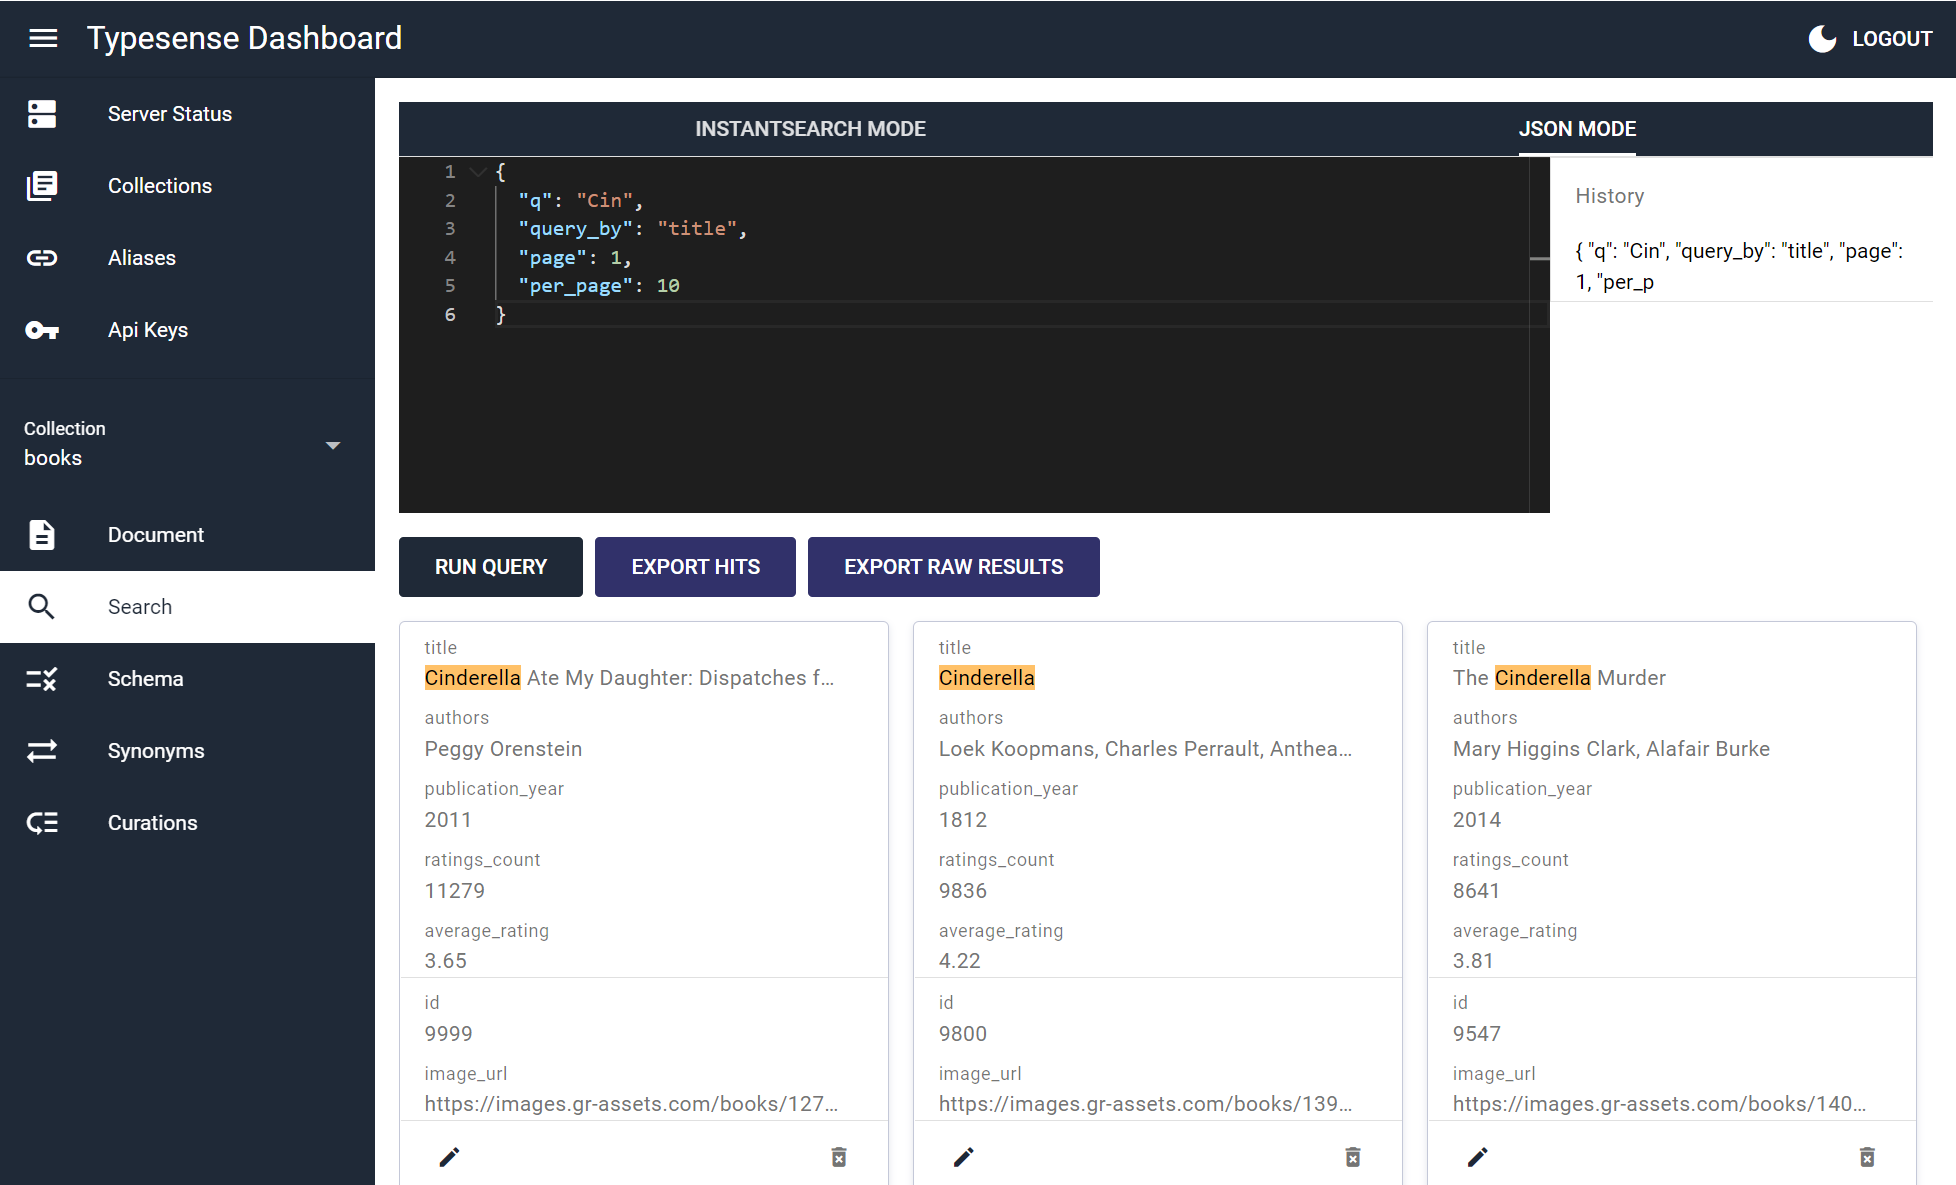
Screenshots
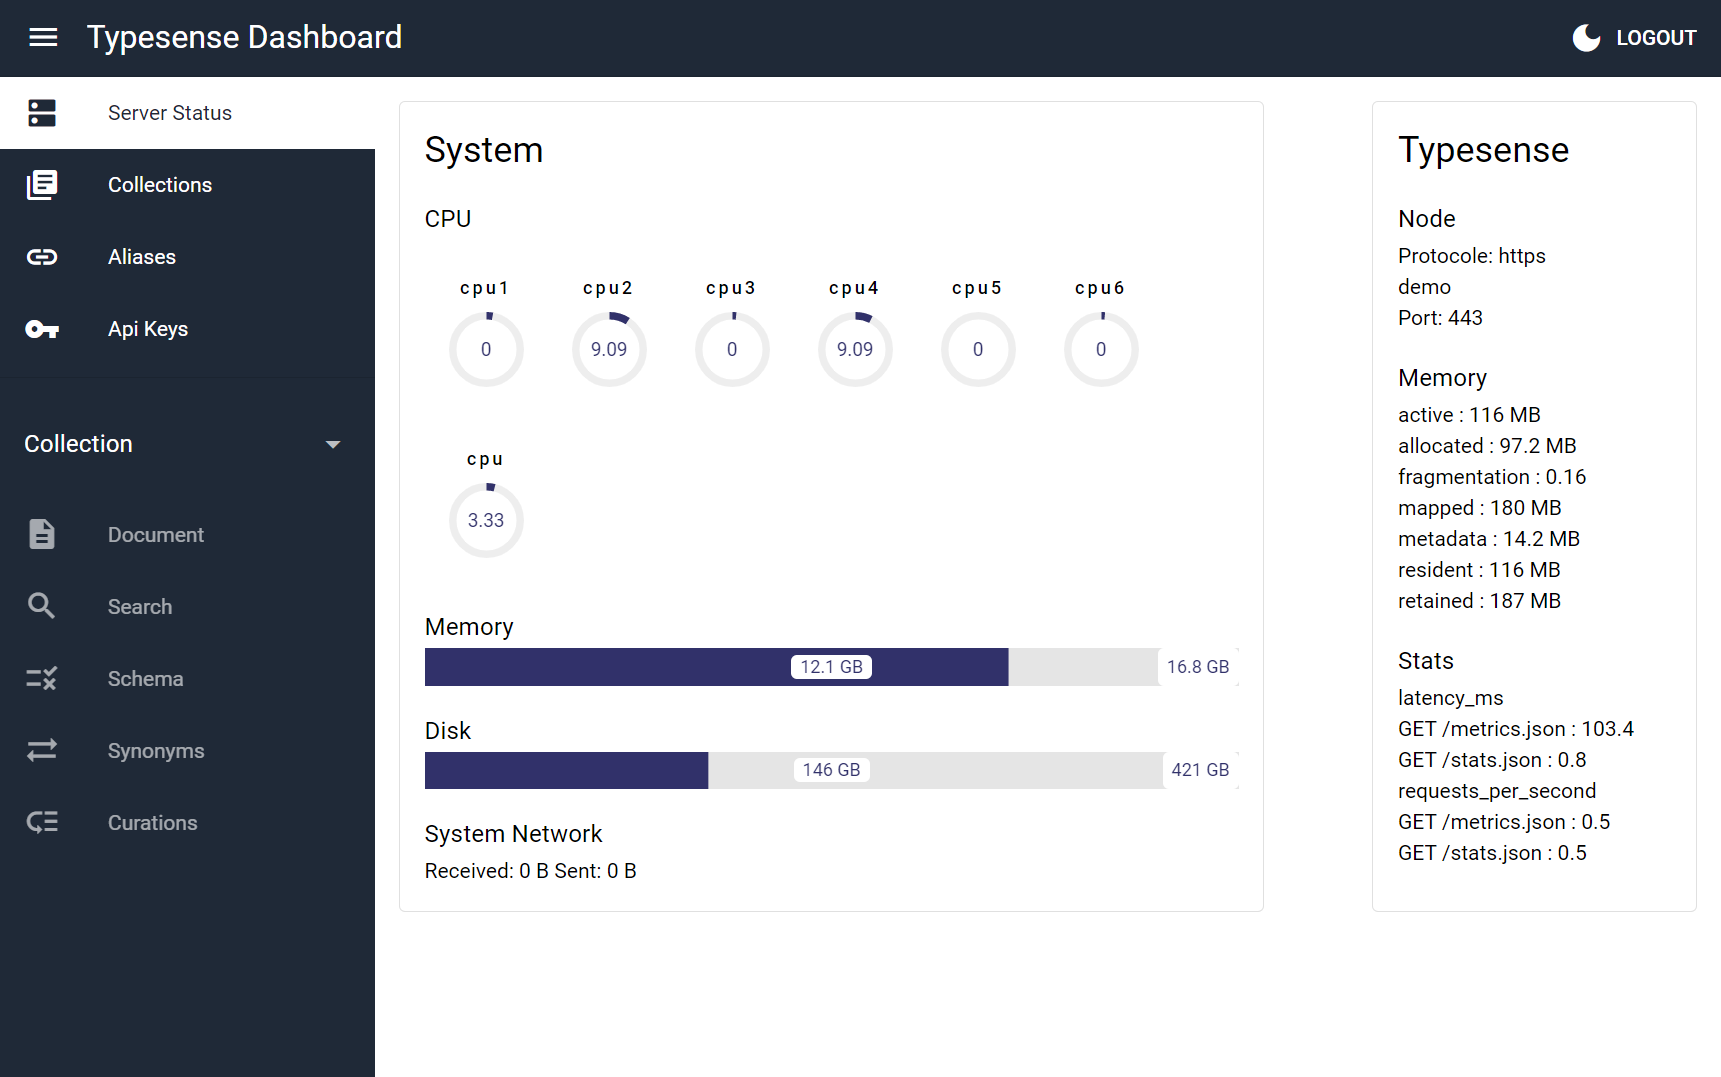
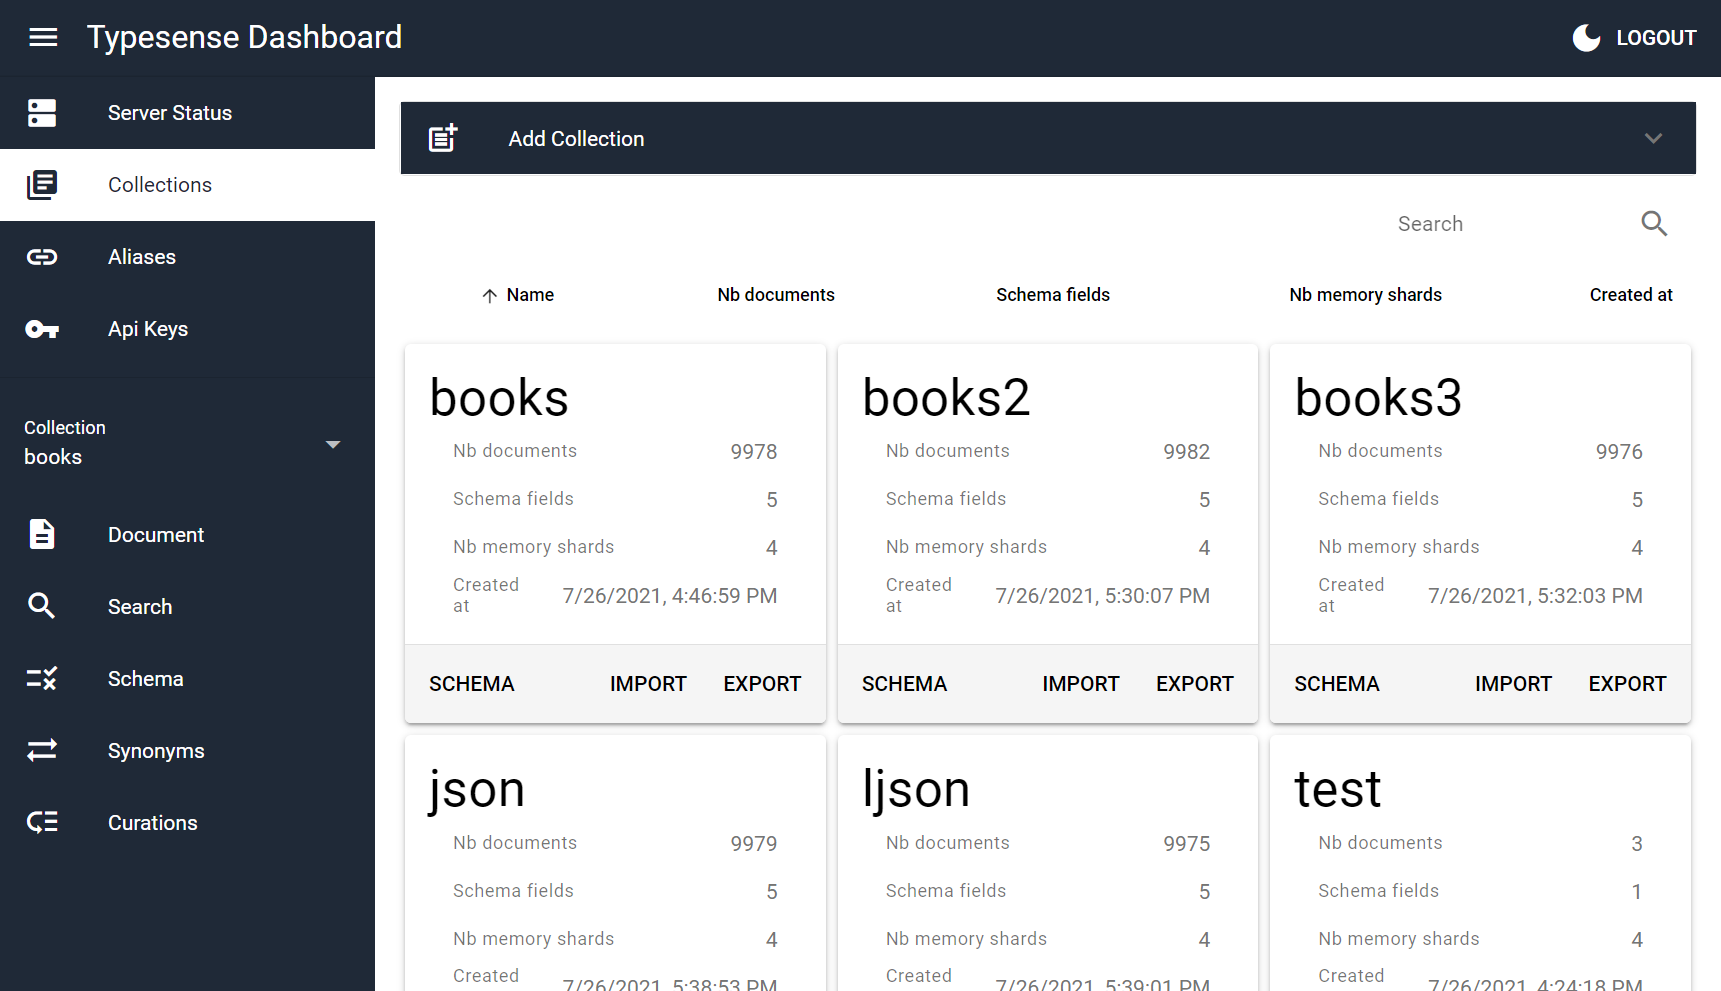
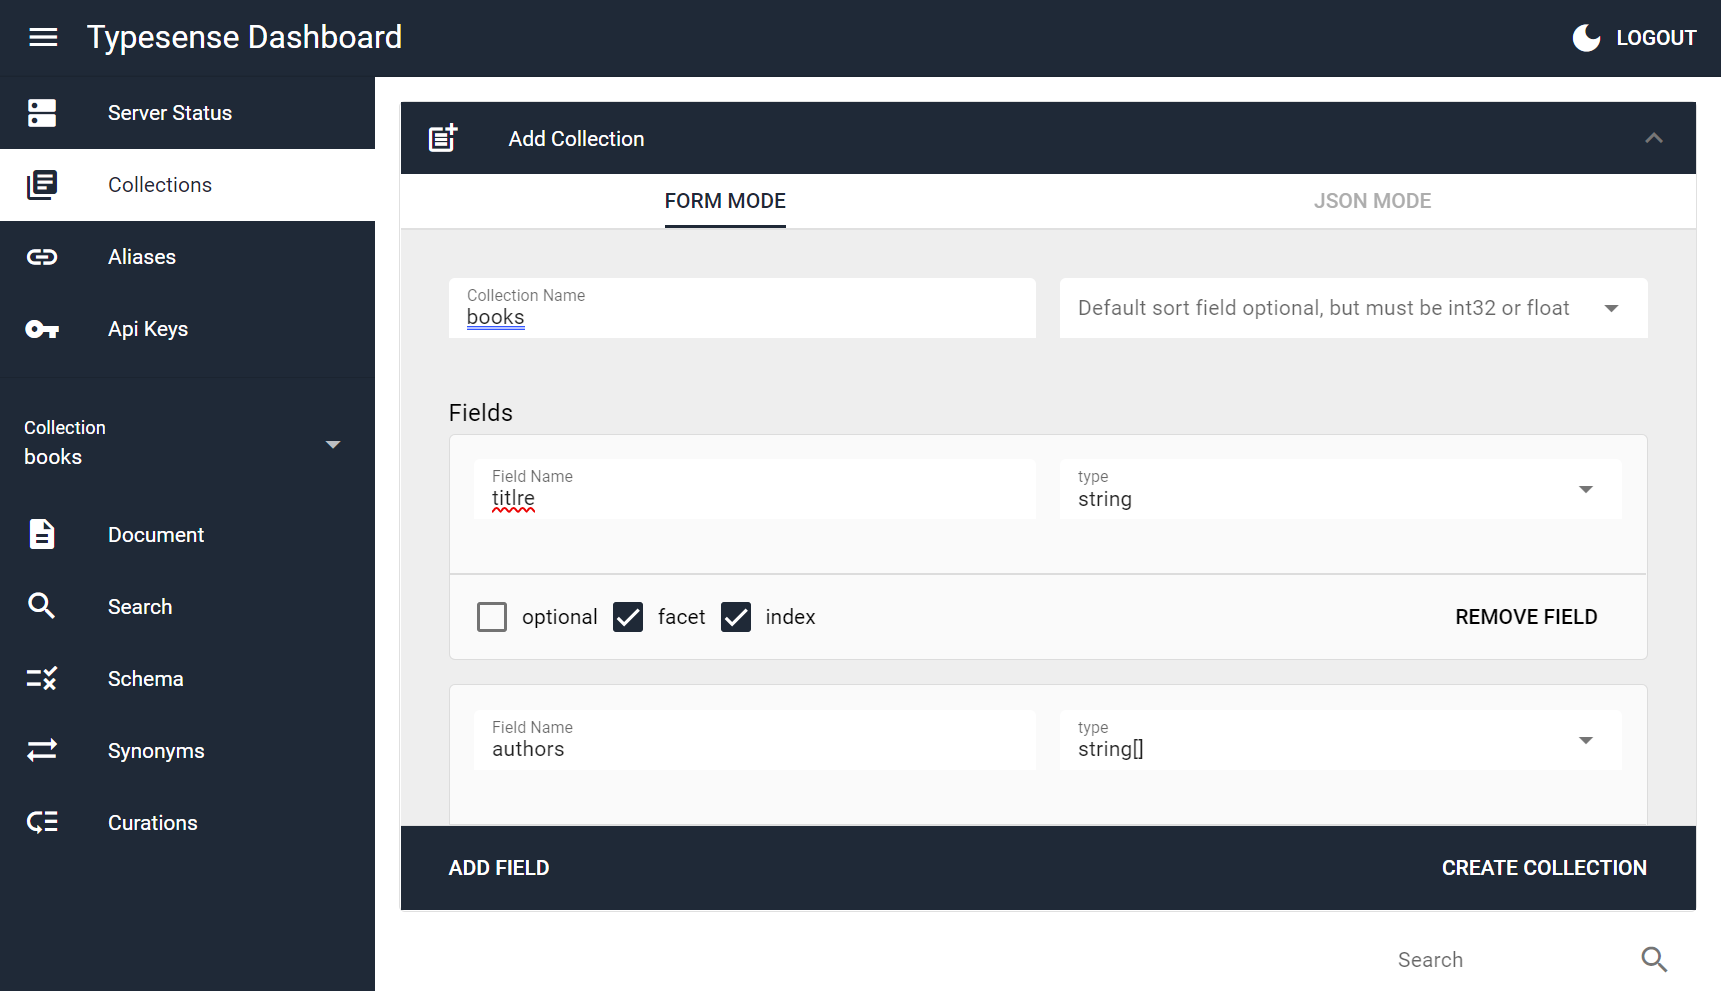
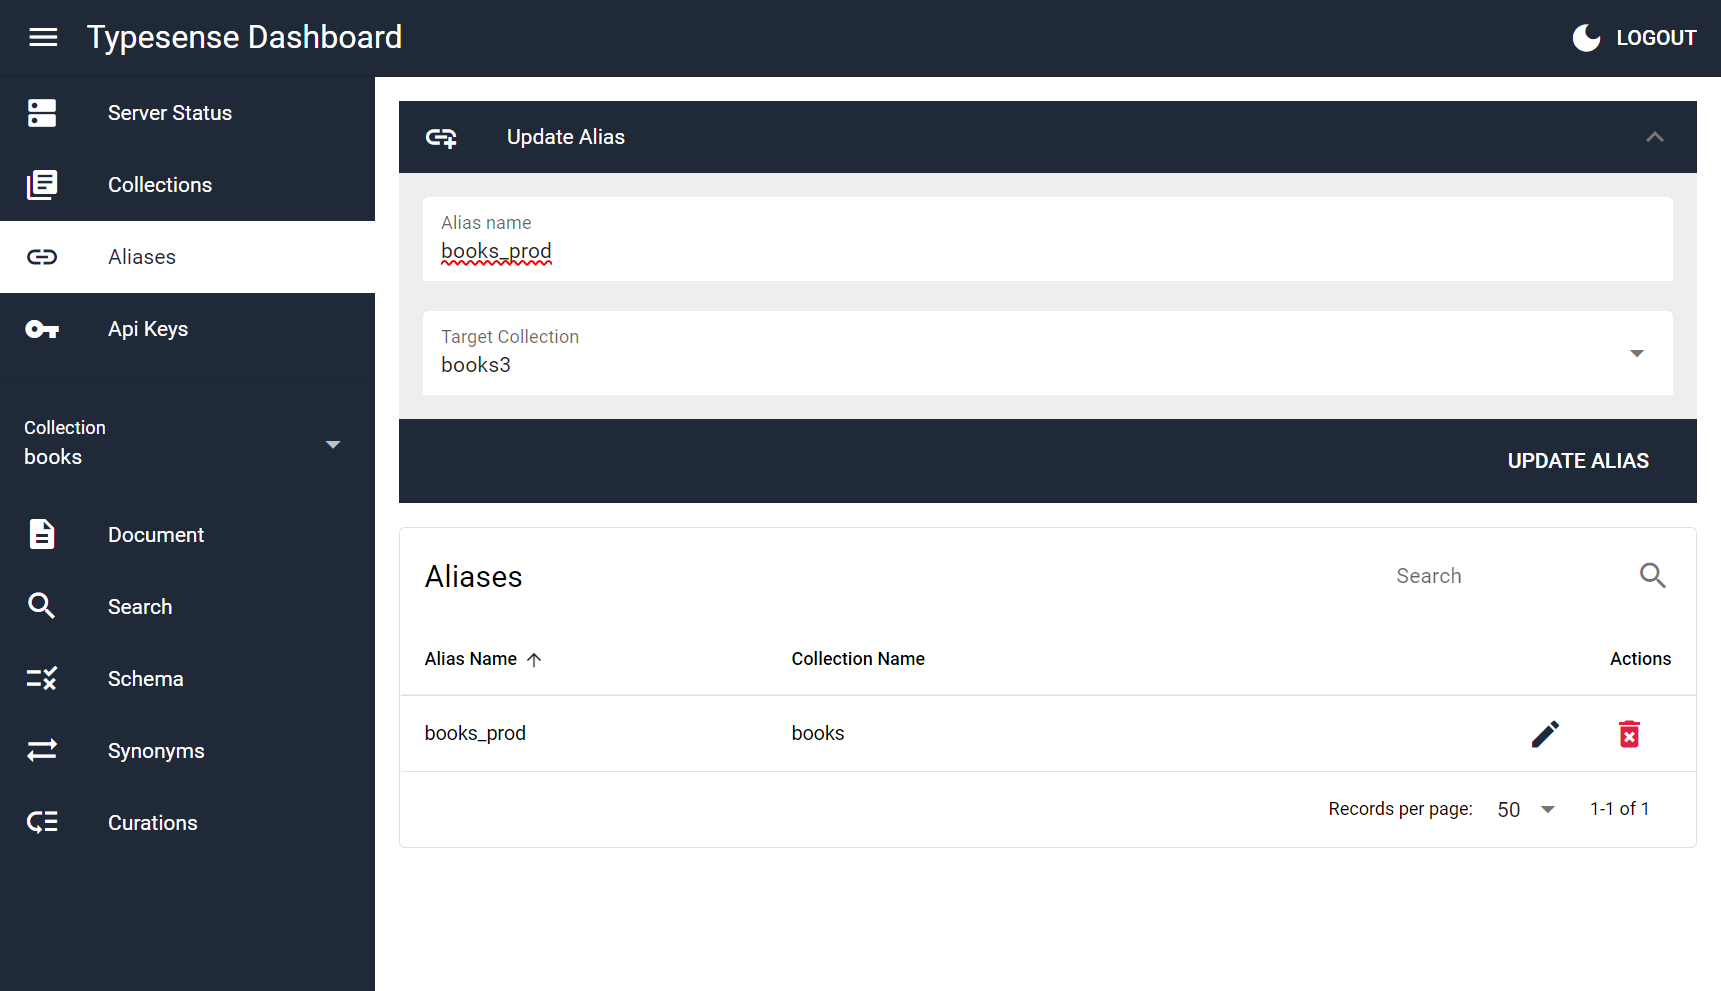
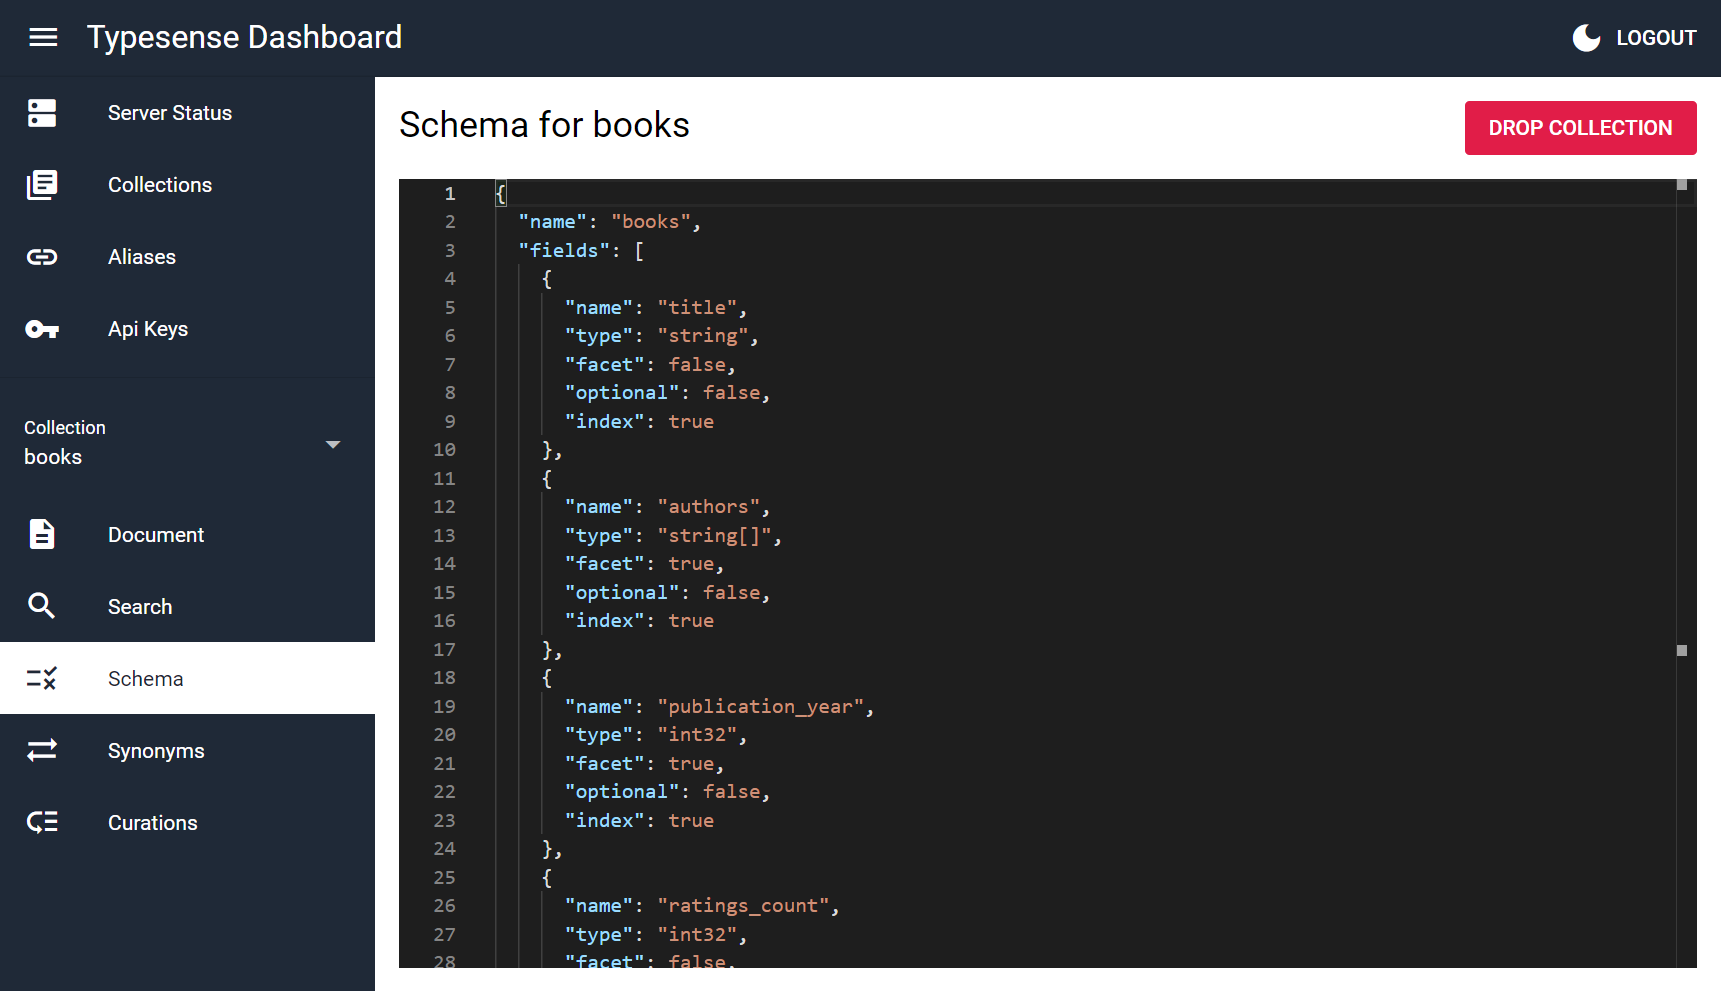
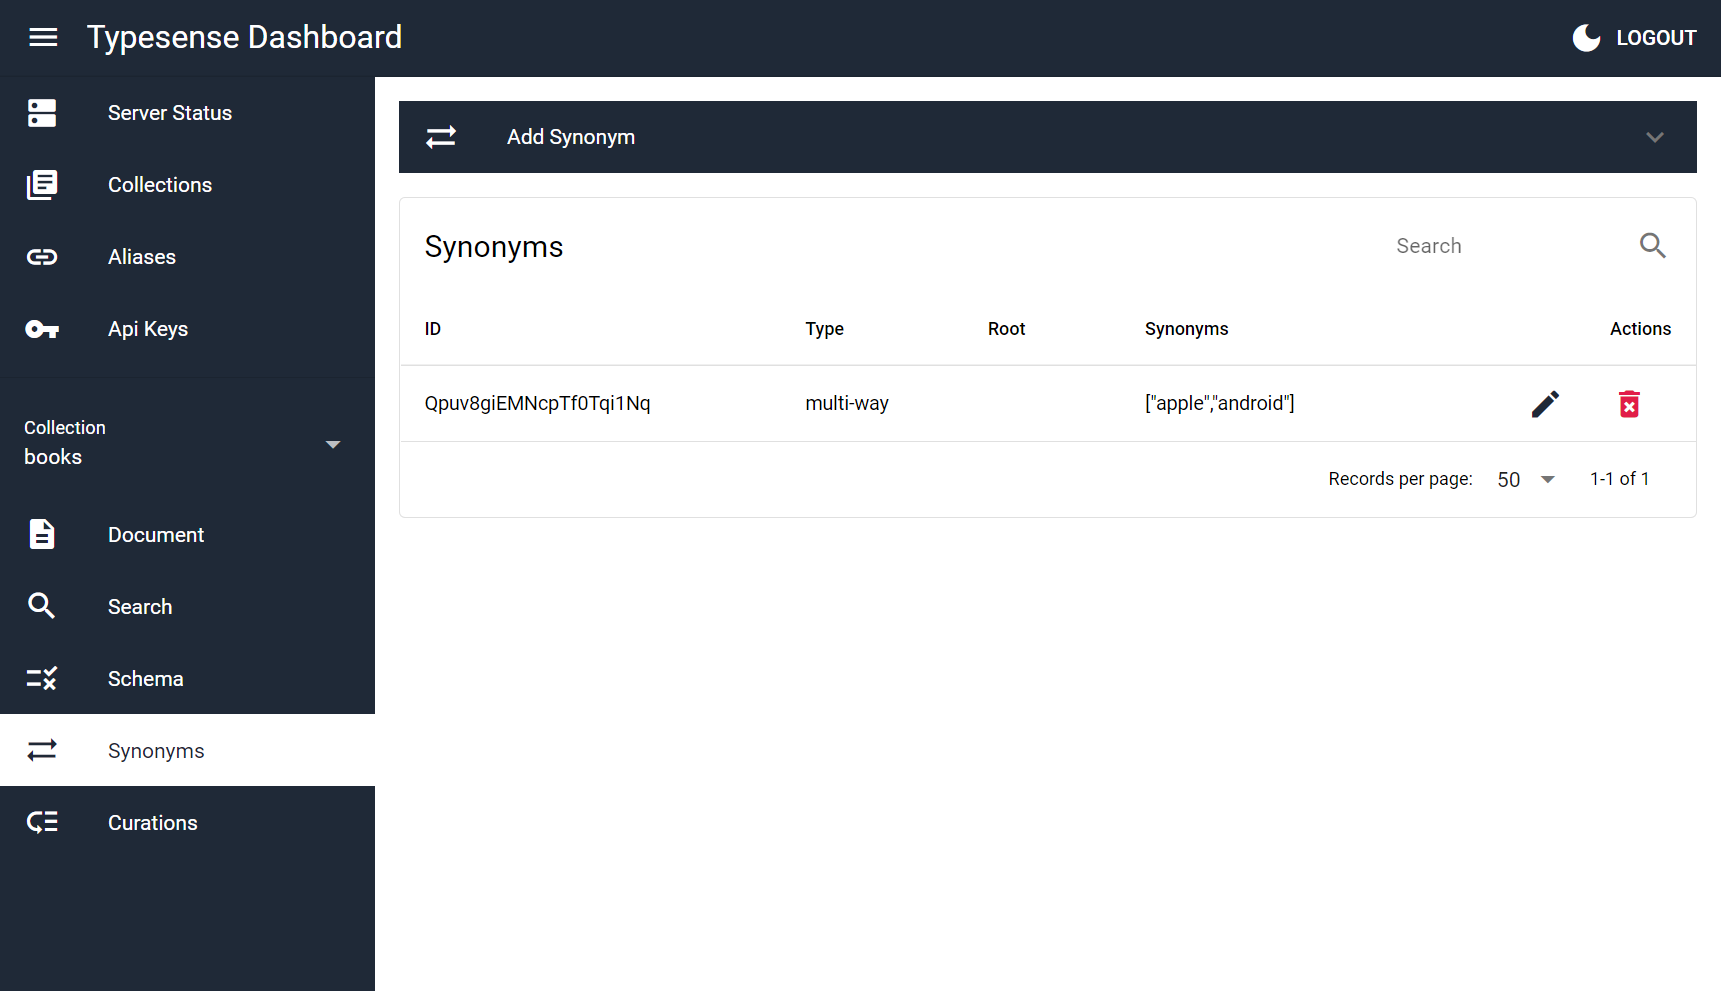
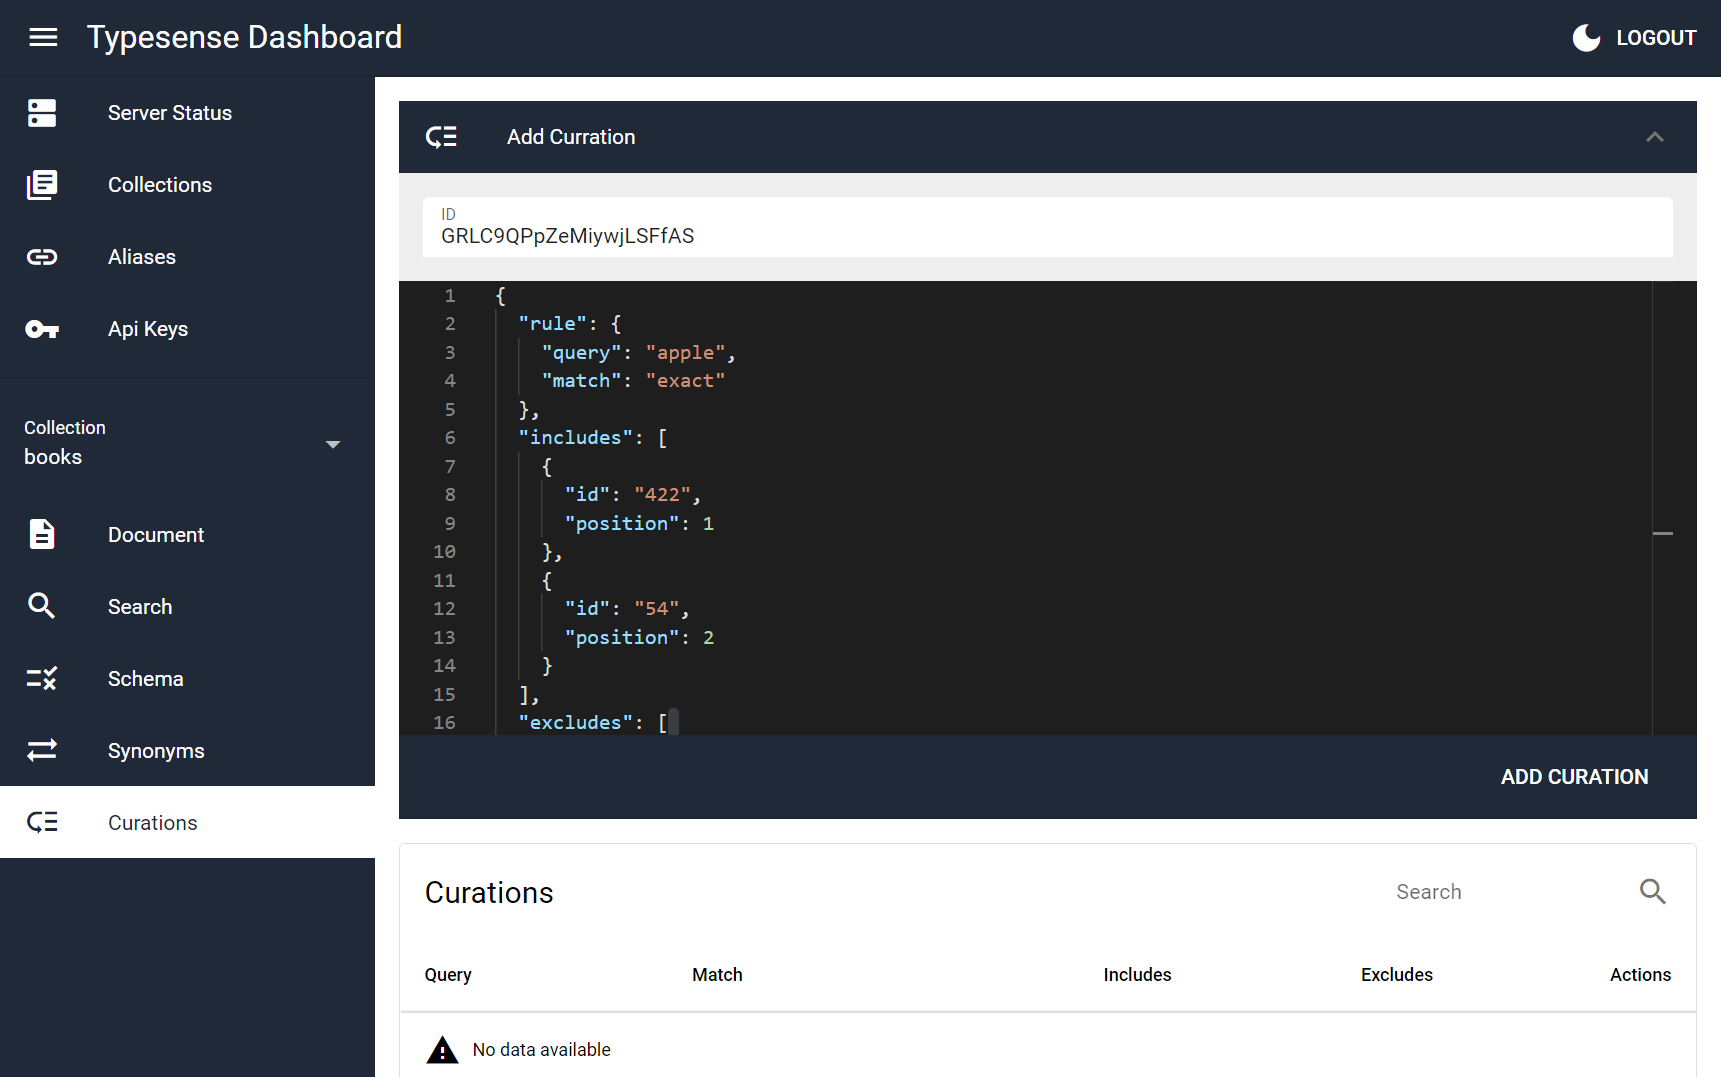
Known Issues and Limitations
- API features not yet implemented:
- create Snapshot
- delete by query
- Scoped Search Key generation
Development
Install the dependencies
yarn
Start the app in development mode (hot-code reloading, error reporting, etc.)
quasar dev
quasar dev -m electron --devtools
Lint the files
yarn lint
# or
npm run lint
Format the files
yarn format
# or
npm run format
Build the app for production
quasar build
quasar build --mode electron --target all